
This article is based on publicly available IR materials and is not a recommendation to buy or sell any specific securities.
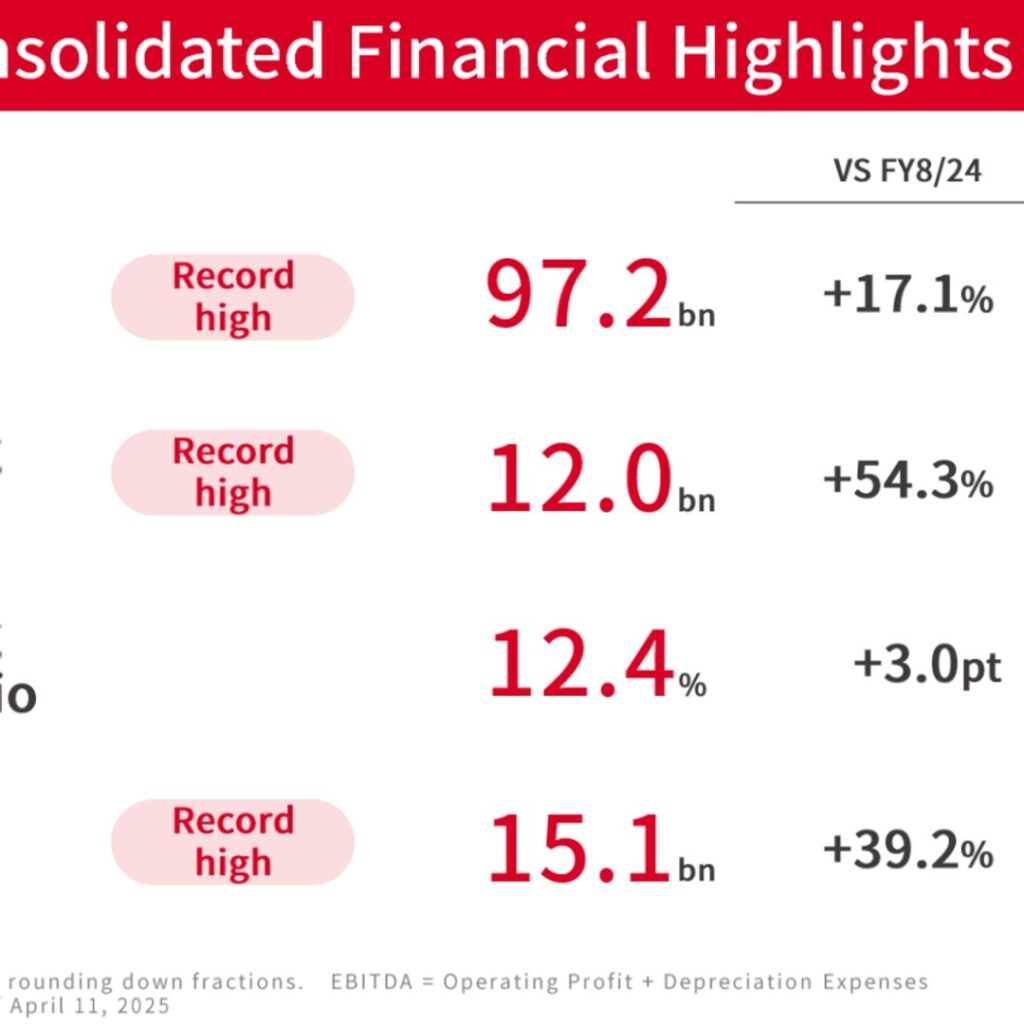
JINS Holdings Inc. (3046) reported record-high full-year results for FY8/25 (the fiscal year ended August 31, 2025). Consolidated sales reached 97.2bn (+17.1% year on year), operating profit was 12.0bn (+54.3%), and net income was 8.3bn (+78.3%) — all record highs, and every line came in above the company’s revised forecast. Growth was led by strong same-store sales in Japan (+16.5% for the year) alongside improved overseas profitability, particularly a recovery in China and strong momentum in Taiwan.
Note: JINS Holdings uses an August fiscal year-end. This article covers the fiscal year ended August 31, 2025, which the company labels “FY8/25” and which this site classifies as FY2025; the company’s next forecast period is labelled “FY8/26.” All figures are transcribed as reported in the company’s English-language earnings presentation (Unit: JPY; “bn” = billion yen; “Co.E” = company estimate; EBITDA = Operating Profit + Depreciation Expenses).
Consolidated Results (Full-Year Actual)
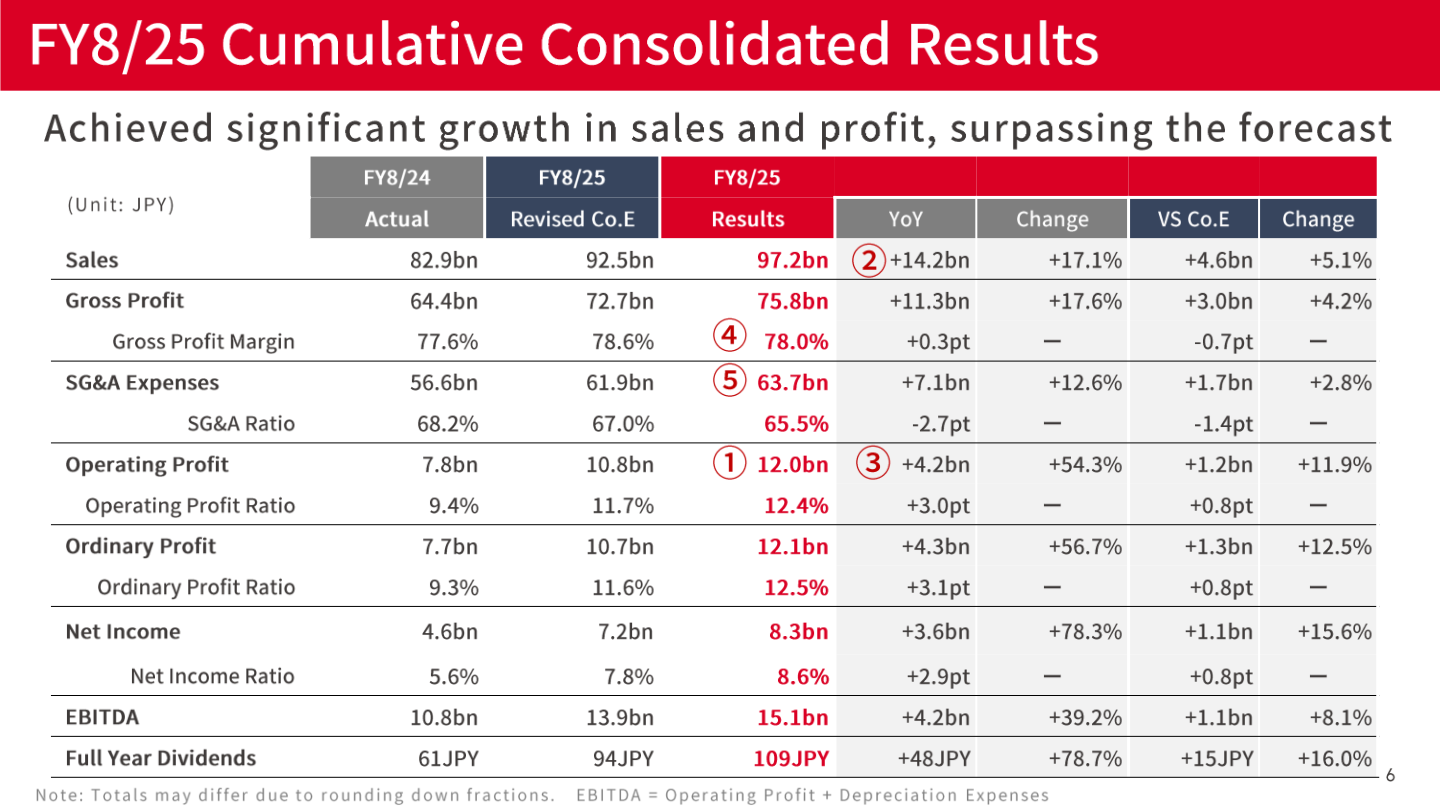
Sales rose 17.1% year on year to a record 97.2bn, exceeding the revised company forecast by 5.1%. Gross profit margin improved 0.3pt to 78.0% on a favorable product mix, while the SG&A ratio fell 2.7pt to 65.5% as the business scaled. As a result, operating profit jumped 54.3% to 12.0bn and the operating profit ratio expanded 3.0pt to 12.4%. Net income rose 78.3% to 8.3bn, and the full-year dividend was raised to 109 yen (from 61 yen a year earlier).
| Item | FY8/24 Actual | FY8/25 Revised Co.E | FY8/25 Results | YoY | VS Co.E |
|---|---|---|---|---|---|
| Sales | 82.9bn | 92.5bn | 97.2bn | +17.1% | +5.1% |
| Gross Profit | 64.4bn | 72.7bn | 75.8bn | +17.6% | +4.2% |
| Gross Profit Margin | 77.6% | 78.6% | 78.0% | +0.3pt | -0.7pt |
| SG&A Expenses | 56.6bn | 61.9bn | 63.7bn | +12.6% | +2.8% |
| SG&A Ratio | 68.2% | 67.0% | 65.5% | -2.7pt | -1.4pt |
| Operating Profit | 7.8bn | 10.8bn | 12.0bn | +54.3% | +11.9% |
| Operating Profit Ratio | 9.4% | 11.7% | 12.4% | +3.0pt | +0.8pt |
| Ordinary Profit | 7.7bn | 10.7bn | 12.1bn | +56.7% | +12.5% |
| Net Income | 4.6bn | 7.2bn | 8.3bn | +78.3% | +15.6% |
| EBITDA | 10.8bn | 13.9bn | 15.1bn | +39.2% | +8.1% |
| Full-Year Dividends | 61 yen | 94 yen | 109 yen | +78.7% | +16.0% |
Segment Results
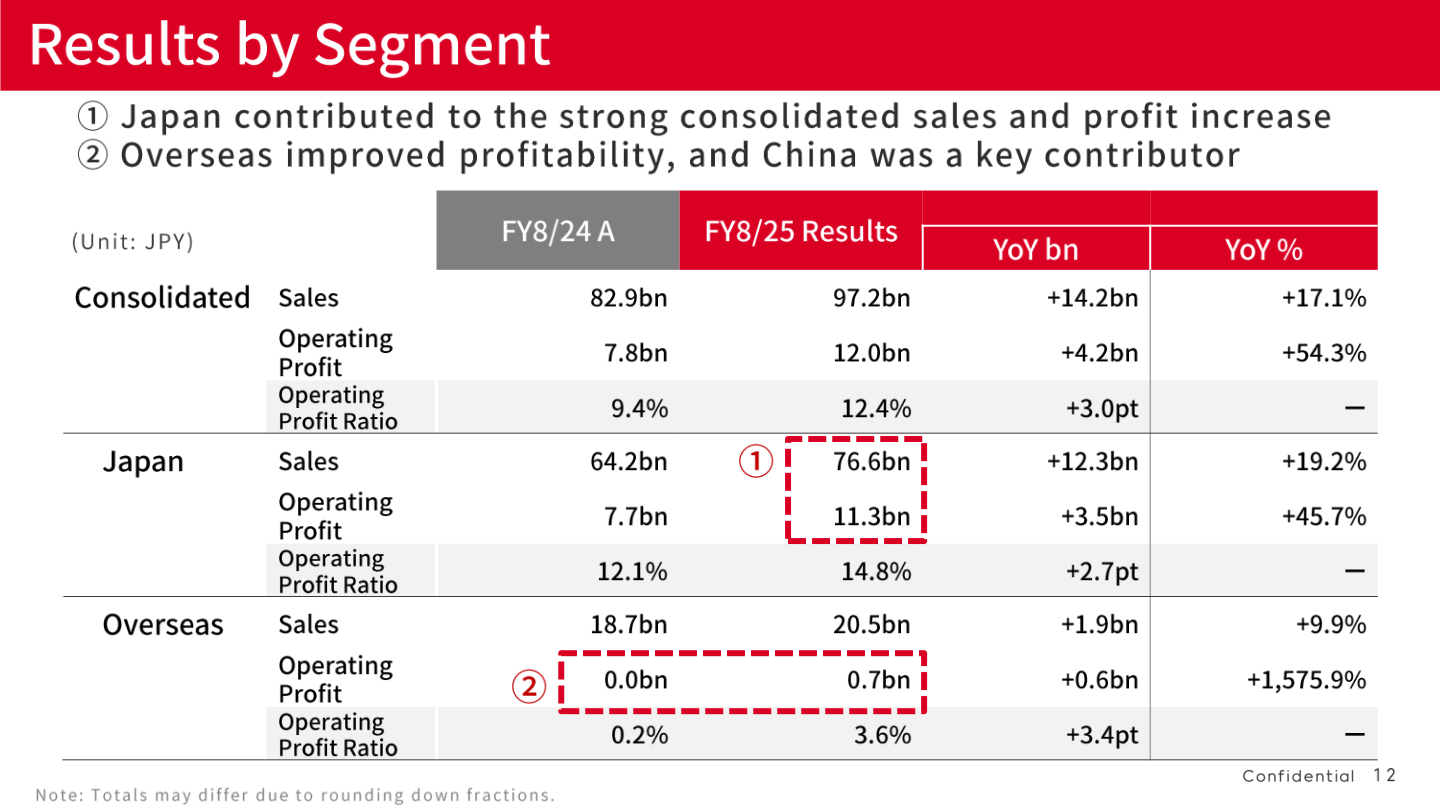
The Japan segment drove the consolidated performance, with sales up 19.2% to 76.6bn and operating profit up 45.7% to 11.3bn (operating profit ratio 14.8%, +2.7pt). Overseas, sales grew 9.9% to 20.5bn while operating profit increased to 0.7bn from 0.0bn a year earlier (+1,575.9%), lifting the overseas operating profit ratio to 3.6% (+3.4pt); China turned profitable through restructuring and Taiwan contributed strongly to both sales and profit. On a consolidated basis, the store network reached 789 locations at year-end, a net increase of 53 stores.
| Segment | Metric | FY8/25 Results | FY8/24 Actual | YoY |
|---|---|---|---|---|
| Japan | Sales | 76.6bn | 64.2bn | +19.2% |
| Japan | Operating Profit | 11.3bn | 7.7bn | +45.7% |
| Japan | Operating Profit Ratio | 14.8% | 12.1% | +2.7pt |
| Overseas | Sales | 20.5bn | 18.7bn | +9.9% |
| Overseas | Operating Profit | 0.7bn | 0.0bn | +1,575.9% |
| Overseas | Operating Profit Ratio | 3.6% | 0.2% | +3.4pt |
FY8/26 Forecast
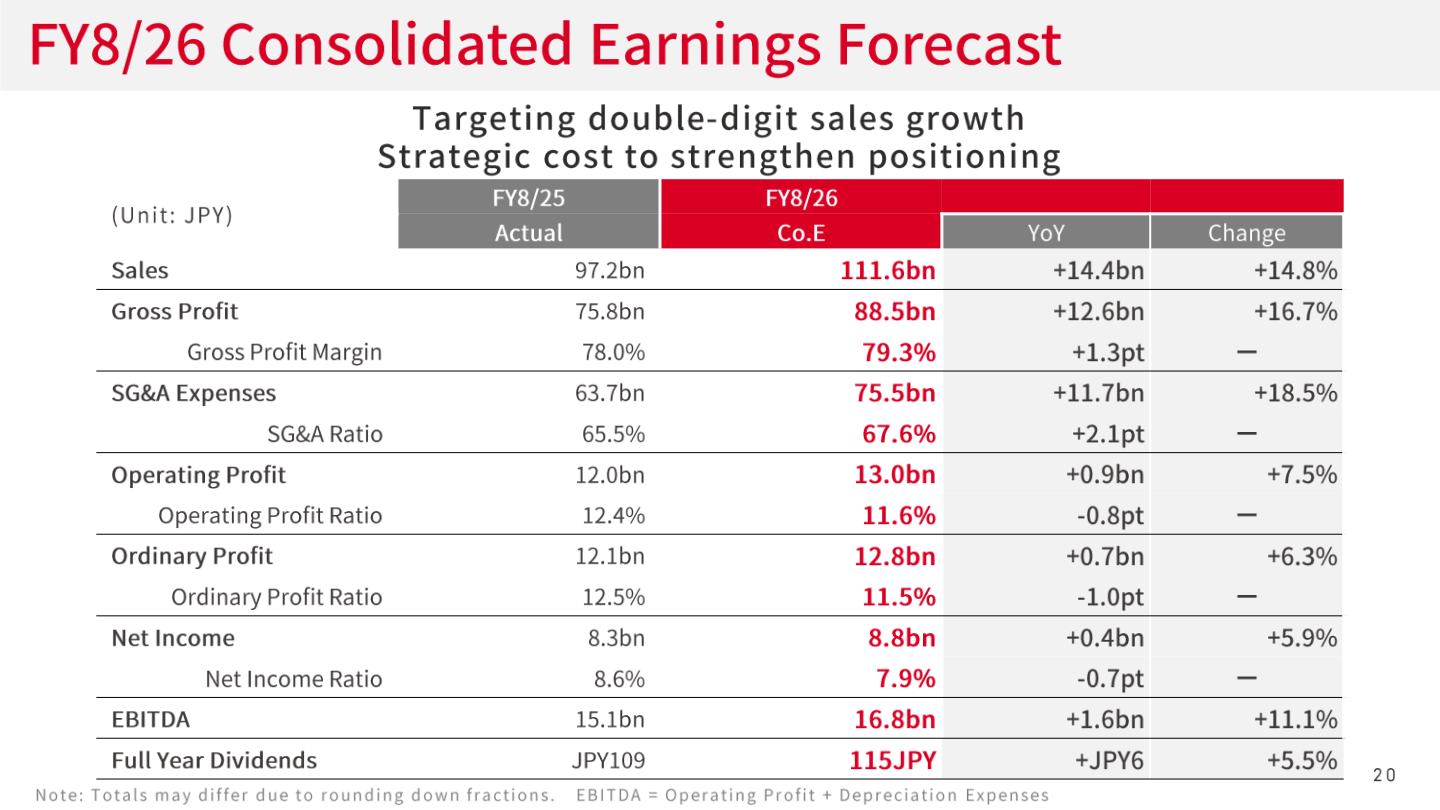
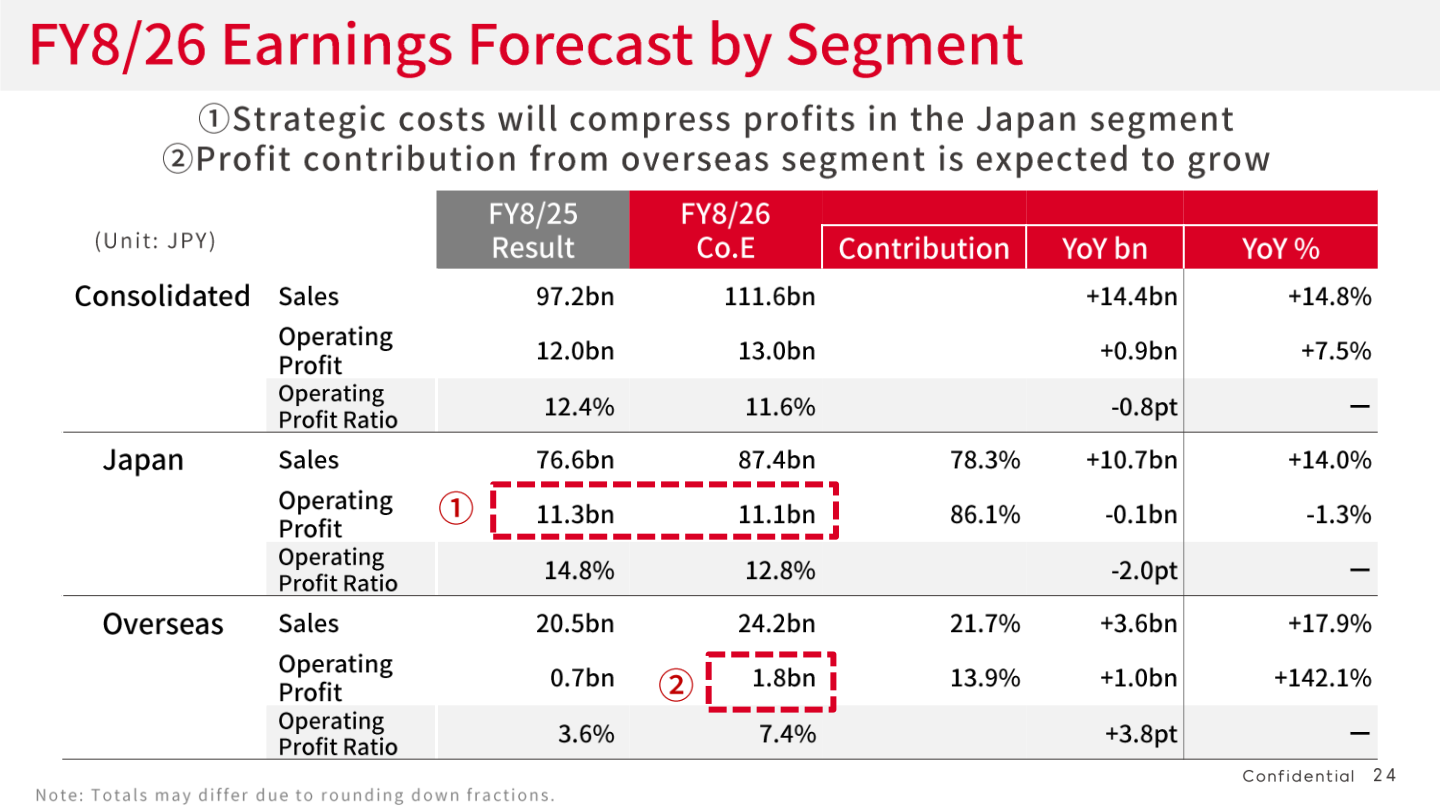
For FY8/26, JINS Holdings is targeting double-digit sales growth, guiding for sales of 111.6bn (+14.8%) and operating profit of 13.0bn (+7.5%), with EBITDA of 16.8bn (+11.1%). Profit growth is expected to slow temporarily as the company incurs 2.4bn of strategic costs in Japan to strengthen its positioning; the operating profit ratio is forecast at 11.6% (-0.8pt). By segment, Japan sales are guided to 87.4bn (+14.0%) with operating profit of 11.1bn (-1.3%), while overseas sales are guided to 24.2bn (+17.9%) with operating profit of 1.8bn (+142.1%).
| Item | FY8/25 Actual | FY8/26 Co.E | YoY |
|---|---|---|---|
| Sales | 97.2bn | 111.6bn | +14.8% |
| Gross Profit | 75.8bn | 88.5bn | +16.7% |
| Gross Profit Margin | 78.0% | 79.3% | +1.3pt |
| SG&A Expenses | 63.7bn | 75.5bn | +18.5% |
| Operating Profit | 12.0bn | 13.0bn | +7.5% |
| Operating Profit Ratio | 12.4% | 11.6% | -0.8pt |
| Ordinary Profit | 12.1bn | 12.8bn | +6.3% |
| Net Income | 8.3bn | 8.8bn | +5.9% |
| EBITDA | 15.1bn | 16.8bn | +11.1% |
| Full-Year Dividends | 109 yen | 115 yen | +5.5% |
Shareholder Returns
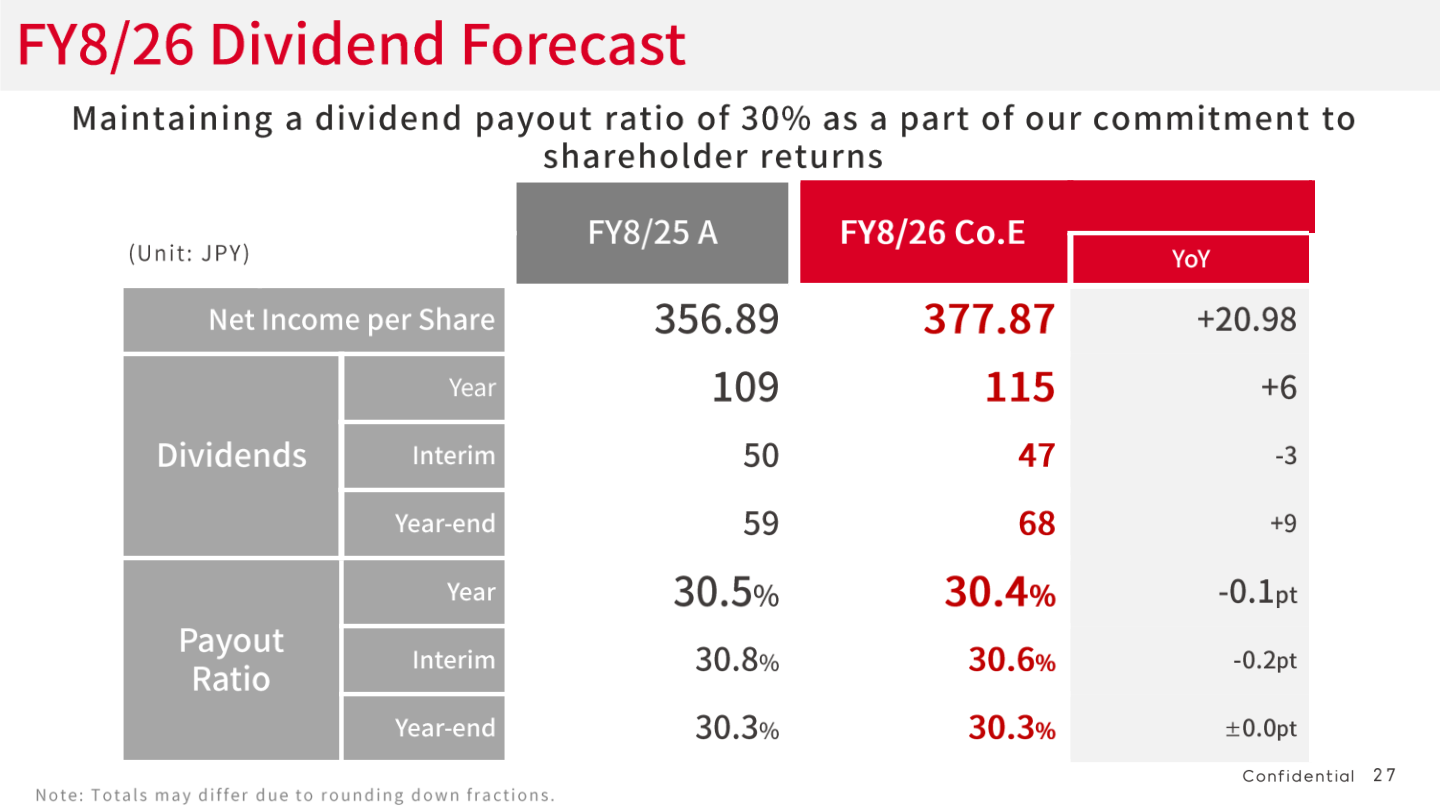
JINS Holdings maintains a dividend payout ratio of around 30%. For FY8/25 the full-year dividend was 109 yen (interim 50 yen, year-end 59 yen), a payout ratio of 30.5%, with net income per share of 356.89 yen. For FY8/26 the company forecasts a full-year dividend of 115 yen (+6 yen; interim 47 yen, year-end 68 yen) and net income per share of 377.87 yen, keeping the full-year payout ratio at 30.4%.
| Item | FY8/25 Actual | FY8/26 Co.E | YoY |
|---|---|---|---|
| Net Income per Share | 356.89 yen | 377.87 yen | +20.98 yen |
| Dividends (Year) | 109 yen | 115 yen | +6 yen |
| Dividends (Interim) | 50 yen | 47 yen | -3 yen |
| Dividends (Year-end) | 59 yen | 68 yen | +9 yen |
| Payout Ratio (Year) | 30.5% | 30.4% | -0.1pt |
| Payout Ratio (Interim) | 30.8% | 30.6% | -0.2pt |
| Payout Ratio (Year-end) | 30.3% | 30.3% | ±0.0pt |
Topics: Strategic Costs and Global Expansion
The 2.4bn of FY8/26 strategic costs are aimed at enhancing global brand value: flagship stores (1.2bn), entry into new overseas markets (0.2bn), and system investment (1.0bn). The company defines “adjusted operating profit” as accounting operating profit plus strategic costs, which would equate to 15.4bn for FY8/26. On the store network, JINS accelerated openings in FY8/25 (Japan: 49 openings and 4 closures for a net +45; total consolidated stores 789, +53 net), opened a pilot store in the US in January 2025, and expanded its target markets to include Mongolia and Vietnam.
This article is an analysis based on publicly available information and is not a recommendation to buy or sell any specific securities. Investment decisions are your own responsibility.
















