
This article is based on publicly available IR materials and is not a recommendation to buy or sell any specific securities.
Note: DAIKOKUTENBUSSAN CO.,LTD. does not publish an English results presentation; this article is an English translation of the Japanese-language article on our sister site Investalk, which is based on the company’s Japanese-language IR materials, with figures transcribed as reported. This site classifies the most recently completed fiscal year as FY2025; the company labels this period the fiscal year ended May 31, 2026, and the labels used in the text and tables below follow the source materials. Percentages described as “of the previous year” are index figures with the previous year set at 100, as presented in the source materials.
Daikokuten Bussan announced its consolidated results for the fiscal year ended May 31, 2026 (June 1, 2025 to May 31, 2026). Net sales were 319,208 million yen, 109.0% of the previous year, securing higher revenue, but operating profit was 5,297 million yen (54.0% of the previous year), ordinary profit was 5,450 million yen (54.0% of the previous year) and net income was 3,606 million yen (53.2% of the previous year), all falling below the previous year. Same-store sales were 99.8% of the previous year, below the prior-year level, with the impact of price revisions, the “Reiwa rice turmoil” and cannibalization associated with new store openings cited as the factors.
Consolidated Results (Fiscal Year Ended May 31, 2026, Actual)
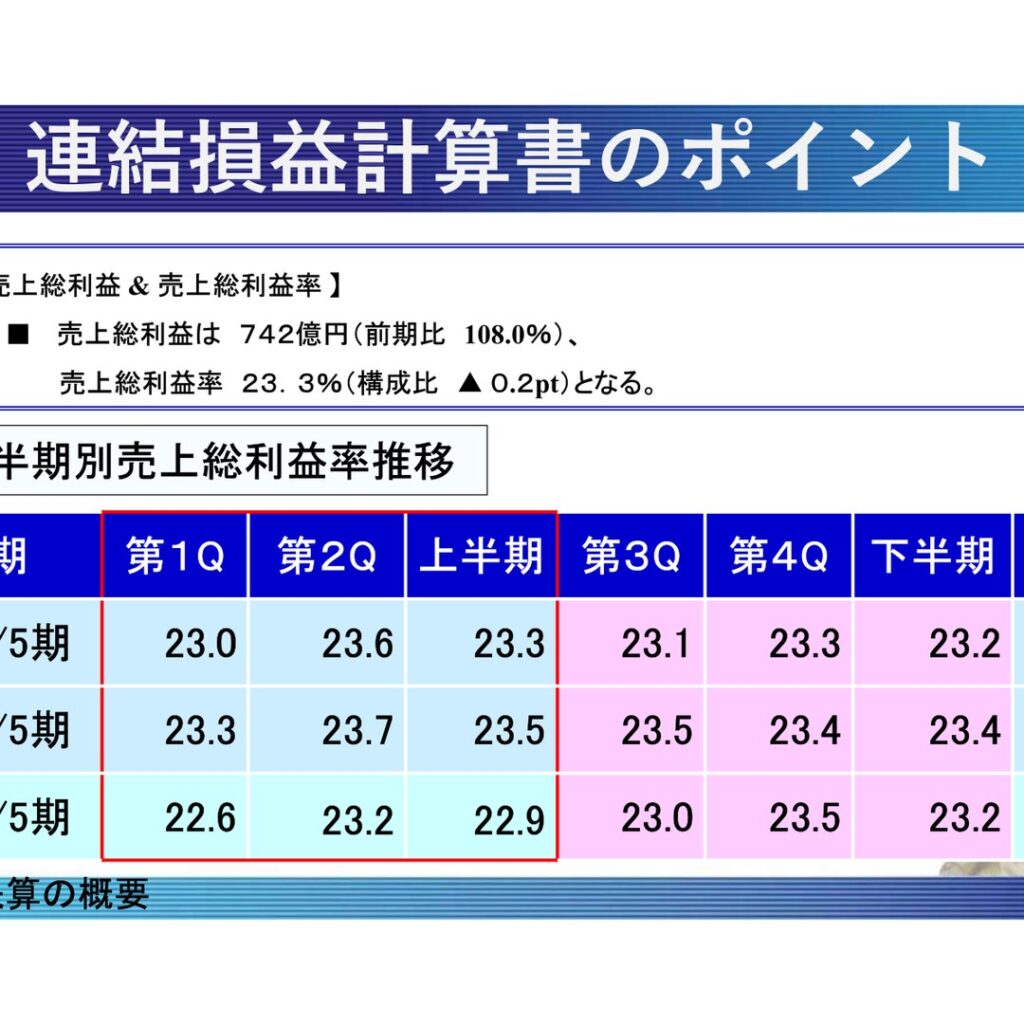
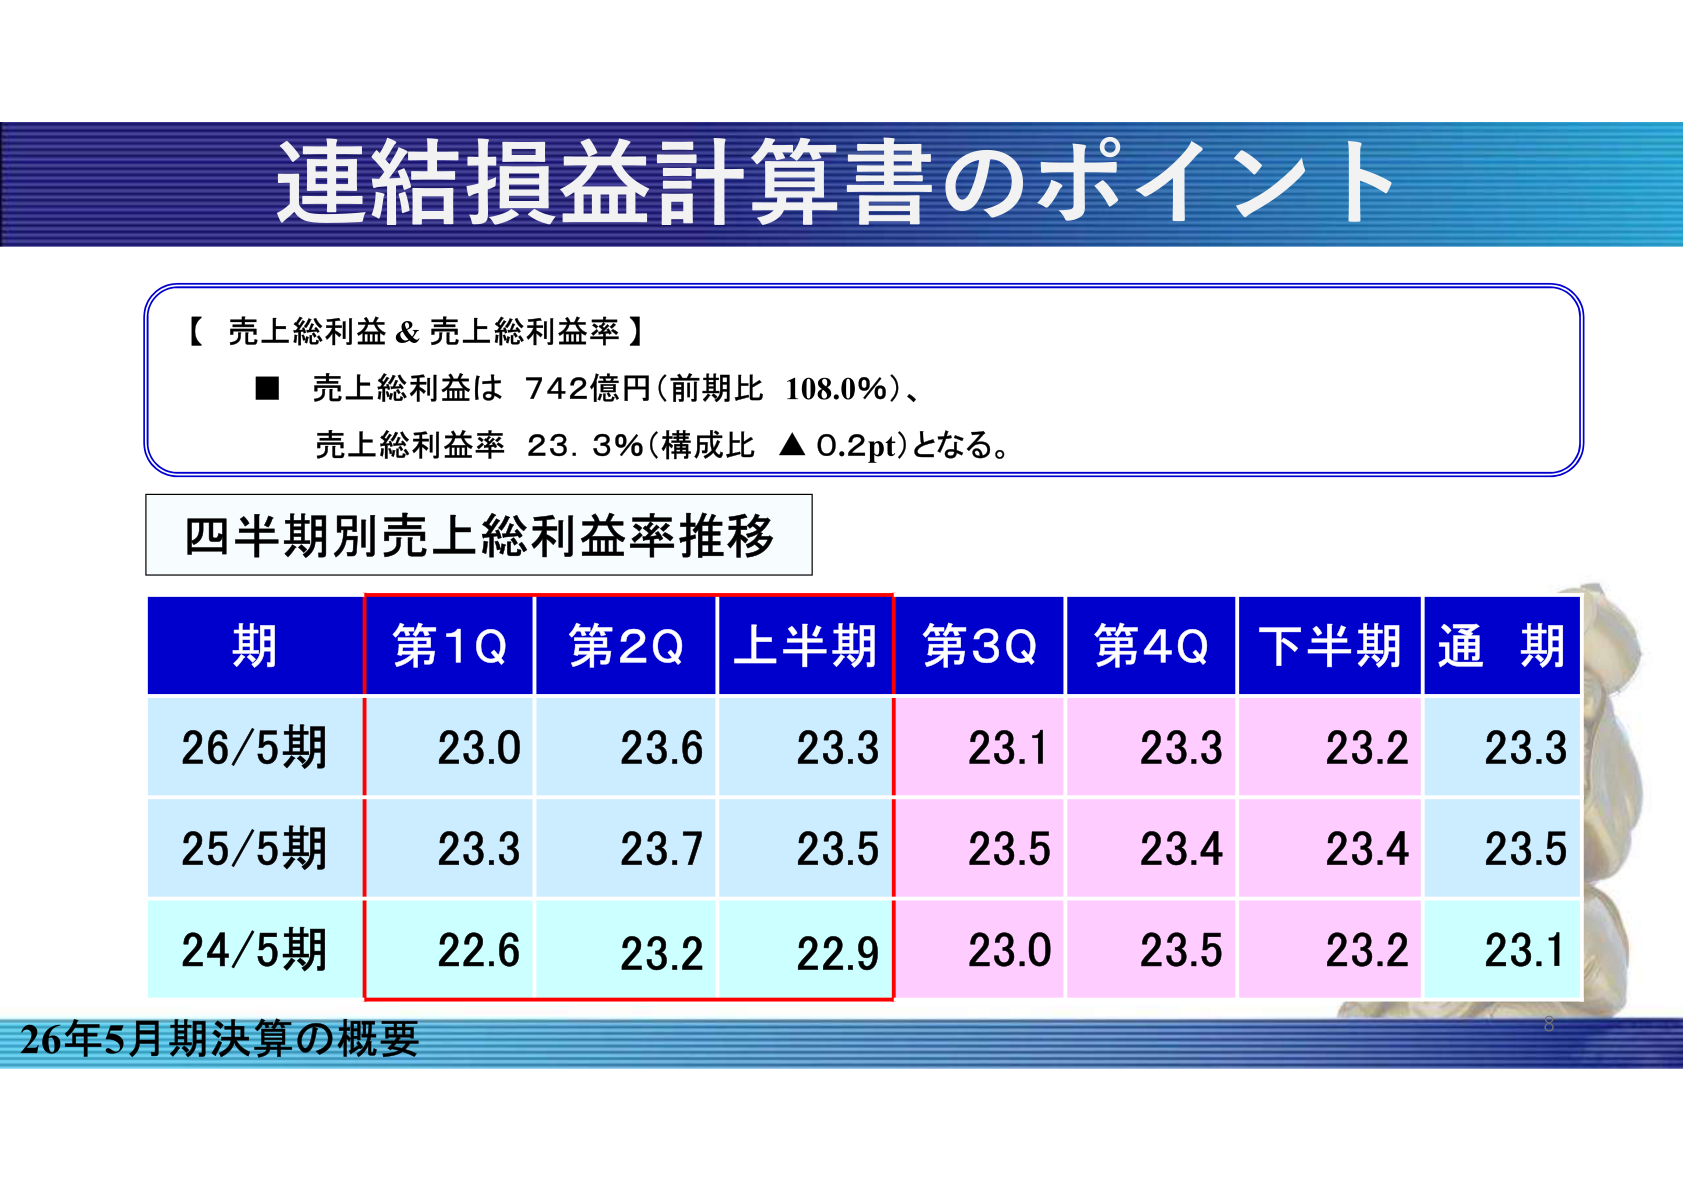
Net sales were 319,208 million yen, 109.0% of the previous year, while gross profit came to 74,222 million yen, 108.0% of the previous year, and the gross profit margin declined to 23.3% (change in ratio: ▲0.2pt). Selling, general and administrative expenses increased to 68,925 million yen, 117.0% of the previous year, and the ratio to net sales was 21.59% (change in ratio: +1.48pt). As a result, operating profit was 5,297 million yen (54.0% of the previous year), ordinary profit was 5,450 million yen (54.0% of the previous year) and net income was 3,606 million yen (53.2% of the previous year), all falling below the previous year (unit: millions of yen).
| Item | FY ended May 2026 | FY ended May 2025 | % of previous year |
|---|---|---|---|
| Net sales | 319,208 | 292,940 | 109.0% |
| Gross profit | 74,222 | 68,723 | 108.0% |
| Selling, general and administrative expenses | 68,925 | 58,911 | 117.0% |
| Operating profit | 5,297 | 9,812 | 54.0% |
| Ordinary profit | 5,450 | 10,088 | 54.0% |
| Net income | 3,606 | 6,778 | 53.2% |
Breakdown of Selling, General and Administrative Expenses
In the breakdown of selling, general and administrative expenses, total personnel expenses of 32,794 million yen (composition ratio of 10.27%, change in ratio: +0.59pt) were the largest factor behind the increase. Wage increases for employees (+0.39pt), 43 new stores (25 stores opened in the current fiscal year and 18 stores opened in the second half of the previous fiscal year, +0.15pt) and hiring for multi-store expansion (+0.02pt) had an impact. Depreciation was 8,473 million yen (composition ratio of 2.65%, change in ratio: +0.49pt), as the impact of the 43 new stores (+0.72pt) exceeded the impact of existing facilities (▲0.37pt). Rent was 8,923 million yen (composition ratio of 2.80%, change in ratio: +0.04pt), freight was 4,331 million yen (composition ratio of 1.36%, change in ratio: +0.14pt, including a +0.12pt impact from the start-up of the Kyushu FDC center), and advertising expenses were 812 million yen (composition ratio of 0.25%, change in ratio: +0.10pt, with insert-flyer promotions conducted twice a month from September).
| Account | FY ended May 2026 (millions of yen) | Composition ratio (%) | FY ended May 2025 (millions of yen) | Composition ratio (%) | Change (millions of yen) | Change in ratio (pt) |
|---|---|---|---|---|---|---|
| Total personnel expenses | 32,794 | 10.27 | 28,377 | 9.69 | 4,416 | +0.59 |
| Utilities | 6,128 | 1.92 | 5,744 | 1.96 | 384 | ▲0.04 |
| Supplies | 1,403 | 0.44 | 1,220 | 0.42 | 183 | +0.02 |
| Freight | 4,331 | 1.36 | 3,578 | 1.22 | 753 | +0.14 |
| Advertising expenses | 812 | 0.25 | 449 | 0.15 | 364 | +0.10 |
| Commissions paid | 1,170 | 0.37 | 943 | 0.32 | 226 | +0.04 |
| Rent | 8,923 | 2.80 | 8,077 | 2.76 | 846 | +0.04 |
| Depreciation | 8,473 | 2.65 | 6,349 | 2.17 | 2,124 | +0.49 |
| Taxes and dues | 1,742 | 0.55 | 1,511 | 0.52 | 231 | +0.03 |
| Other | 3,149 | 0.99 | 2,662 | 0.91 | 487 | +0.08 |
Store Network by Area and Format (Business Overview)
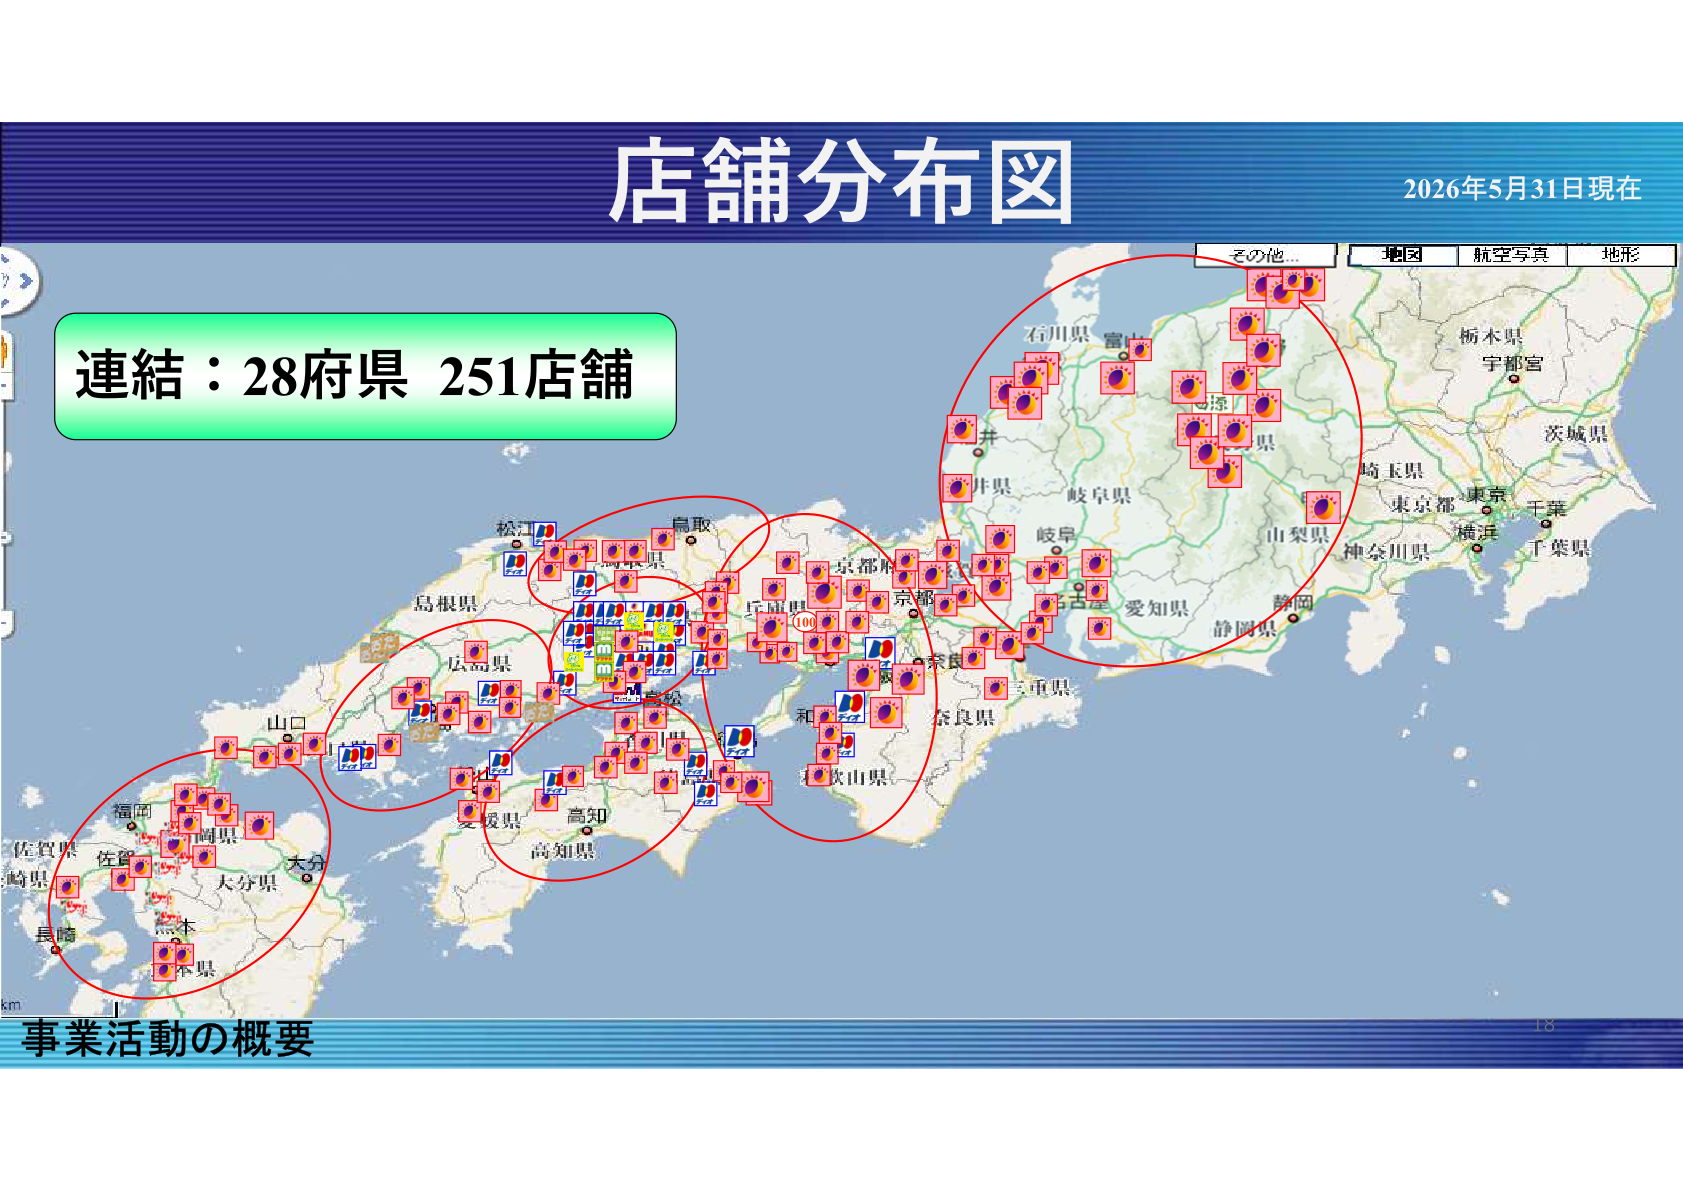
As of May 31, 2026, the group operated 251 stores in 28 prefectures on a consolidated basis. By format, there were 174 LAMU stores, 46 DIO stores, 22 small-format stores, 5 Mammy’s stores and 4 Oda Shoten stores (2 small-format stores and 5 Mammy’s stores were closed). New store openings in the fiscal year ended May 31, 2026 numbered 25 stores (13 in the first half and 12 in the second half), and the company also advanced into new areas with stores such as “LAMU Kofu Tokugyo” in Kofu City, Yamanashi Prefecture (its first store in the Tokyo metropolitan area) and “LAMU Nakatsu” in Nakatsu City, Oita Prefecture (its first store in Oita).
| Area | LAMU | DIO | Small-format stores | Oda Shoten | Mammy’s | Total |
|---|---|---|---|---|---|---|
| Chugoku | 28 stores | 34 stores | 17 stores | 4 stores | – | 83 stores |
| Kinki | 54 stores | 8 stores | 1 store | – | – | 63 stores |
| Shikoku | 23 stores | 4 stores | – | – | – | 27 stores |
| Kyushu | 23 stores | – | 4 stores | – | 5 stores | 32 stores |
| Tokai | 14 stores | – | – | – | – | 14 stores |
| Hokuriku | 16 stores | – | – | – | – | 16 stores |
| Koshinetsu | 16 stores | – | – | – | – | 16 stores |
| Total | 174 stores | 46 stores | 22 stores | 4 stores | 5 stores | 251 stores |
Business Plan for the Fiscal Year Ending May 31, 2027
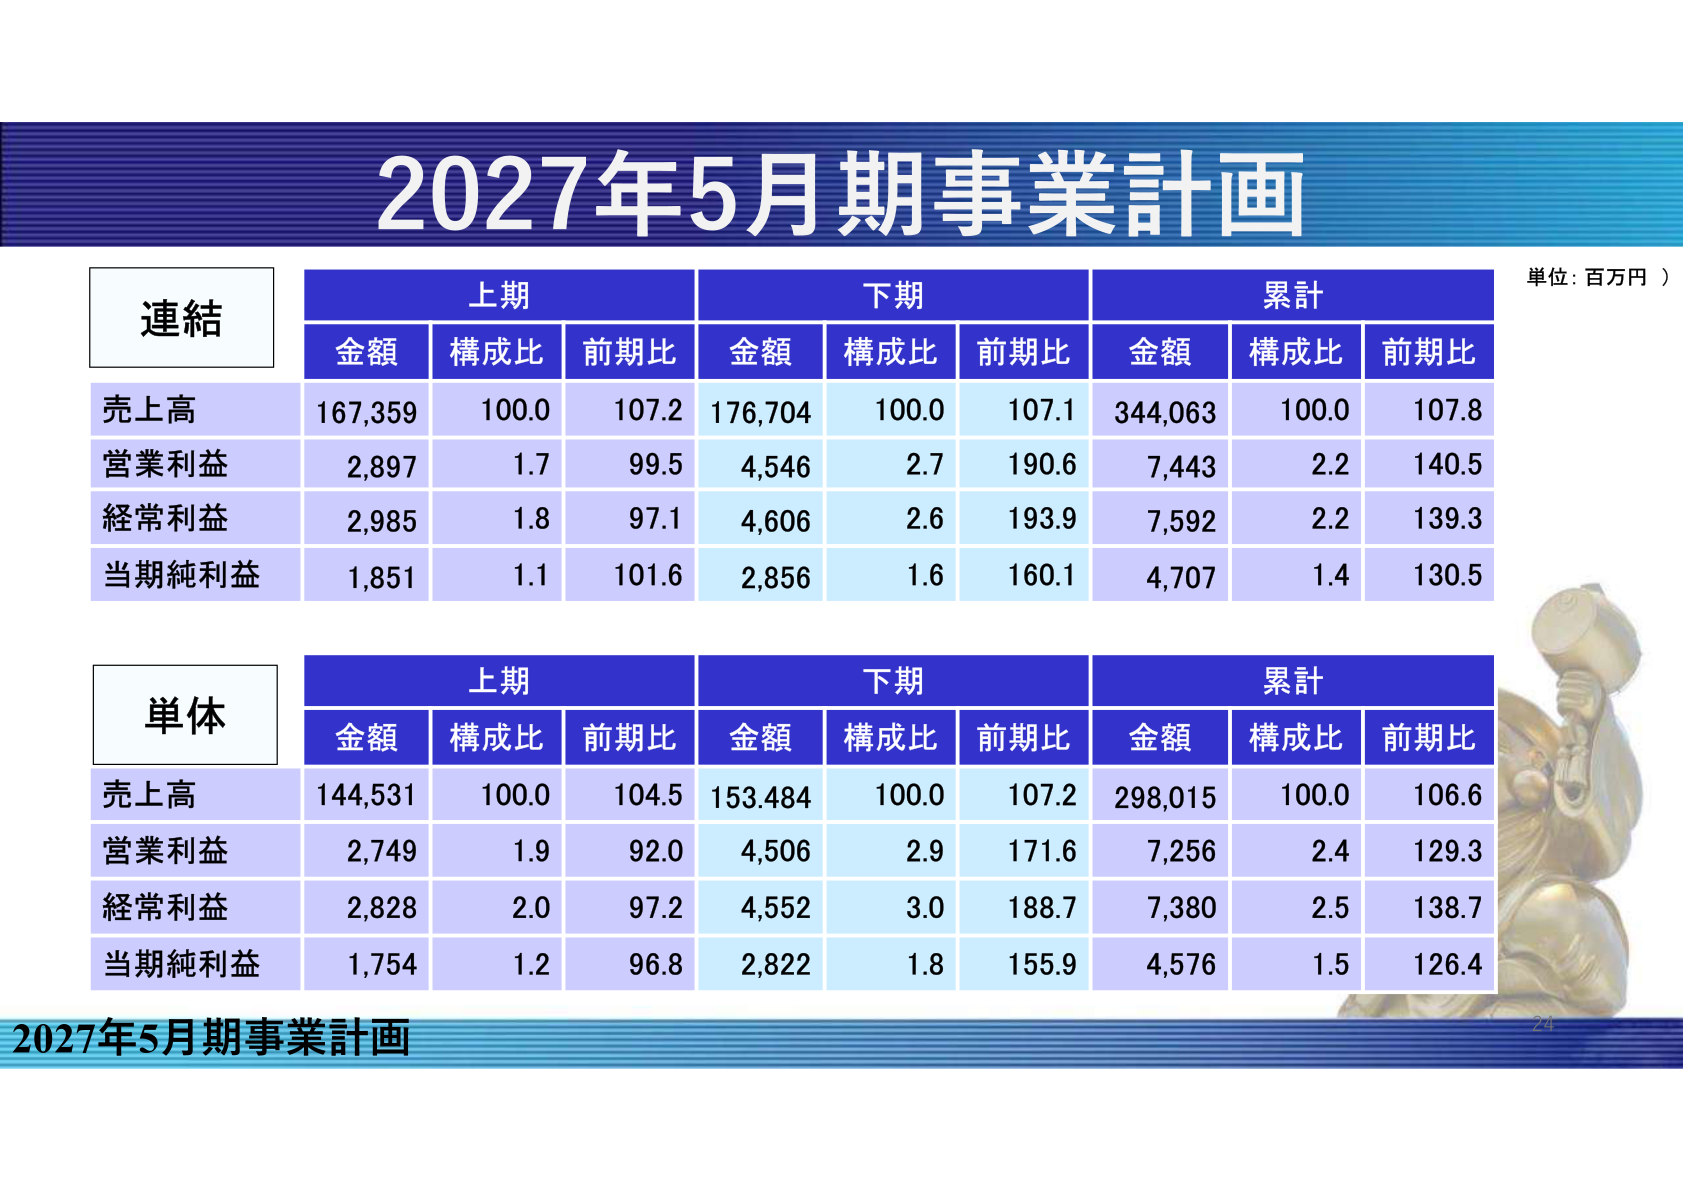
For the fiscal year ending May 31, 2027 (the 41st term), the company plans consolidated net sales of 344,063 million yen (107.8% of the previous year), operating profit of 7,443 million yen (140.5% of the previous year), ordinary profit of 7,592 million yen (139.3% of the previous year) and net income of 4,707 million yen (130.5% of the previous year). For the first half it expects net sales of 167,359 million yen (107.2% of the previous year) and operating profit of 2,897 million yen (99.5% of the previous year), and for the second half it plans net sales of 176,704 million yen (107.1% of the previous year) and operating profit of 4,546 million yen (190.6% of the previous year), planning profit growth in the second half. On a non-consolidated basis, the company plans net sales of 298,015 million yen (106.6% of the previous year), operating profit of 7,256 million yen (129.3% of the previous year), ordinary profit of 7,380 million yen (138.7% of the previous year) and net income of 4,576 million yen (126.4% of the previous year).
| Basis | Item | Full-year plan (millions of yen) | % of previous year | First-half plan (millions of yen) | Second-half plan (millions of yen) |
|---|---|---|---|---|---|
| Consolidated | Net sales | 344,063 | 107.8% | 167,359 | 176,704 |
| Consolidated | Operating profit | 7,443 | 140.5% | 2,897 | 4,546 |
| Consolidated | Ordinary profit | 7,592 | 139.3% | 2,985 | 4,606 |
| Consolidated | Net income | 4,707 | 130.5% | 1,851 | 2,856 |
| Non-consolidated | Net sales | 298,015 | 106.6% | 144,531 | 153,484 |
| Non-consolidated | Operating profit | 7,256 | 129.3% | 2,749 | 4,506 |
| Non-consolidated | Ordinary profit | 7,380 | 138.7% | 2,828 | 4,552 |
| Non-consolidated | Net income | 4,576 | 126.4% | 1,754 | 2,822 |
Shareholder Returns
These materials contain no description of shareholder returns such as dividend amounts or share buybacks.
Medium-Term Management Plan / Topics
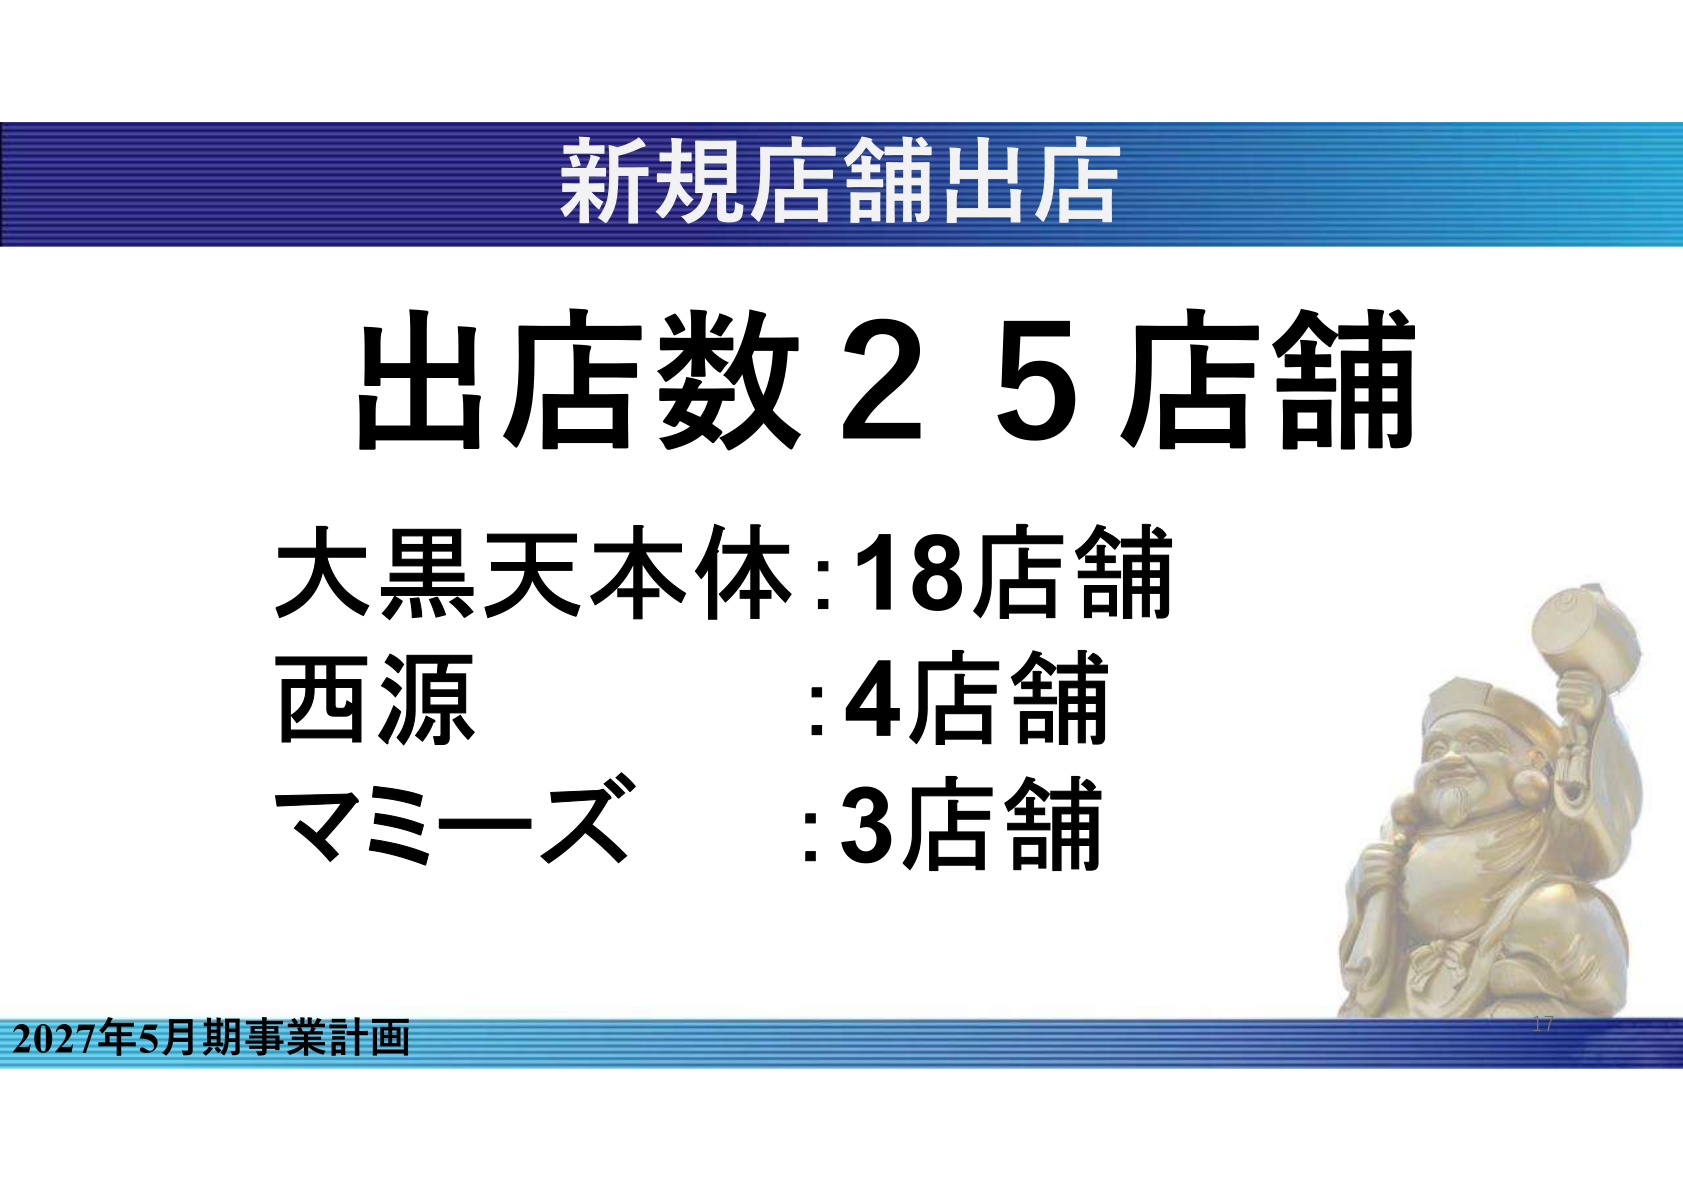
For the fiscal year ending May 31, 2027, the company plans 25 new store openings, comprising 18 stores for Daikokuten Bussan itself, 4 stores for Nishigen and 3 stores for Mammy’s. Of these, 15 “LAMU” stores are planned (including 2 “SFO” stores), which by operating company comprise 11 stores for Daikokuten Bussan itself, 2 for Nishigen and 2 for Mammy’s. Renovations are planned for 5 “LAMU” stores, 8 “DIO” stores and 2 “Mammy’s” stores. Three factors were cited for same-store sales in the fiscal year ended May 31, 2026 falling below 100% at 99.8% of the previous year: the impact of price revisions, the “Reiwa rice turmoil” and cannibalization from new store openings.
This article is an analysis based on publicly available information and is not a recommendation to buy or sell any specific securities. Investment decisions are your own responsibility.
















