
This article is based on publicly available IR materials and is not a recommendation to buy or sell any specific securities.
Note: Tokyo Electron Device LTD. labels the fiscal year ended March 31, 2026 as “FY2026”; this site classifies each company’s most recent completed fiscal year as FY2025. All figures, tables and segment labels below follow the company’s own fiscal-year labels exactly as they appear in its materials.
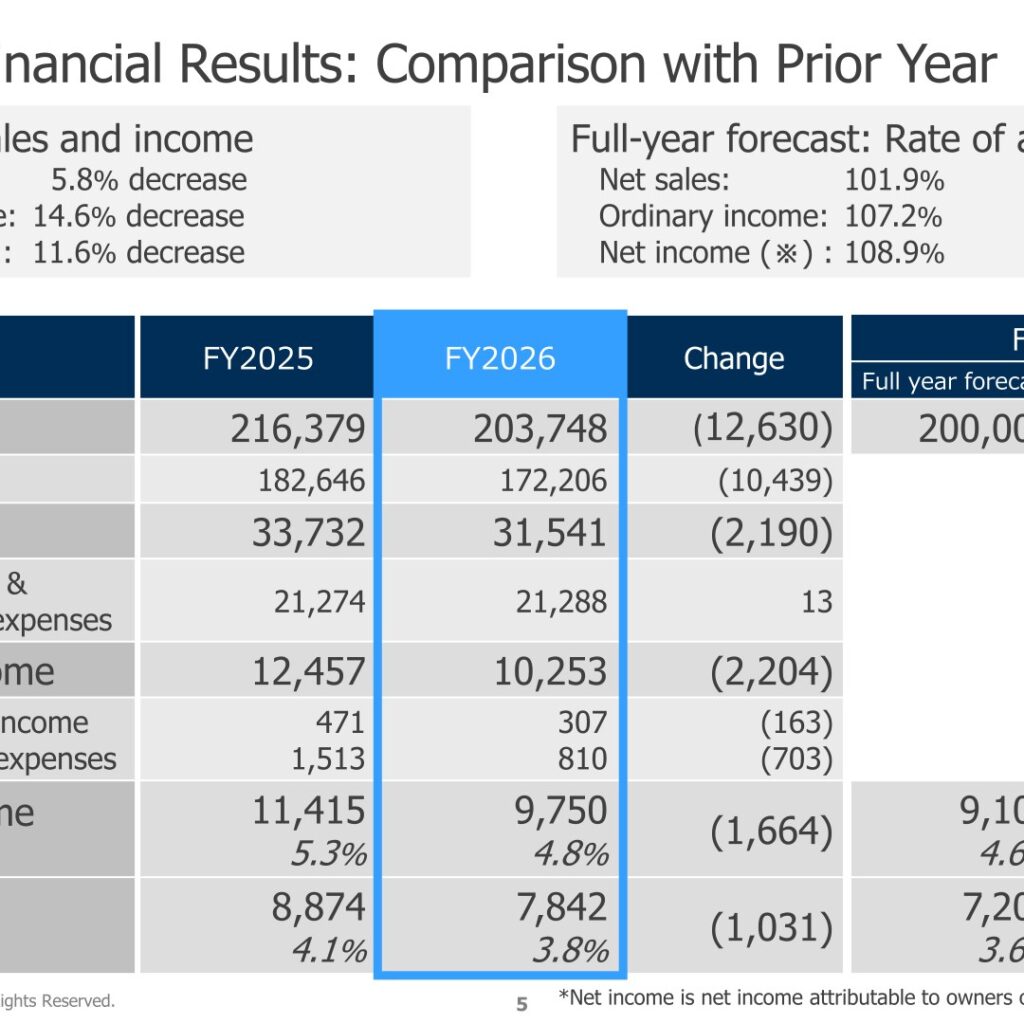
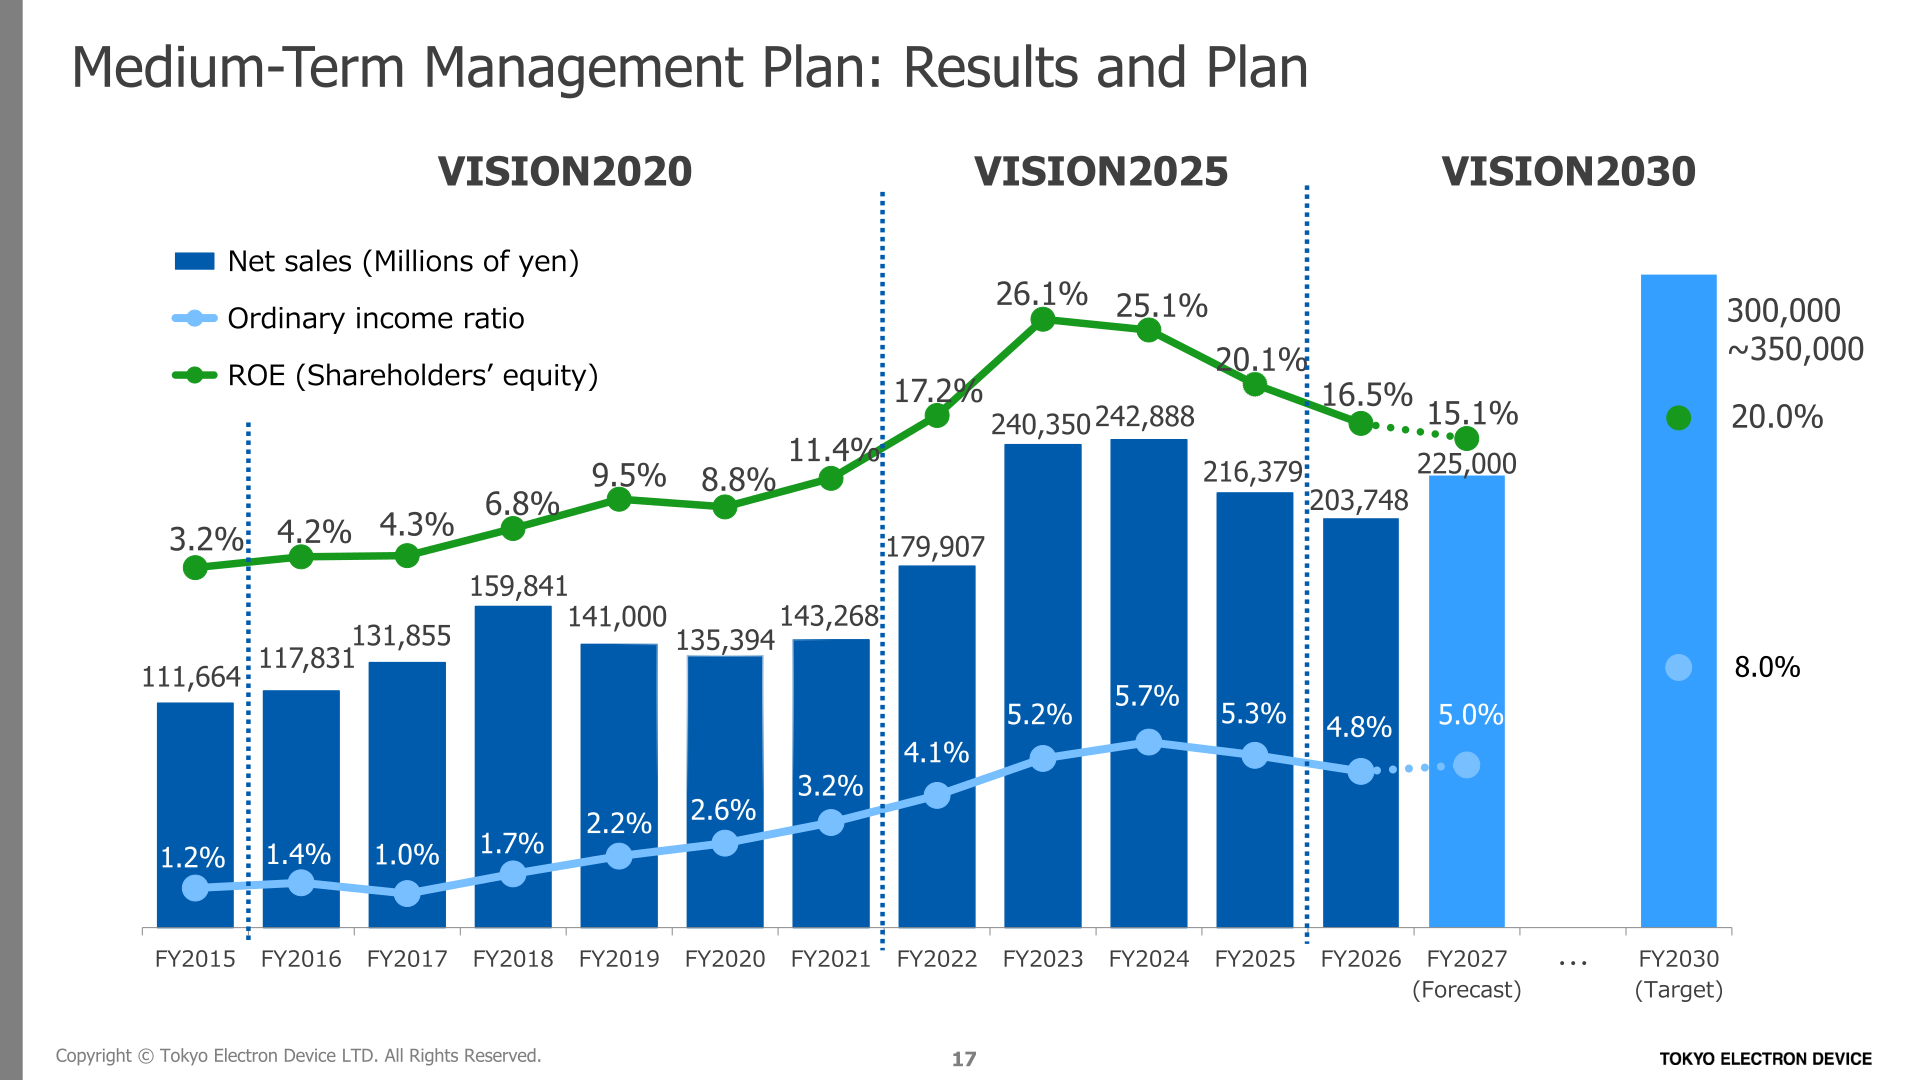
Tokyo Electron Device LTD. reported lower sales and lower income for the fiscal year ended March 2026 (the company’s FY2026). Net sales fell 5.8% to 203,748 million yen, ordinary income fell 14.6% to 9,750 million yen, and net income attributable to owners of the parent fell 11.6% to 7,842 million yen. Results nonetheless came in above the company’s full-year forecast, with achievement rates of 101.9% for net sales, 107.2% for ordinary income and 108.9% for net income. The Computer Networks (CN) Business grew sales and income on steady customer IT investment, while the Electronic Components (EC) Business declined on prolonged inventory adjustments within the supply chain.
Consolidated Results (Full-Year Actual)
Gross profit declined to 31,541 million yen while selling, general and administrative expenses were essentially flat at 21,288 million yen, leaving operating income at 10,253 million yen. Against the full-year forecast of 200,000 million yen in net sales, 9,100 million yen in ordinary income and 7,200 million yen in net income, the company exceeded all three lines.
| Item (Millions of yen) | FY2025 | FY2026 | Change |
|---|---|---|---|
| Net sales | 216,379 | 203,748 | (12,630) |
| Cost of sales | 182,646 | 172,206 | (10,439) |
| Gross profit | 33,732 | 31,541 | (2,190) |
| Selling, general & administrative expenses | 21,274 | 21,288 | 13 |
| Operating income | 12,457 | 10,253 | (2,204) |
| Non-operating income | 471 | 307 | (163) |
| Non-operating expenses | 1,513 | 810 | (703) |
| Ordinary income | 11,415 | 9,750 | (1,664) |
| Ordinary income ratio | 5.3% | 4.8% | — |
| Net income (attributable to owners of the parent) | 8,874 | 7,842 | (1,031) |
| Net income ratio | 4.1% | 3.8% | — |
Cash and deposits ended the year at 7,622 million yen versus 8,384 million yen a year earlier, with operating cash flow of +15,684 million yen, investment cash flow of +1,200 million yen, financial cash flow of (17,848) million yen and exchange differences of +202 million yen. Total assets stood at 162,211 million yen as of March 31, 2026 against 156,841 million yen a year earlier; the company attributes the increase in notes and accounts receivable to higher sales at the end of the fiscal year, and the decrease in interest-bearing debt to a reduction in working capital.
Segment Results
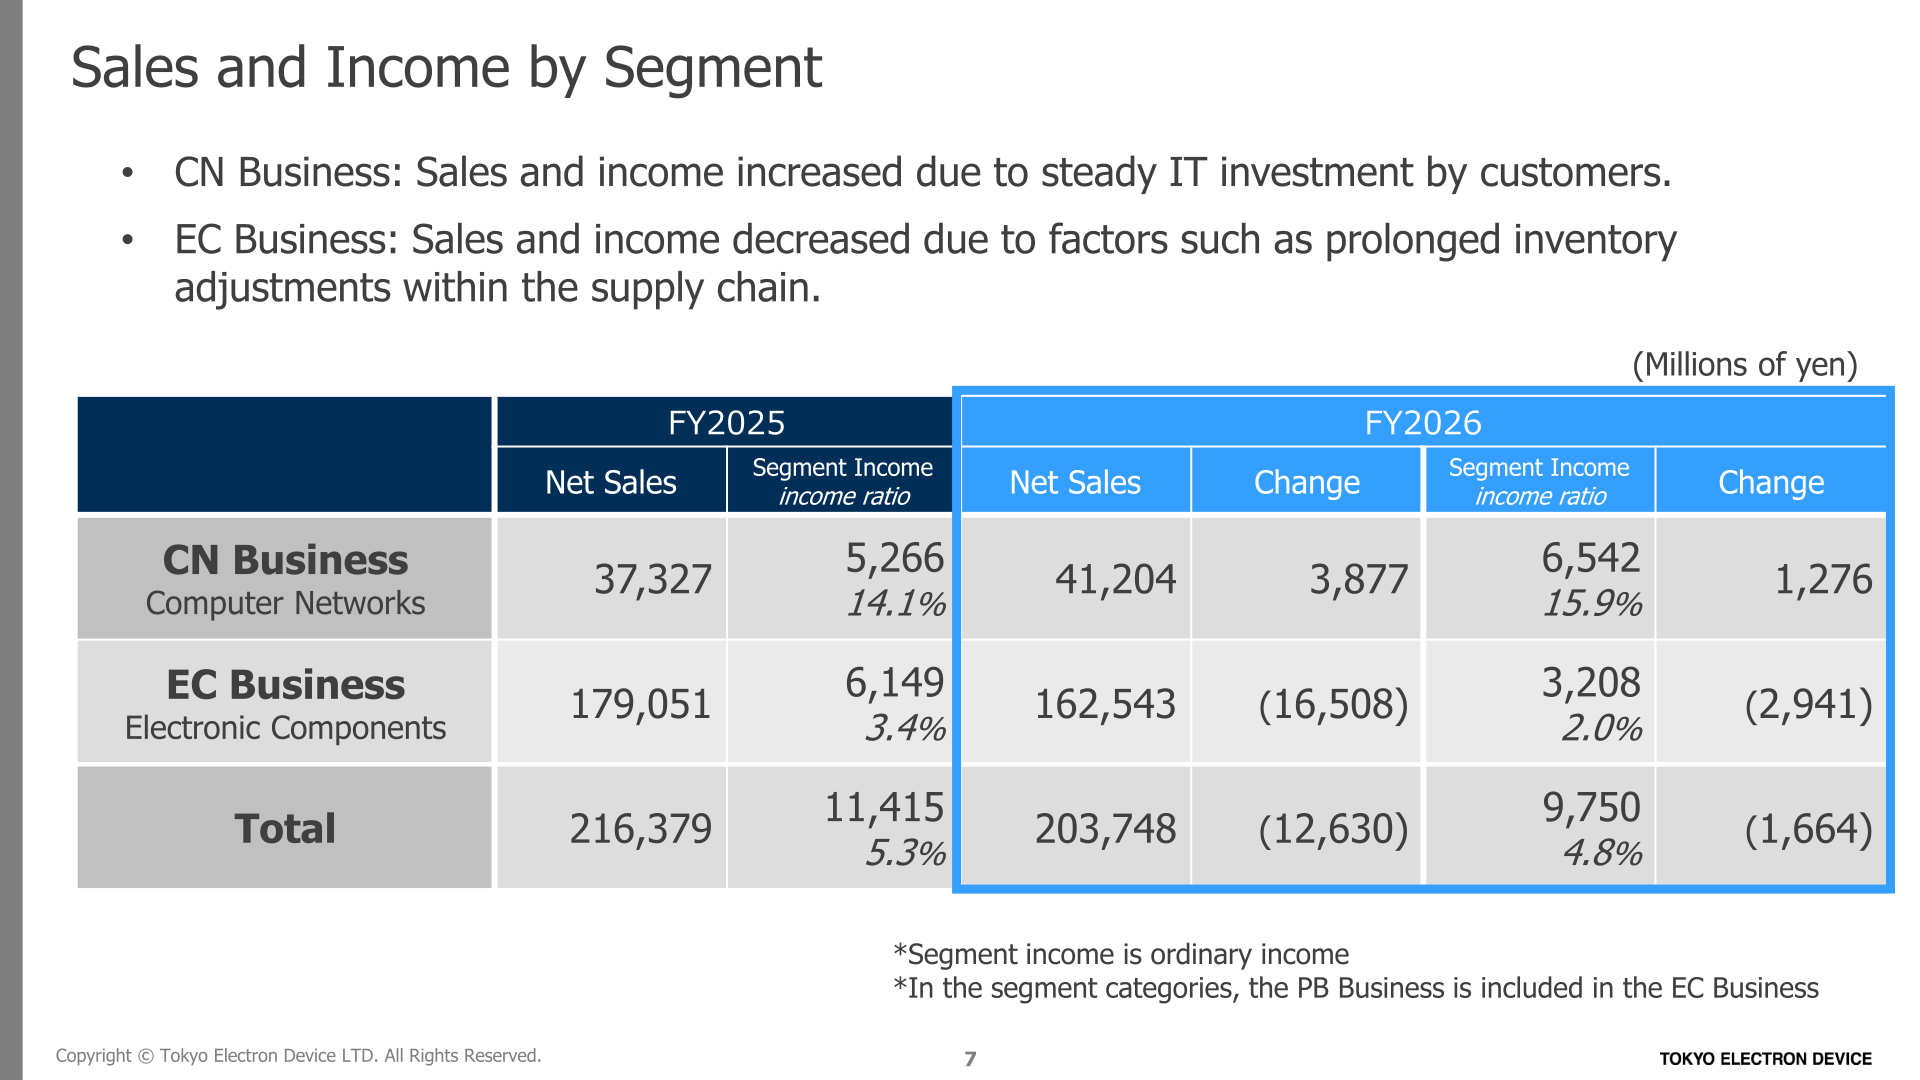
Segment income is stated as ordinary income, and the Private Brand (PB) Business is included within the EC Business in the segment categories. CN Business sales and income increased on steady IT investment by customers, while EC Business sales and income decreased on factors such as prolonged inventory adjustments within the supply chain.
| Segment | Metric (Millions of yen) | FY2025 | FY2026 | Change |
|---|---|---|---|---|
| CN Business (Computer Networks) | Net sales | 37,327 | 41,204 | 3,877 |
| CN Business (Computer Networks) | Segment income | 5,266 | 6,542 | 1,276 |
| CN Business (Computer Networks) | Income ratio | 14.1% | 15.9% | — |
| EC Business (Electronic Components) | Net sales | 179,051 | 162,543 | (16,508) |
| EC Business (Electronic Components) | Segment income | 6,149 | 3,208 | (2,941) |
| EC Business (Electronic Components) | Income ratio | 3.4% | 2.0% | — |
| Total | Net sales | 216,379 | 203,748 | (12,630) |
| Total | Segment income | 11,415 | 9,750 | (1,664) |
| Total | Income ratio | 5.3% | 4.8% | — |
Within the CN Business, sales of network-related products decreased to data center and cloud business operators (a rate of change of (13.0%)), while storage-related products rose 44.4% mainly on large-scale projects for telecommunications carriers, security-related products rose 15.5% and maintenance & monitoring services rose 15.6%. Within the EC Business, analog ICs declined (19.9%) and microprocessors (24.6%) on customers’ inventory adjustments and lower demand, memory ICs declined (15.8%), while logic ICs rose 9.1% on the expansion of commercial rights and software & services rose 14.0%. By application, industrial equipment declined (20.5%) while automotive equipment rose 6.7%.
PB Business net sales were 11,783 million yen, down 2,852 million yen or (19.5%) from 14,636 million yen, equivalent to 7.2% of EC Business net sales versus 8.2% a year earlier. The company cites weak sales for industrial equipment at TED, which reduced sales of design and manufacturing services and wafer inspection systems, while TED Nagasaki was broadly level with the prior year despite higher sales to major customers. Consolidated overseas subsidiaries’ net sales were 42,246 million yen, down 9,587 million yen or (18.5%) from 51,834 million yen, representing 26.0% of EC Business net sales versus 28.9%.
FY2027 Forecast (Fiscal Year Ending March 31, 2027)
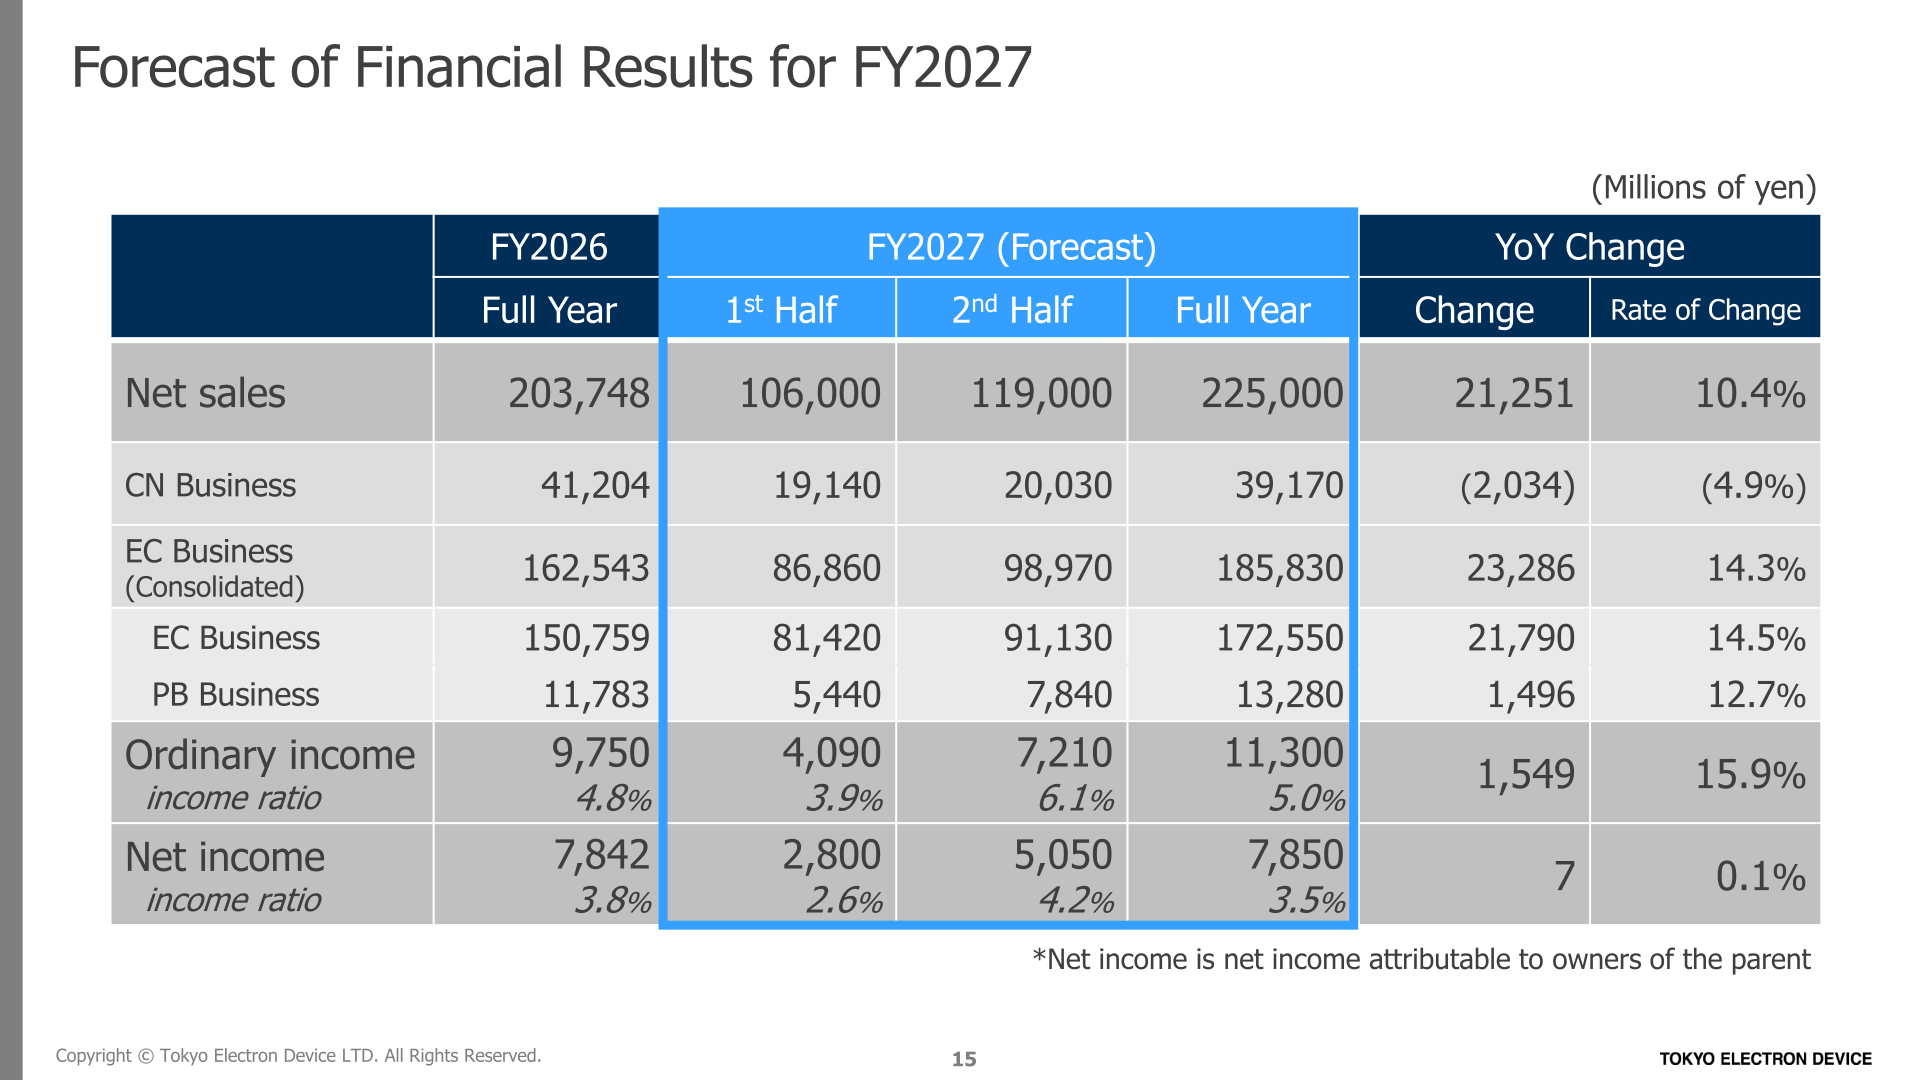
For FY2027 the company forecasts net sales of 225,000 million yen (up 10.4%), ordinary income of 11,300 million yen (up 15.9%) and net income of 7,850 million yen (up 0.1%). Growth is expected to come from the EC Business, forecast at 185,830 million yen on a consolidated basis (up 14.3%), while the CN Business is forecast to decline to 39,170 million yen ((4.9%)). The plan assumes an exchange rate of 156 yen, supply-chain inventory levels moving toward optimal levels, longer lead times, a recovery phase in the industrial and automotive equipment markets, a steady IT market, and signs of slowing IT spending by major customers.
| Item (Millions of yen) | FY2026 Full Year | FY2027 1st Half | FY2027 2nd Half | FY2027 Full Year | Change | Rate of Change |
|---|---|---|---|---|---|---|
| Net sales | 203,748 | 106,000 | 119,000 | 225,000 | 21,251 | 10.4% |
| CN Business | 41,204 | 19,140 | 20,030 | 39,170 | (2,034) | (4.9%) |
| EC Business (Consolidated) | 162,543 | 86,860 | 98,970 | 185,830 | 23,286 | 14.3% |
| EC Business | 150,759 | 81,420 | 91,130 | 172,550 | 21,790 | 14.5% |
| PB Business | 11,783 | 5,440 | 7,840 | 13,280 | 1,496 | 12.7% |
| Ordinary income | 9,750 | 4,090 | 7,210 | 11,300 | 1,549 | 15.9% |
| Ordinary income ratio | 4.8% | 3.9% | 6.1% | 5.0% | — | — |
| Net income | 7,842 | 2,800 | 5,050 | 7,850 | 7 | 0.1% |
| Net income ratio | 3.8% | 2.6% | 4.2% | 3.5% | — | — |
Shareholder Returns
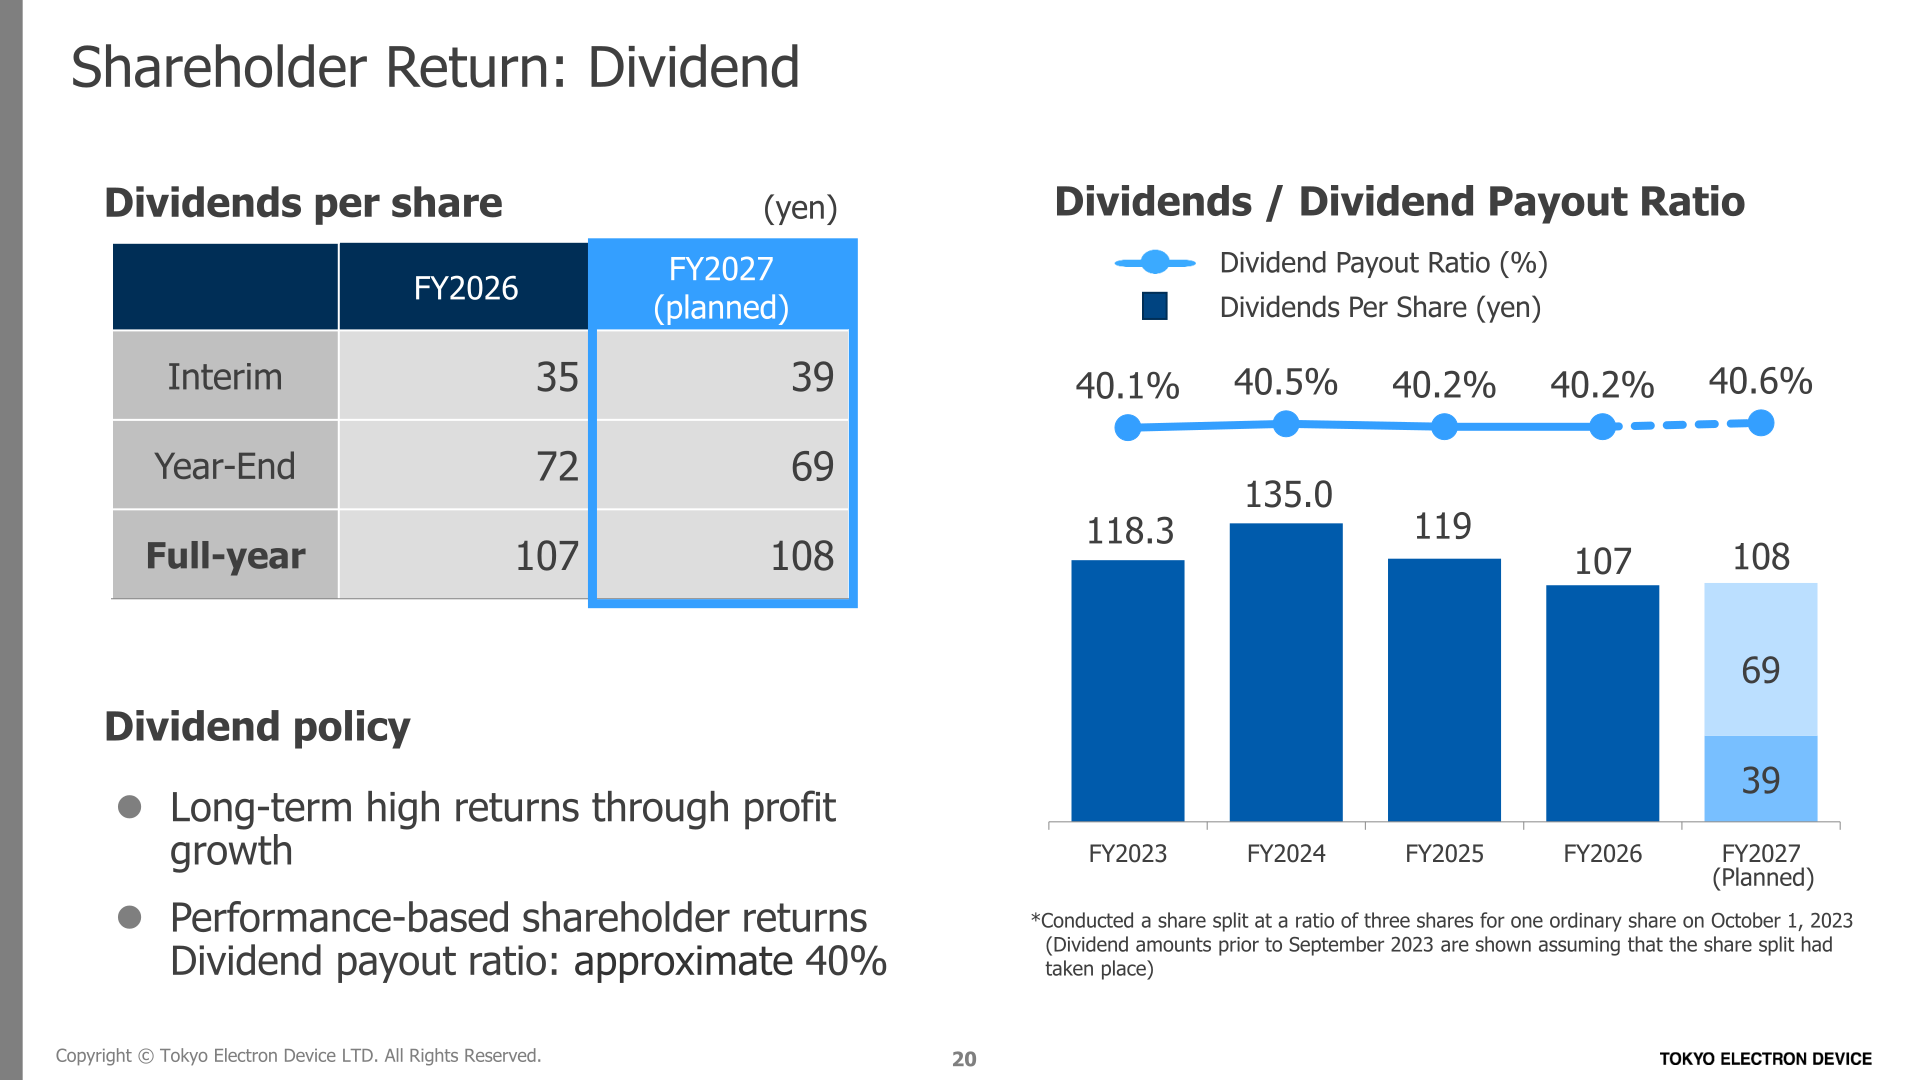
The dividend policy targets long-term high returns through profit growth and performance-based shareholder returns with a dividend payout ratio of approximately 40%. FY2026 dividends per share totalled 107 yen (interim 35 yen, year-end 72 yen), and the company plans 108 yen for FY2027 (interim 39 yen, year-end 69 yen). The dividend payout ratio was 40.2% in FY2026 and is shown at 40.6% for FY2027. A share split at a ratio of three shares for one ordinary share was conducted on October 1, 2023, and dividend amounts prior to September 2023 are shown assuming the share split had taken place.
| Dividends per share (yen) | FY2026 | FY2027 (planned) |
|---|---|---|
| Interim | 35 | 39 |
| Year-End | 72 | 69 |
| Full-year | 107 | 108 |
Medium-Term Management Plan and Topics
Under the VISION2030 medium-term management plan, the company targets net sales of ¥300.0 ~ ¥350.0 billion in fiscal 2030, an ordinary income ratio of 8% or more and ROE of 20% or more. The target business mix is CN Business at 15% of total sales with a 12% ordinary income ratio, EC Business at 75% with 7%, and PB Business at 10% with 10%. Capital policy sets an equity ratio of 40% or more, ROE of 20% or more, a dividend payout ratio target of 40%, and maintenance of appropriate inventory levels. The company positions itself as a “Technology Partner” combining manufacturer functions and technology trading company functions.
Profit-growth initiatives highlighted for FY2026 include, in the CN Business, practical system configurations to safeguard authentication infrastructure — covering PoC support, implementation support, AD recovery training, helpdesk, customer success and SOC services — as intrusive cyberattacks exploiting legitimate accounts increase. In the PB Business, the company jointly developed an FPGA-based data processing board for the next-generation X-ray imaging detector “CITIUS” at SPring-8, RIKEN’s large-scale synchrotron radiation facility, together with a real-time compression technology for large-volume data with an average compression ratio of 1/8,600.
New management structure and presenter: President and Representative Director Takayoshi Miyamoto. The materials were published on April 27, 2026 and the briefing was held on April 28, 2026.
This article is an analysis based on publicly available information and is not a recommendation to buy or sell any specific securities. Investment decisions are your own responsibility.
















