
This article is based on publicly available IR materials and is not a recommendation to buy or sell any specific securities.
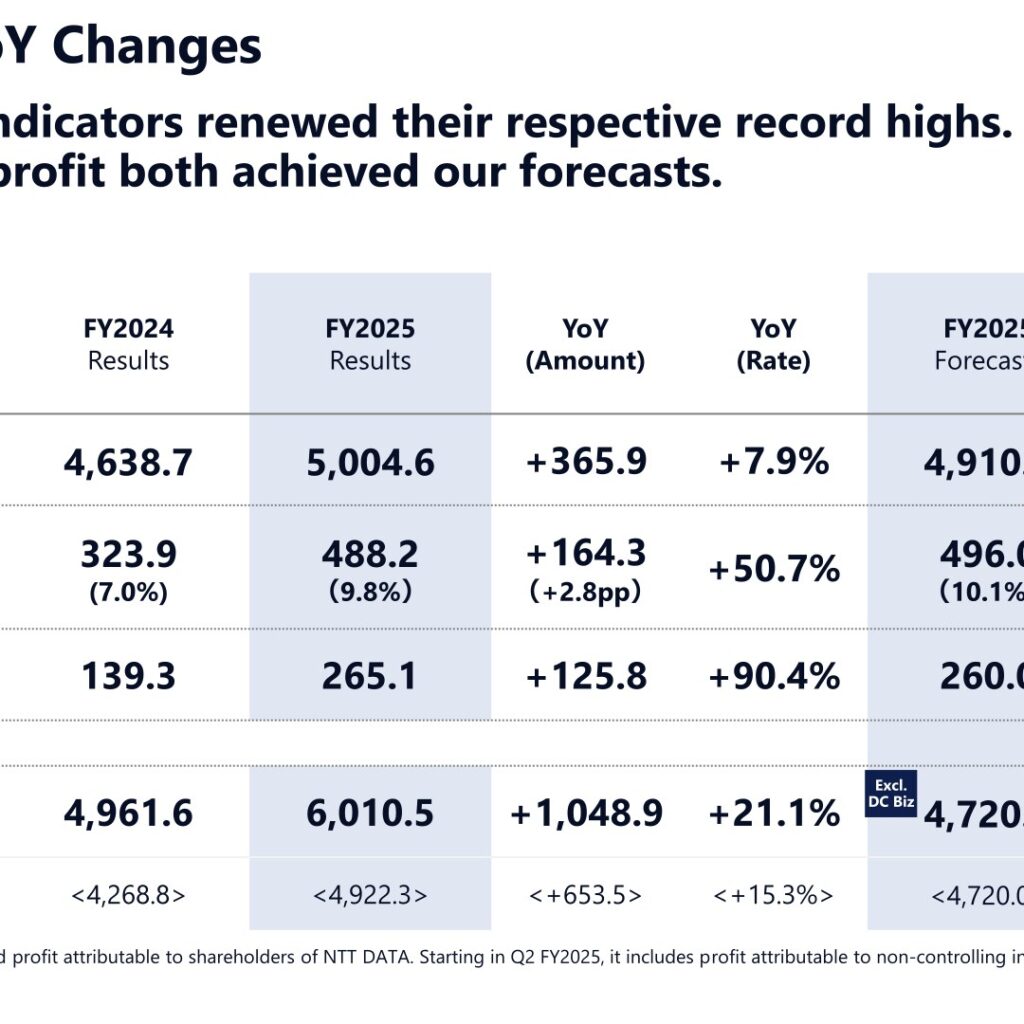
NTT DATA Group Corporation reported record-high consolidated results for FY2025 (the fiscal year ended March 31, 2026), with net sales, operating profit, and profit all renewing their previous highs. Net sales rose 7.9% year on year to ¥5,004.6 billion, operating profit increased 50.7% to ¥488.2 billion (operating profit margin 9.8%), and profit attributable rose 90.4% to ¥265.1 billion, exceeding the company’s full-year forecasts on all three metrics. New orders received surged 21.1% year on year to ¥6,010.5 billion, boosted by the acquisition of large-scale orders in both the Japan and Overseas segments, including ¥1,088.2 billion in new orders for the Data Center Business.
Consolidated Results (Full-Year Actual)
Results came in ahead of the company’s own forecasts: net sales achieved 101.9% of the ¥4,910.7 billion forecast, operating profit achieved 98.4% of the ¥496.0 billion forecast, and profit achieved 102.0% of the ¥260.0 billion forecast. Operating profit growth was driven by expansion in the Japan Segment and by the gain on transfer of data centers (DCs) in the Overseas Segment. Order backlog stood at ¥8,240.3 billion, up ¥1,839.1 billion year on year.
| Item | FY2025 Results | FY2024 Results | YoY (Amount) |
|---|---|---|---|
| New Orders Received | 6,010.5 | 4,961.6 | +1,048.9 |
| Order Backlog | 8,240.3 | 6,401.2 | +1,839.1 |
| Net Sales | 5,004.6 | 4,638.7 | +365.9 |
| Cost of Sales | 3,522.2 | 3,351.3 | +170.8 |
| Gross Profit | 1,482.5 | 1,287.4 | +195.1 |
| SG&A Expenses | 994.2 | 963.5 | +30.7 |
| Operating Profit (Margin) | 488.2 (9.8%) | 323.9 (7.0%) | +164.3 (+2.8pp) |
| Profit Before Tax | 406.5 | 249.0 | +157.5 |
| Income Tax Expense | 141.4 | 109.7 | +31.7 |
| Profit Attributable | 265.1 | 139.3 | +125.8 |
| of which: Shareholders of NTT DATA | 201.4 | 142.5 | +58.9 |
| of which: Non-controlling Interests | 63.7 | -3.2 | +66.9 |
| Capital Investment | 635.8 | 675.7 | -39.9 |
| Depreciation, etc. | 315.5 | 298.7 | +16.9 |
Segment Results
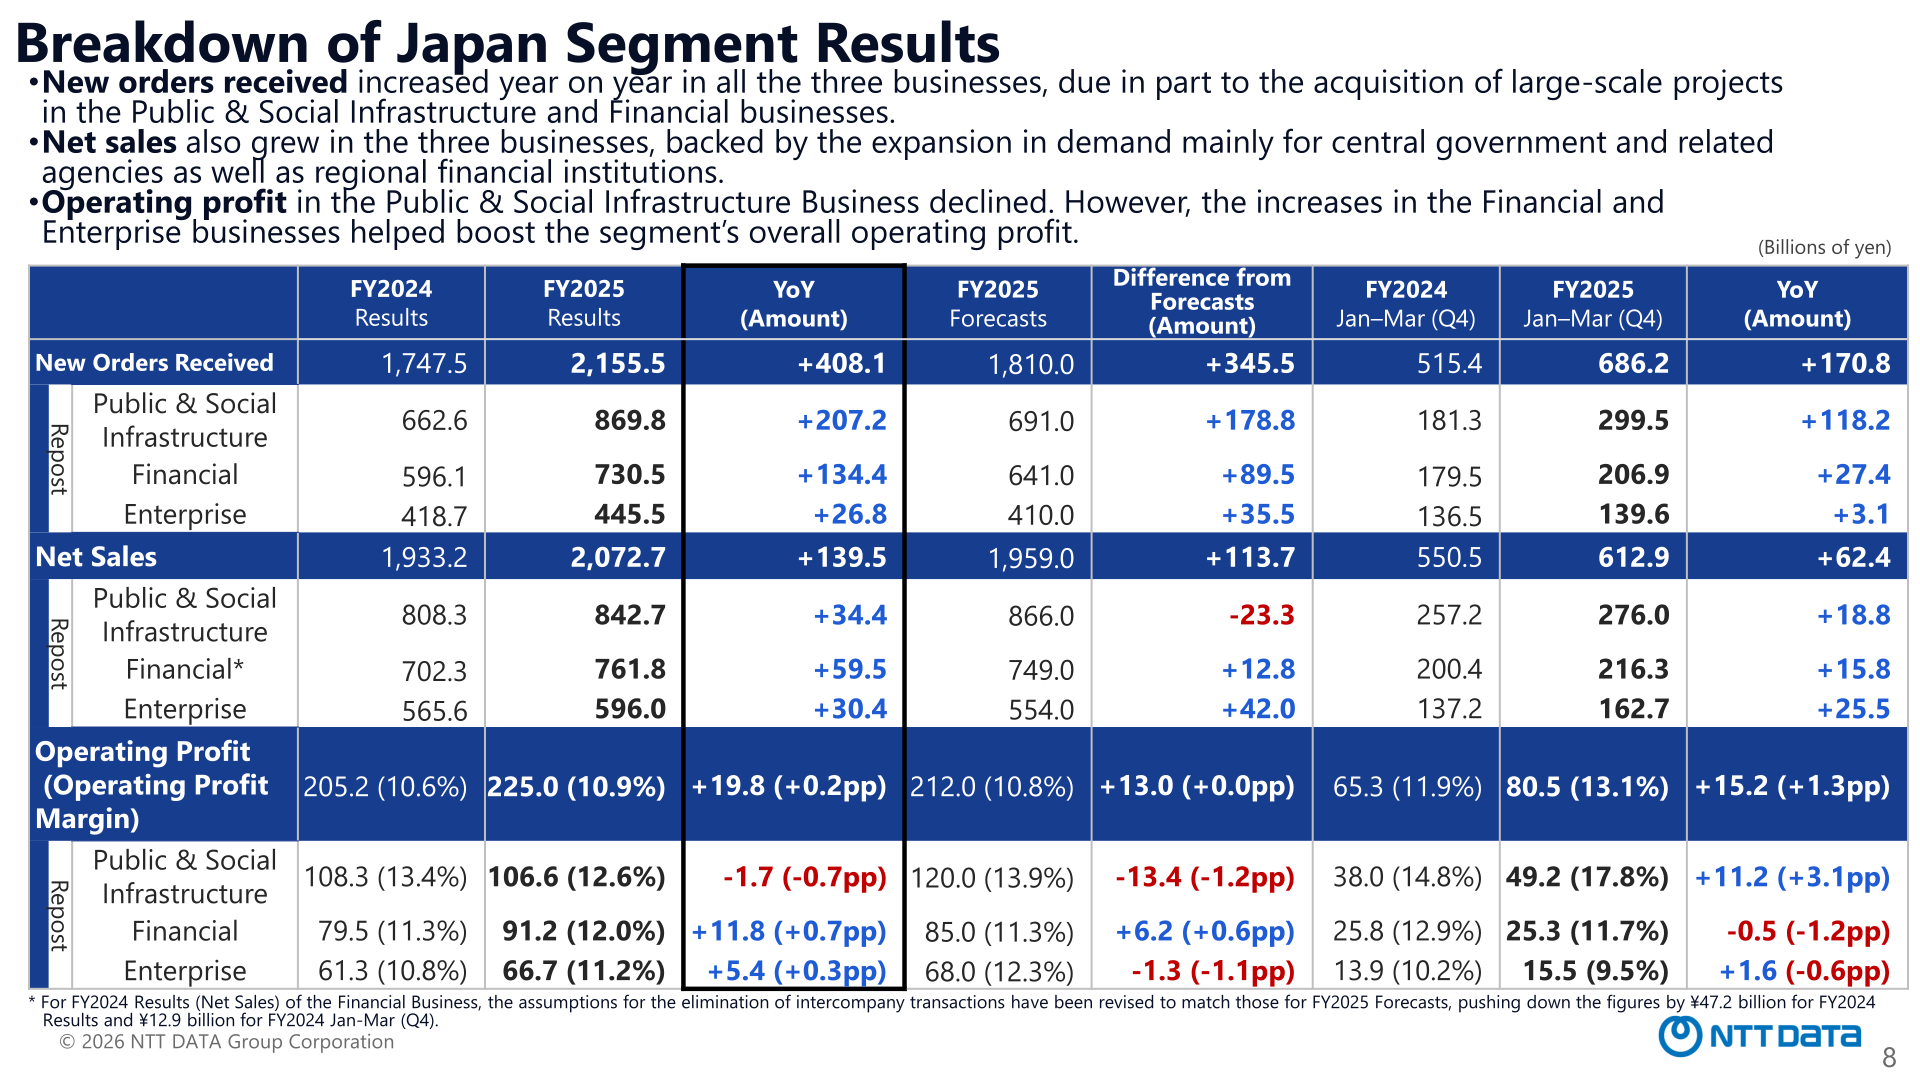
In the Japan Segment, new orders received increased year on year in all three businesses, due in part to the acquisition of large-scale projects in the Public & Social Infrastructure and Financial businesses. Net sales also grew in all three businesses, backed by expanding demand mainly from central government and related agencies as well as regional financial institutions. Operating profit in the Public & Social Infrastructure Business declined, but increases in the Financial and Enterprise businesses helped boost the segment’s overall operating profit to ¥225.0 billion (margin 10.9%).
| Segment | Metric | FY2025 | FY2024 |
|---|---|---|---|
| Public & Social Infrastructure | New Orders Received | 869.8 | 662.6 |
| Public & Social Infrastructure | Net Sales | 842.7 | 808.3 |
| Public & Social Infrastructure | Operating Profit (Margin) | 106.6 (12.6%) | 108.3 (13.4%) |
| Financial | New Orders Received | 730.5 | 596.1 |
| Financial | Net Sales | 761.8 | 702.3 |
| Financial | Operating Profit (Margin) | 91.2 (12.0%) | 79.5 (11.3%) |
| Enterprise | New Orders Received | 445.5 | 418.7 |
| Enterprise | Net Sales | 596.0 | 565.6 |
| Enterprise | Operating Profit (Margin) | 66.7 (11.2%) | 61.3 (10.8%) |
| Japan Total | New Orders Received | 2,155.5 | 1,747.5 |
| Japan Total | Net Sales | 2,072.7 | 1,933.2 |
| Japan Total | Operating Profit (Margin) | 225.0 (10.9%) | 205.2 (10.6%) |
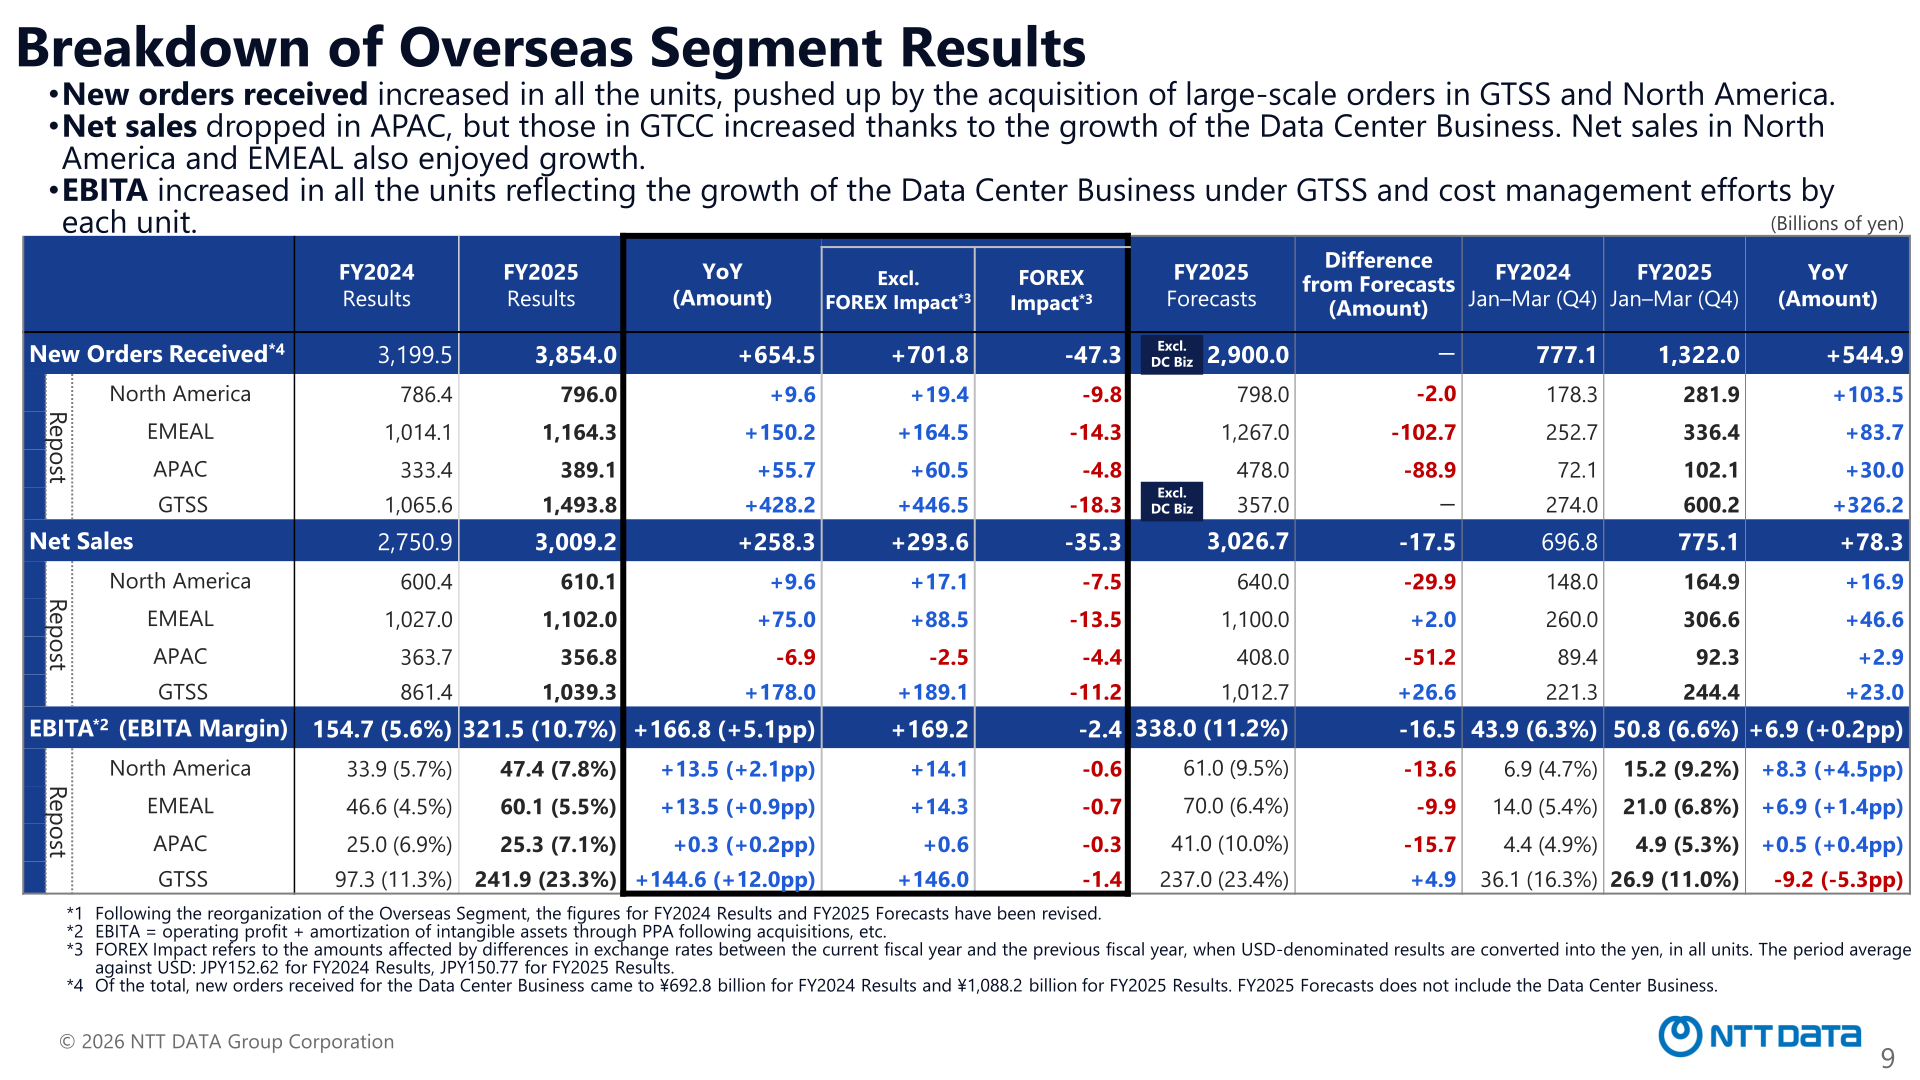
In the Overseas Segment, new orders received increased in all units, pushed up by the acquisition of large-scale orders in GTSS and North America. Net sales dropped in APAC, but grew in GTSS on the back of Data Center Business expansion; net sales in North America and EMEAL also grew. EBITA (operating profit plus amortization of intangible assets through PPA following acquisitions) increased in all units, reflecting the growth of the Data Center Business under GTSS and cost management efforts in each unit, bringing the segment total to ¥321.5 billion (EBITA margin 10.7%).
| Segment | Metric | FY2025 | FY2024 |
|---|---|---|---|
| North America | New Orders Received | 796.0 | 786.4 |
| North America | Net Sales | 610.1 | 600.4 |
| North America | EBITA (Margin) | 47.4 (7.8%) | 33.9 (5.7%) |
| EMEAL | New Orders Received | 1,164.3 | 1,014.1 |
| EMEAL | Net Sales | 1,102.0 | 1,027.0 |
| EMEAL | EBITA (Margin) | 60.1 (5.5%) | 46.6 (4.5%) |
| APAC | New Orders Received | 389.1 | 333.4 |
| APAC | Net Sales | 356.8 | 363.7 |
| APAC | EBITA (Margin) | 25.3 (7.1%) | 25.0 (6.9%) |
| GTSS | New Orders Received | 1,493.8 | 1,065.6 |
| GTSS | Net Sales | 1,039.3 | 861.4 |
| GTSS | EBITA (Margin) | 241.9 (23.3%) | 97.3 (11.3%) |
| Overseas Total | New Orders Received | 3,854.0 | 3,199.5 |
| Overseas Total | Net Sales | 3,009.2 | 2,750.9 |
| Overseas Total | EBITA (Margin) | 321.5 (10.7%) | 154.7 (5.6%) |
FY2026 Forecast
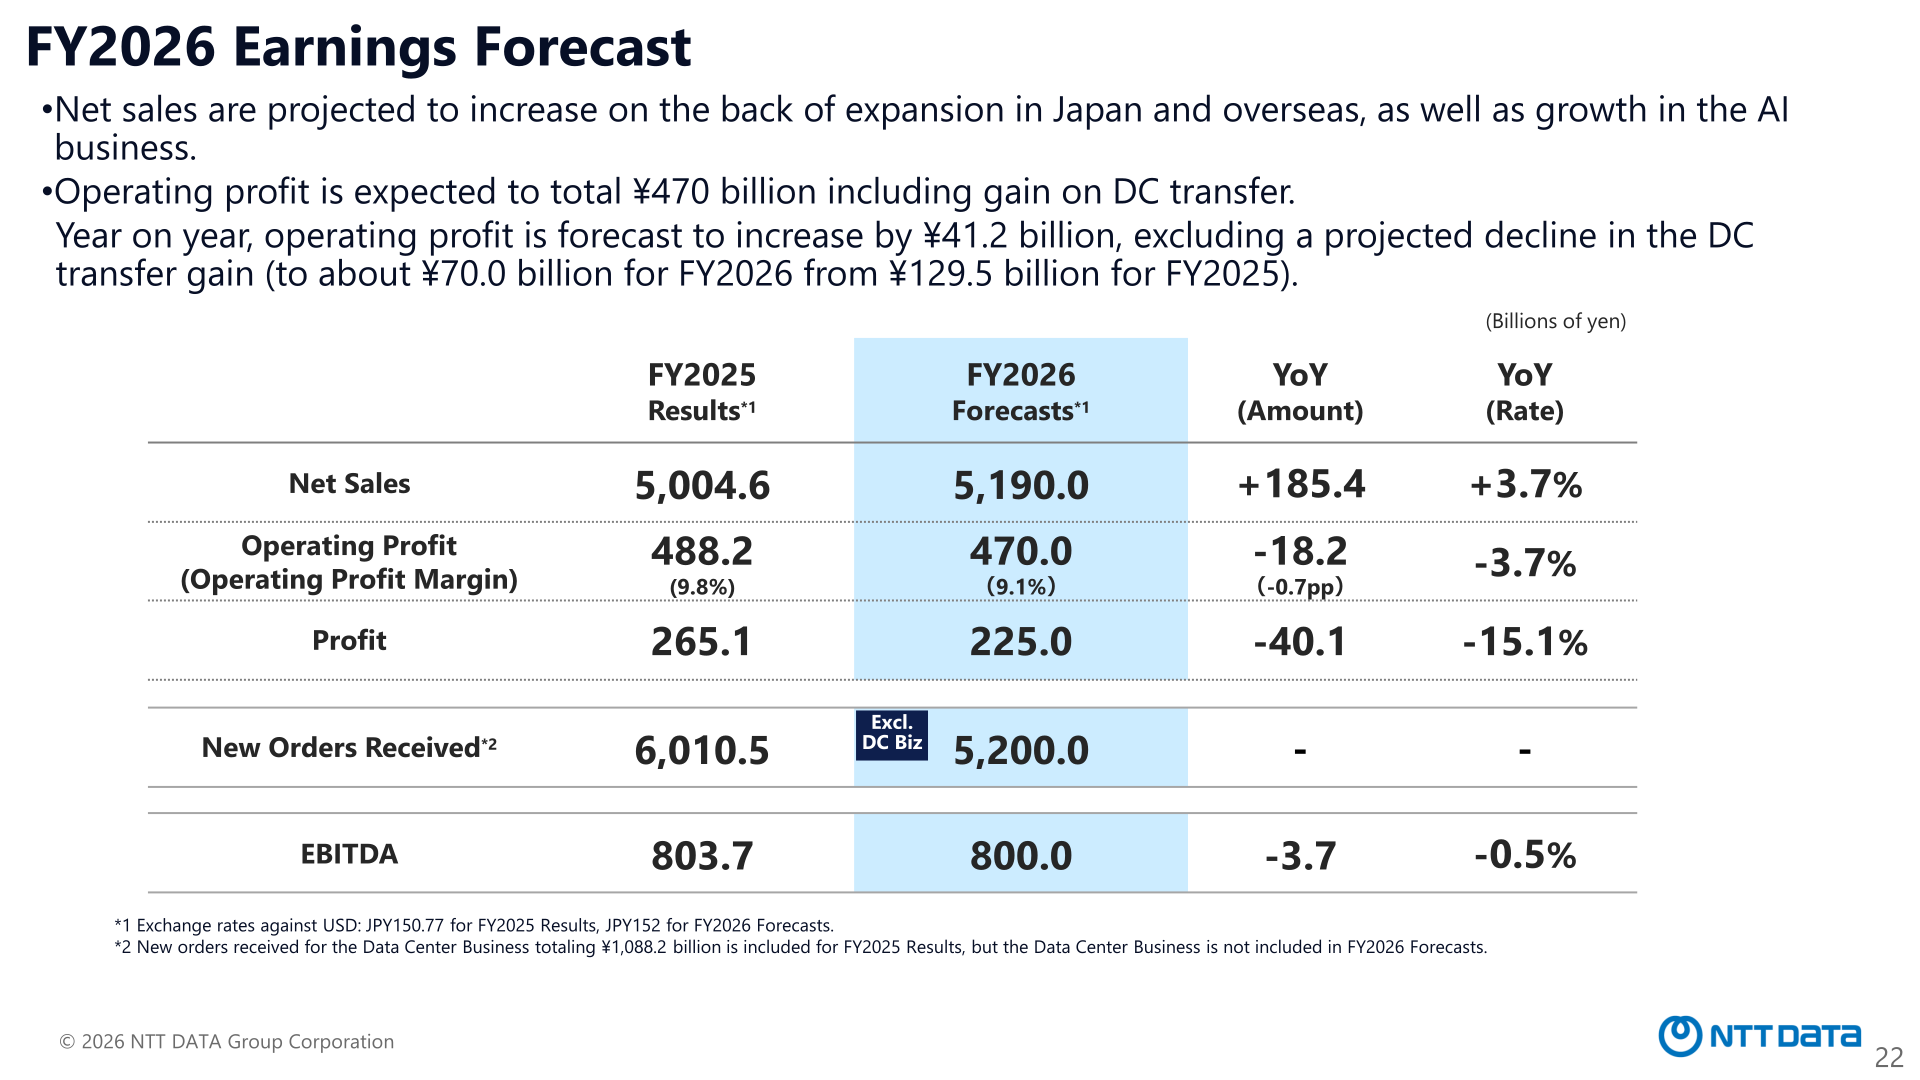
Net sales are projected to increase 3.7% year on year to ¥5,190.0 billion, on the back of expansion in Japan and overseas as well as growth in the AI business. Operating profit is forecast at ¥470.0 billion (margin 9.1%), down 3.7% year on year, a figure that includes a projected gain on DC transfer of approximately ¥70.0 billion (down from ¥129.5 billion in FY2025); excluding this decline, operating profit is expected to increase ¥41.2 billion year on year. Profit is forecast to decrease 15.1% to ¥225.0 billion. New orders received are forecast at ¥5,200.0 billion, and EBITDA is forecast at ¥800.0 billion (down 0.5% year on year); the Data Center Business is not included in the FY2026 forecast for new orders received or order backlog. In the Japan Segment, net sales and operating profit are both expected to increase year on year, with operating profit forecast to grow ¥35.0 billion, pushed up by higher net sales and AI-driven productivity improvements. In the Overseas Segment, net sales are expected to increase on the back of AI business demand creation and monetization of acquired large-scale projects; excluding the projected decline in DC transfer gain, operating profit is expected to increase ¥5.0 billion and Adjusted EBITA is expected to grow ¥15.3 billion.
| Item | FY2026 Forecast | FY2025 (Actual) | YoY |
|---|---|---|---|
| Net Sales | 5,190.0 | 5,004.6 | +3.7% |
| Operating Profit (Margin) | 470.0 (9.1%) | 488.2 (9.8%) | -3.7% |
| Profit | 225.0 | 265.1 | -15.1% |
| New Orders Received (Excl. DC Business) | 5,200.0 | 6,010.5 | – |
| EBITDA | 800.0 | 803.7 | -0.5% |
Shareholder Returns
This cannot be confirmed from the materials.
Performance Review of the Previous Medium-Term Management Plan
The company stated that it achieved all of the targets under its FY2022-FY2025 Medium-Term Management Plan, driven by robust growth in Japan and the integration and expansion of business portfolios overseas. Consolidated net sales reached ¥5.0 trillion against a target of ¥4.7 trillion; the adjusted consolidated operating profit margin (excluding one-off costs such as M&A and structural reforms) reached 10.2% against a target of 10.0%; the client base (clients from which NTT DATA earns annual revenue of ¥5 billion or more in Japan, or US$50 million or more outside Japan) reached 125 firms against a target of 120 firms; and the adjusted overseas EBITA margin reached 11.7% against a target of 10.0%. The company now operates in more than 70 countries and regions, with consolidated net sales exceeding ¥5.0 trillion; overseas sales account for approximately 60% of the total, and the company ranks 5th in global IT services revenue, based on the company’s own compilation using a Gartner report.
Growth Strategy: AI and Data Center Investment
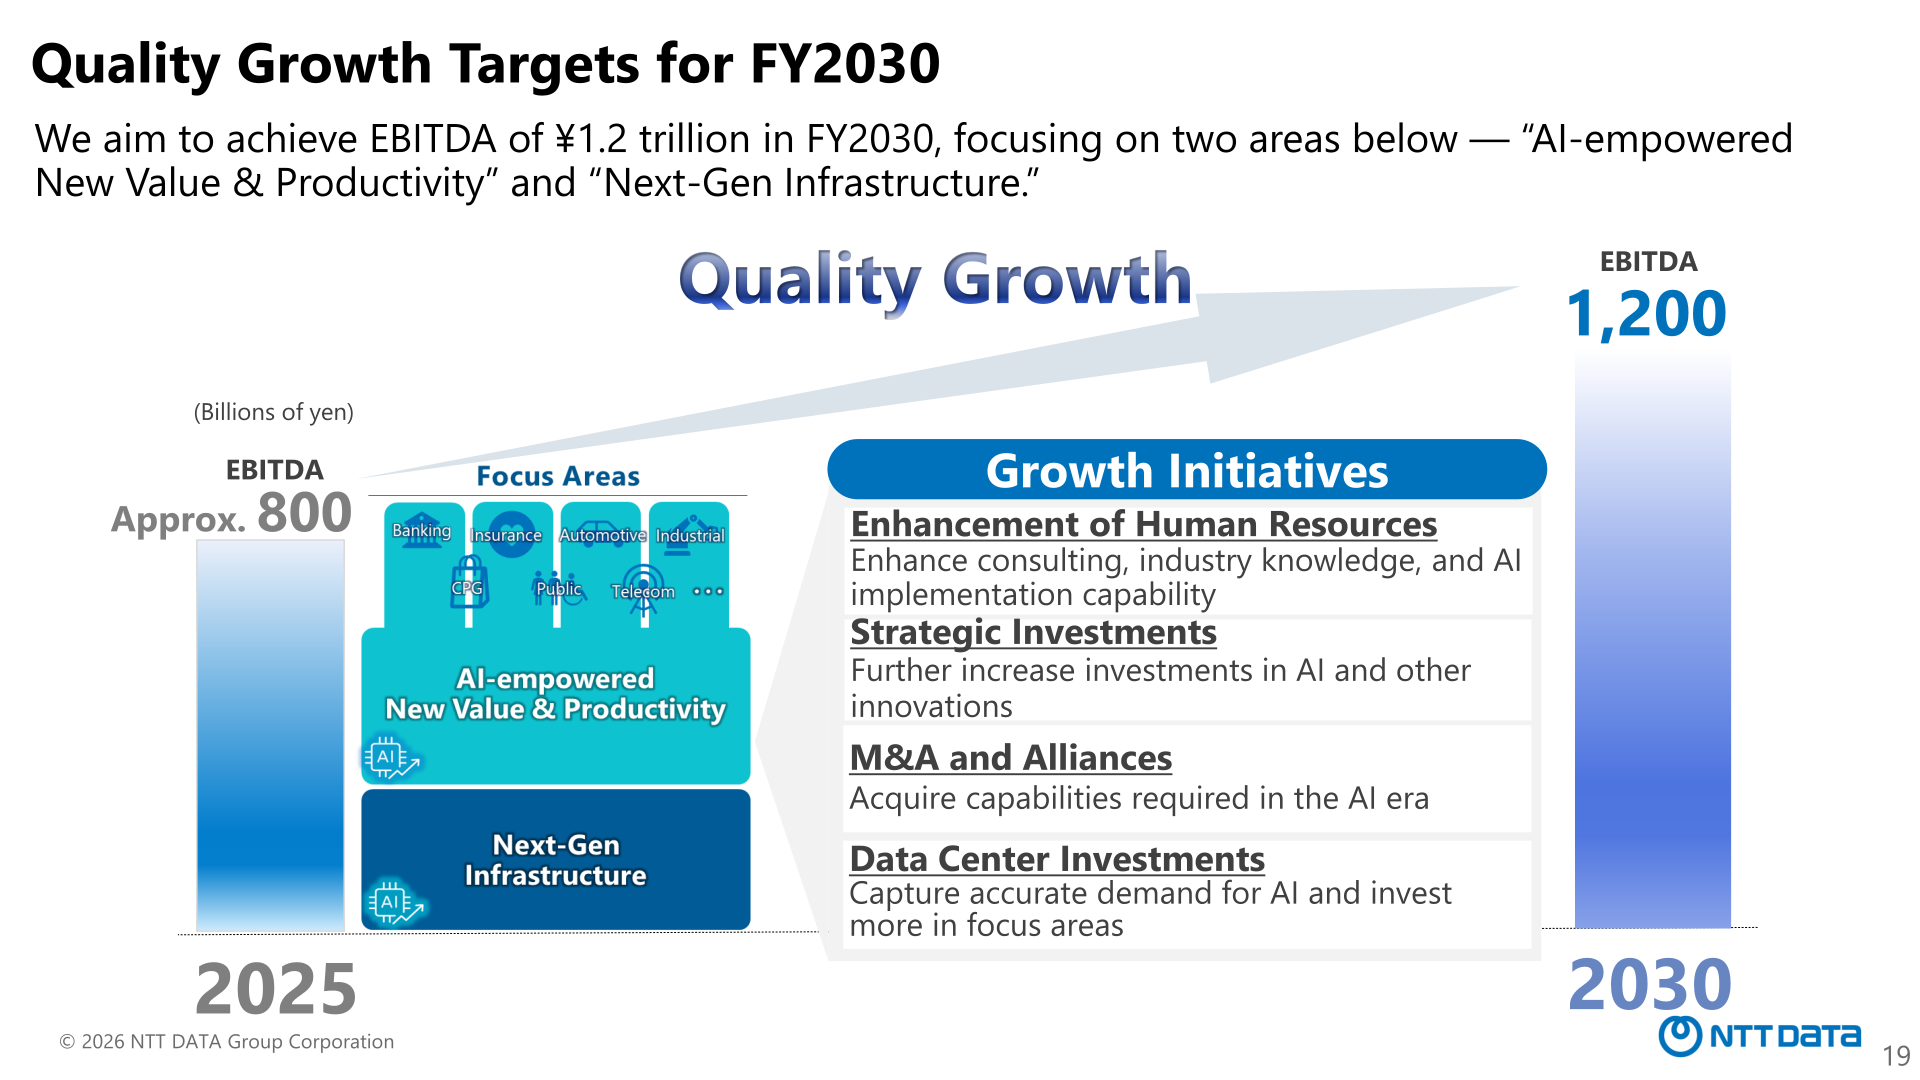
To respond to the rapid advancement of AI technologies, the company established NTT DATA AIVista in Silicon Valley to drive the Group’s AI business creation, led by CEO Bratin Saha, who previously held senior positions at NVIDIA and AWS. The strategy centers on NTT DATA AIVista’s Core AI Platform, which combines an agent/workflow function, a data management function, and an LLM integration function, to deliver industry-specific AI solutions optimized for client operations, data, and industry knowledge. On infrastructure, the company positions data centers as core infrastructure for the AI era; as of March 31, 2026, it operated approximately 1,630MW of data center capacity worldwide (approximately 675MW in the Americas, 430MW in EMEA, 425MW in India, and 100MW in APAC), which the company describes as the world’s No. 3 position in data center capacity. For FY2030, the company targets quality growth centered on ‘AI-empowered New Value & Productivity’ and ‘Next-Gen Infrastructure,’ aiming to grow EBITDA to ¥1.2 trillion from approximately ¥800.0 billion in FY2025.
This article is an analysis based on publicly available information and is not a recommendation to buy or sell any specific securities. Investment decisions are your own responsibility.
![[Obayashi] Investors’ Guide 2026 — The Complete 24-Article Breakdown](https://japan-equity.com/wp-content/uploads/2026/07/hub_cover-1024x1024.png)
![[Obayashi] IR & SR Policy — Feeding Dialogue Back into Management](https://japan-equity.com/wp-content/uploads/2026/07/p32_sq-1024x1024.jpg)
![[Obayashi] Real Estate Development — 18.7% Margin, ¥287.7bn Unrealized Gains](https://japan-equity.com/wp-content/uploads/2026/07/p20_sq-1024x1024.jpg)
![[Obayashi] Domestic Civil Engineering — Resilience Spending Supports 9.6% Margin](https://japan-equity.com/wp-content/uploads/2026/07/p11_sq-1024x1024.jpg)
![[Obayashi] Share Price & External Ratings — vs TOPIX, ESG Index Inclusion](https://japan-equity.com/wp-content/uploads/2026/07/p40_sq-1024x1024.jpg)
![[Construction] ¥75.5tn Investment, Shrinking Workforce — Big-5 Market Share](https://japan-equity.com/wp-content/uploads/2026/07/p12_sq-1024x1024.jpg)



![[Obayashi] Capital Policy & Shareholder Returns — ROE 10%+, DOE ~5%, ¥100bn Buyback](https://japan-equity.com/wp-content/uploads/2026/07/p27_sq-1024x1024.jpg)
![[Obayashi] Reducing Cross-Shareholdings — ¥285.2bn Sold in Five Years](https://japan-equity.com/wp-content/uploads/2026/07/p29_sq-1024x1024.jpg)
![[Obayashi] ¥750bn Investment Plan — ¥300bn to Development, ¥190bn to Tech/DX](https://japan-equity.com/wp-content/uploads/2026/07/p30_sq-1024x1024.jpg)
![[Obayashi] MTP2022 KPIs — Operating Profit ~2x Target, ROE 14.4%](https://japan-equity.com/wp-content/uploads/2026/07/p25_sq-1024x1024.jpg)
![[Obayashi] Cash Allocation — ¥420bn Investment CF Over Five Years](https://japan-equity.com/wp-content/uploads/2026/07/p26_sq-1024x1024.jpg)
![[Obayashi] Green Energy — 44 Plants, 344MW, and the Green Hydrogen Challenge](https://japan-equity.com/wp-content/uploads/2026/07/p21_sq-1024x1024.jpg)
![[Obayashi] Tackling the Labor Shortage — Robotics Construction®](https://japan-equity.com/wp-content/uploads/2026/07/p14_sq-1024x1024.jpg)
