
This article is based on publicly available IR materials and is not a recommendation to buy or sell any specific securities.
Note: EDION Corporation does not publish an English results presentation; this article is an English translation of the Japanese-language article on our sister site Investalk, which is based on the company’s Japanese-language IR materials, with figures transcribed as reported. The company labels this period the fiscal year ended March 2026; this site classifies the most recent completed fiscal year as FY2025, while the labels used in the text and tables follow the source materials.
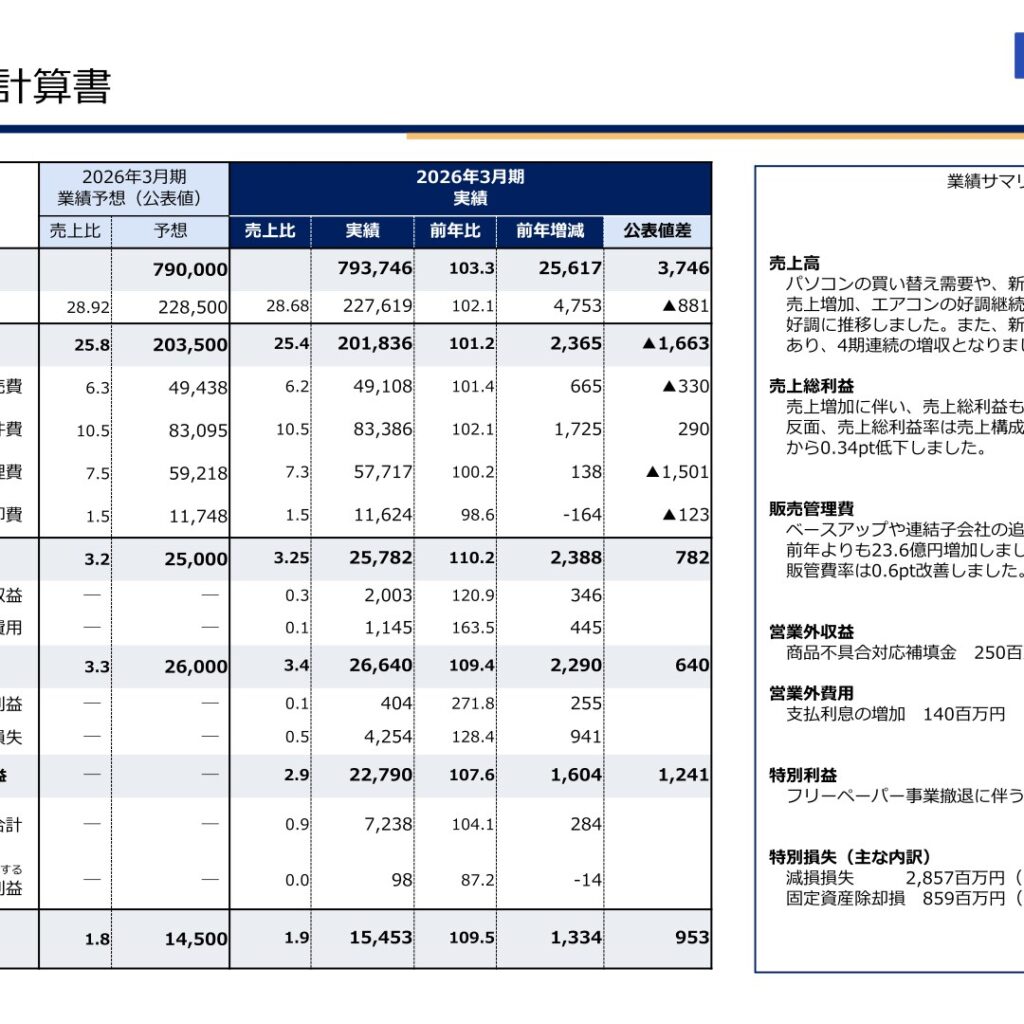
On May 11, 2026, EDION released its results presentation materials for the fiscal year ended March 2026 (April 2025 to March 2026). Net sales were 793,746 million yen (103.3% of the prior year), the fourth consecutive year of higher sales, and on a basis before the change in accounting policy they exceeded 800 billion yen for the first time since fiscal 2010. Operating profit was 25,782 million yen (110.2%), ordinary profit was 26,640 million yen (109.4%) and profit attributable to owners of parent was 15,453 million yen (109.5%), all up year on year, with both sales and profits coming in above the company’s published forecasts.
Consolidated Results (FY Ended March 2026, Actual)
Net sales increased as existing-store sales grew on personal-computer replacement demand, higher sales from new game console launches and the continued strength of air conditioners, with additional sales from new stores. The gross profit margin declined 0.34 pt year on year to 28.68% (29.01% in the prior year) due to the effect of the sales mix. Selling, general and administrative expenses rose 2.36 billion yen from the prior year on higher personnel costs and the addition of consolidated subsidiaries, while the SG&A expense ratio improved 0.6 pt to 25.4%. Non-operating income included 250 million yen of compensation received for responding to a product defect, and non-operating expenses included a 140 million yen increase in interest expense. Extraordinary income included approximately 200 million yen of compensation associated with the withdrawal from the free-paper business, and extraordinary losses included impairment losses of 2,857 million yen (up 421 million yen year on year) and loss on retirement of non-current assets of 859 million yen (up 99 million yen).
| Item | FY3/2026 Actual | YoY (% of prior year) | Change vs. Prior Year | vs. Published Forecast |
|---|---|---|---|---|
| Net sales | 793,746 million yen | 103.3% | +25,617 million yen | +3,746 million yen |
| Gross profit | 227,619 million yen (margin 28.68%) | 102.1% | +4,753 million yen | △881 million yen |
| SG&A expenses | 201,836 million yen (ratio 25.4%) | 101.2% | +2,365 million yen | △1,663 million yen |
| Operating profit | 25,782 million yen (margin 3.25%) | 110.2% | +2,388 million yen | +782 million yen |
| Ordinary profit | 26,640 million yen (margin 3.4%) | 109.4% | +2,290 million yen | +640 million yen |
| Profit attributable to owners of parent | 15,453 million yen (ratio 1.9%) | 109.5% | +1,334 million yen | +953 million yen |
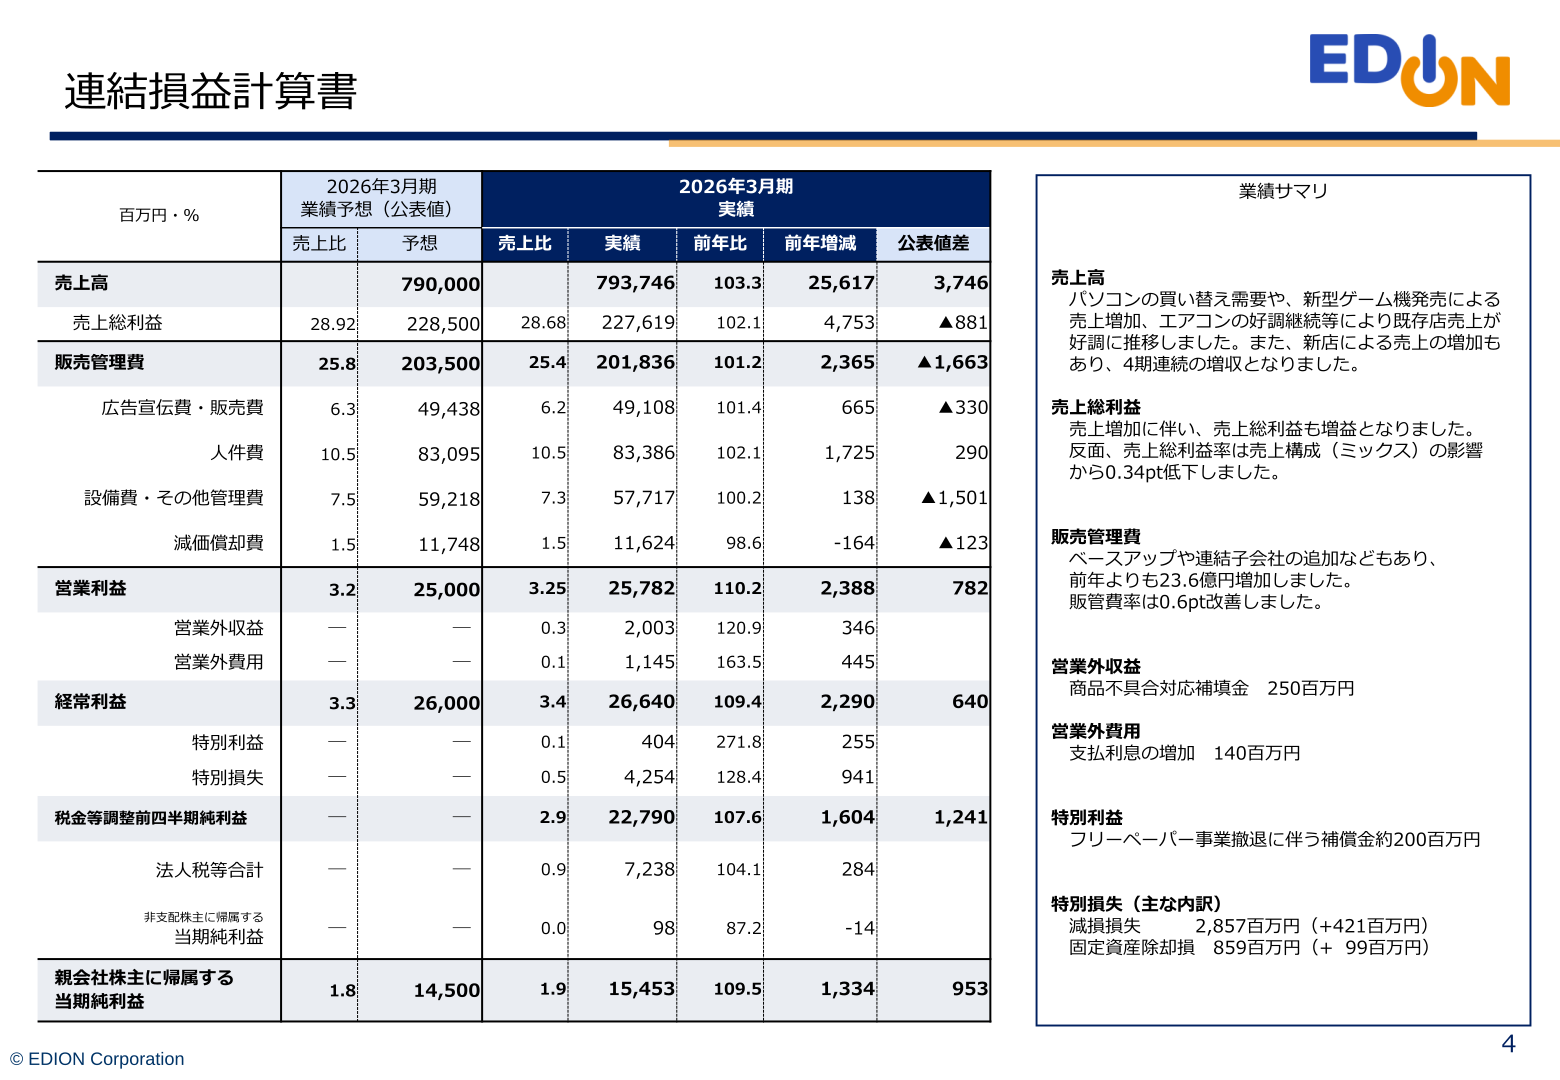
Results by Product Category (POS-Based Orders, Year on Year)
On a POS basis, cumulative full-year orders for personal computers reached 127.7% of the prior year, as replacement demand associated with the end of Windows 10 support (October 2025) remained firm through the winter sales season and the new-life season. Games and toys were 123.9%, mobile phones (units) 108.9%, and air conditioners 102.9% on continued strong demand. On the other hand, refrigerators were 93.2%, washing machines 96.6% and ELS (the remodeling business) 92.1%, all below the prior year. Televisions were 100.2% on a cumulative full-year basis, but turned to growth in the fourth quarter at 106.5% (106.6% on an existing-store basis), helped by sporting events and other factors.
| Product | Cumulative Full-Year YoY (POS basis) |
|---|---|
| Televisions | 100.2% |
| Air conditioners | 102.9% |
| Refrigerators | 93.2% |
| Washing machines | 96.6% |
| Personal computers | 127.7% |
| ELS (remodeling business) | 92.1% |
| Mobile phones (units) | 108.9% |
| Games and toys | 123.9% |
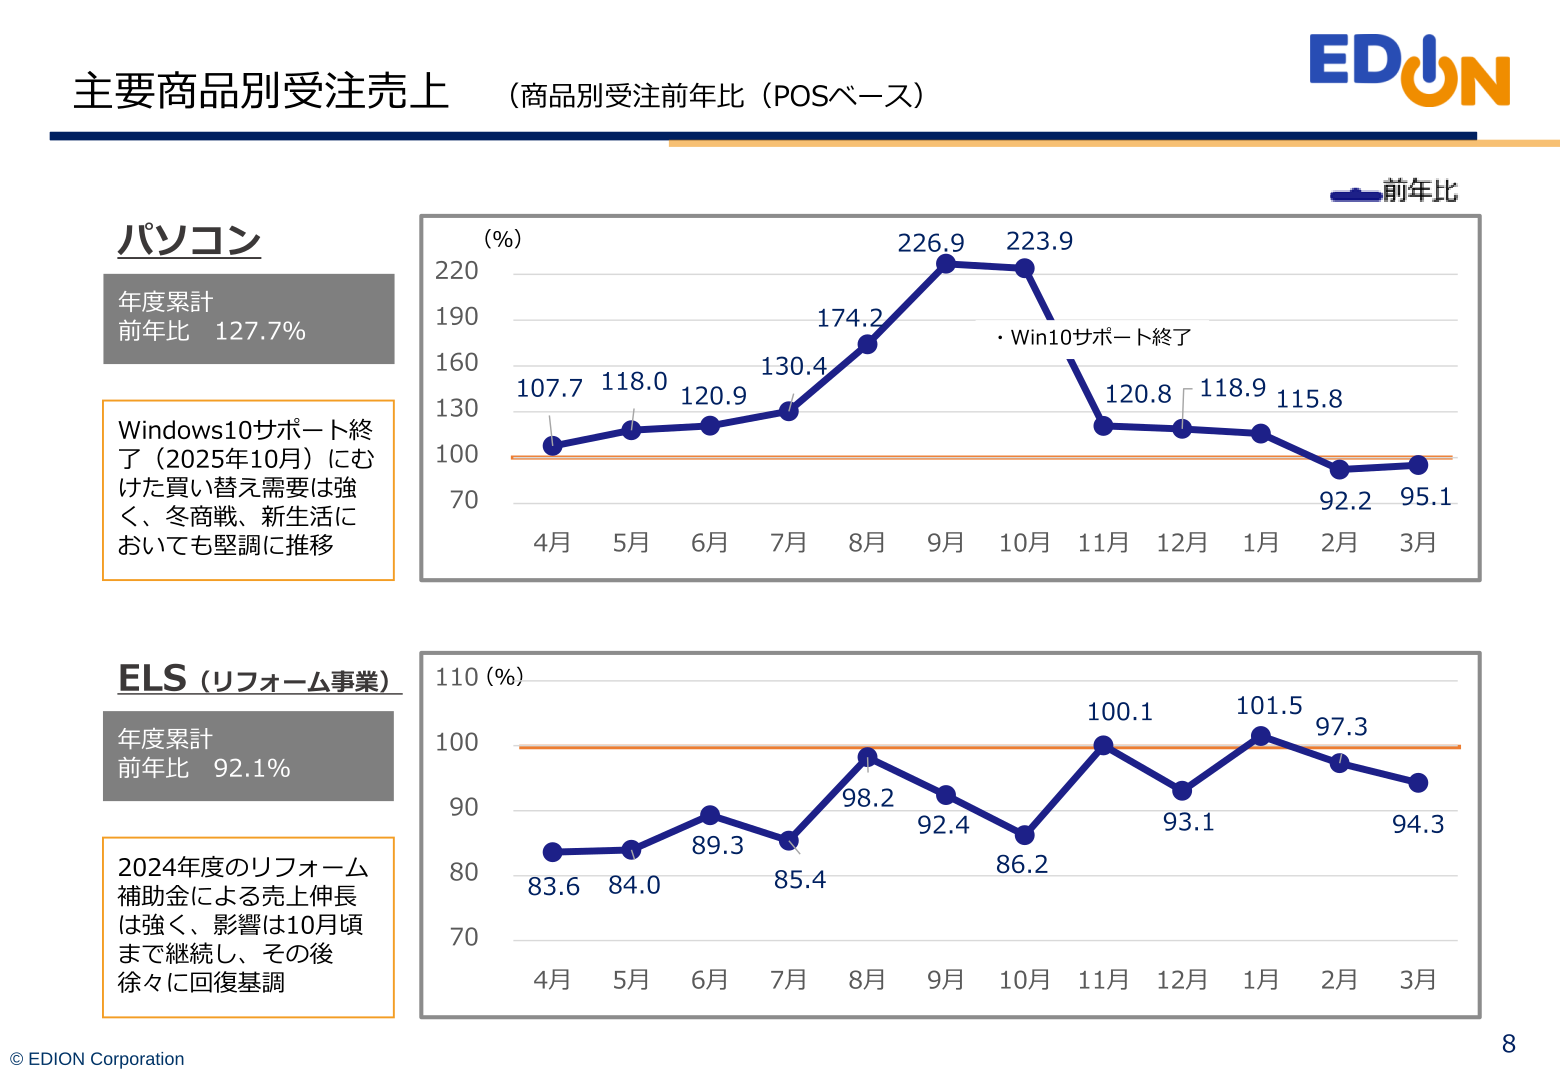
Store Openings and Closures
As of the end of March 2026 the EDION Group operated 1,180 stores (453 directly managed stores and 727 franchise stores). For the fiscal year ended March 2026 the full-year plan called for 3 new stores and 5 relocations/rebuilds, against which the actual result was 4 new stores, 4 relocations/rebuilds and 5 closures, for a net change of -1 store and 453 stores at the period-end (versus the plan of 457 stores). For the fiscal year ending March 2027 the company plans 2 new stores and 7 relocations/rebuilds, and expects 455 stores at the period-end. In April 2026 the Okayama Main Store (Okayama Prefecture) opened as an S&B store.
| Category | New | Relocation / Rebuild | Closure | Net Change | Stores at Period-End |
|---|---|---|---|---|---|
| FY3/2026 Plan (full year) | 3 stores | 5 stores | – | +3 stores | 457 stores |
| FY3/2026 Actual (full year) | 4 stores | 4 stores | 5 stores | -1 store | 453 stores |
| FY3/2027 Plan (full year) | 2 stores | 7 stores | – | +2 stores | 455 stores |
Full-Year Forecast (FY Ending March 2027)
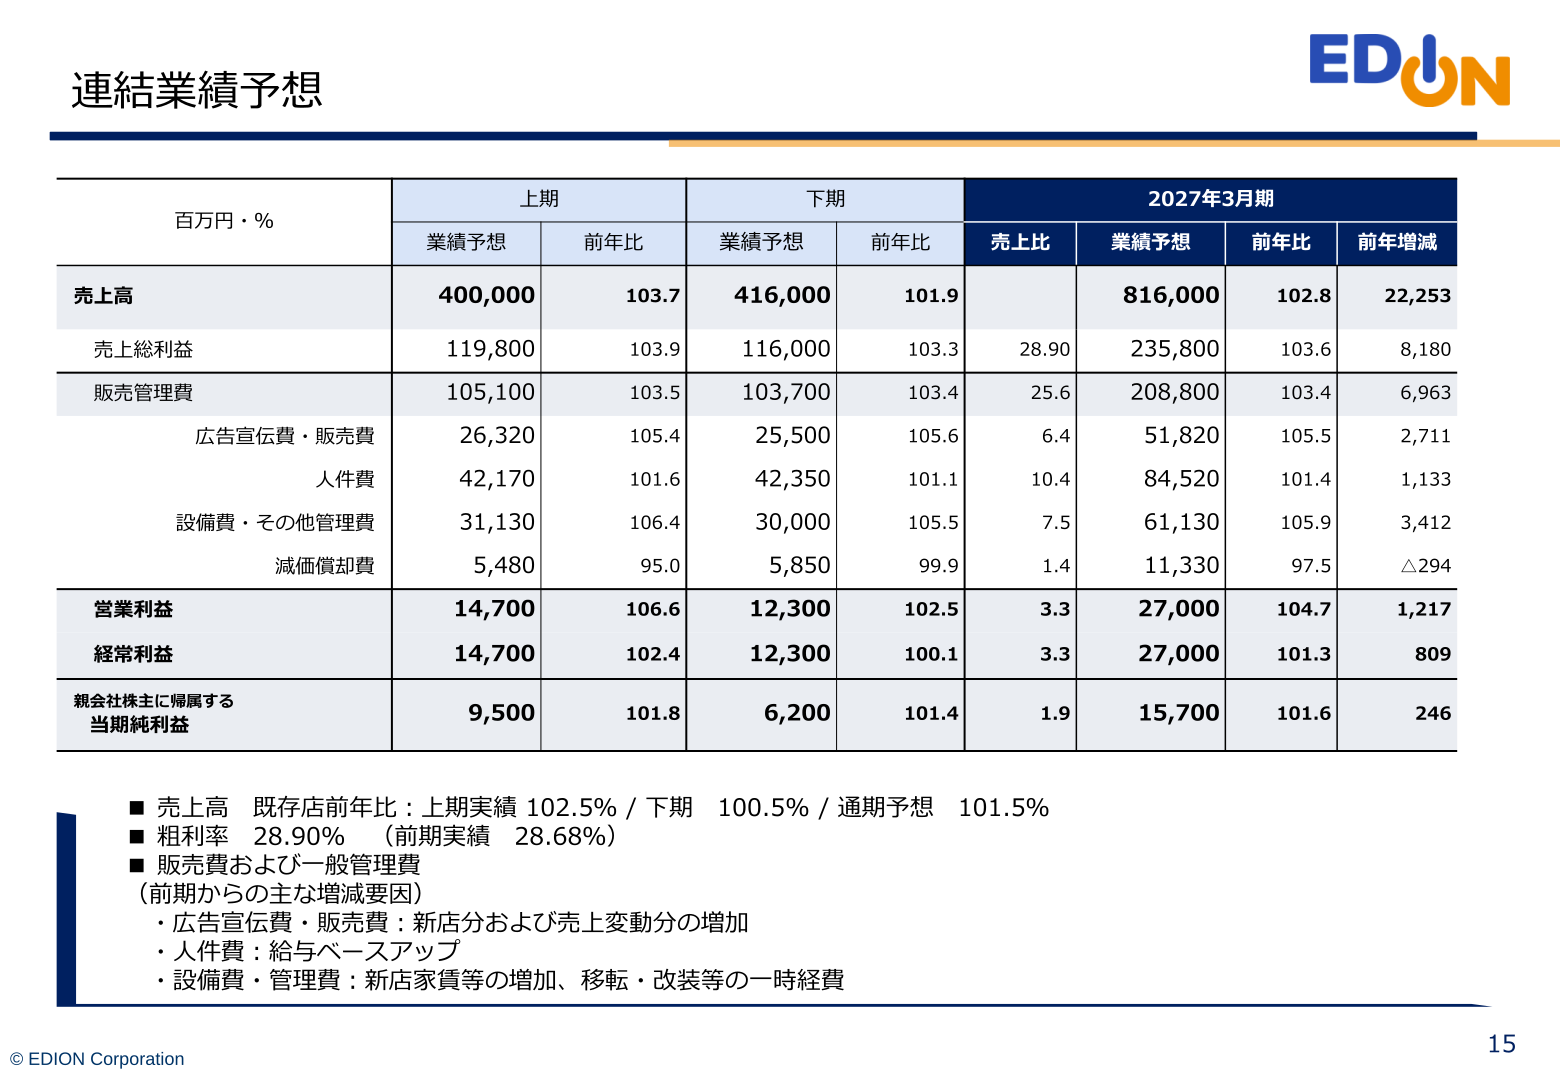
For the fiscal year ending March 2027, on the assumption that existing-store sales run at 102.5% in the first half, 100.5% in the second half and 101.5% for the full year, the company expects net sales of 816,000 million yen (102.8% of the prior year) and a gross profit margin of 28.90% (28.68% actual in the prior year). SG&A expenses are planned at 208,800 million yen (103.4% of the prior year), reflecting increases from new stores and sales volume, base pay increases, higher rent at new stores and one-time expenses for relocations and renovations. Operating profit is projected at 27,000 million yen (104.7%), ordinary profit at 27,000 million yen (101.3%) and profit attributable to owners of parent at 15,700 million yen (101.6%).
| Item | FY3/2027 Forecast | YoY (% of prior year) | FY3/2026 Actual |
|---|---|---|---|
| Net sales | 816,000 million yen | 102.8% | 793,746 million yen |
| Gross profit | 235,800 million yen (margin 28.90%) | 103.6% | 227,619 million yen (28.68%) |
| SG&A expenses | 208,800 million yen (ratio 25.6%) | 103.4% | 201,836 million yen (25.4%) |
| Operating profit | 27,000 million yen (margin 3.3%) | 104.7% | 25,782 million yen (3.25%) |
| Ordinary profit | 27,000 million yen (margin 3.3%) | 101.3% | 26,640 million yen (3.4%) |
| Profit attributable to owners of parent | 15,700 million yen (ratio 1.9%) | 101.6% | 15,453 million yen (1.9%) |
Shareholder Returns
On dividends, the company’s basic policy is a stable dividend with a payout ratio of 30% or more, determined by taking earnings and the business environment into comprehensive account. Purchases of treasury shares are carried out flexibly, premised on shareholder return measures that contribute to improved capital efficiency and taking comprehensive account of earnings and the business environment as well as market conditions including investment and the share price. According to the consolidated statement of cash flows, purchases of treasury shares in the fiscal year ended March 2026 were 2,017 million yen (7,986 million yen in the prior year) and dividends paid were 4,581 million yen (4,482 million yen in the prior year).
Medium-Term Vision (Fiscal 2026 to Fiscal 2030)
As its medium-term vision for fiscal 2026 to fiscal 2030, the company sets out four pillars: the pursuit of efficiency, renewal of the personnel system and the organization, growth of existing businesses, and growth strategy. Its medium-term targets for fiscal 2030 are net sales of 920 billion yen, ordinary profit of 35 billion yen (ordinary profit margin moving from 3.3% to 3.8%), net income of 20 billion yen, ROE of 8.0% and ROIC of 7.5%. The ELS (remodeling) business is targeting 100 billion yen in fiscal 2030 (65 billion yen in fiscal 2025 on a preliminary basis). Under the five-year cash allocation plan, operating cash flow of 160,000 million yen and other sources are to be allocated to growth investment of 100,000 million yen (62.5%) and shareholder returns of 60,000 million yen (37.5%).
This article is an analysis based on publicly available information and is not a recommendation to buy or sell any specific securities. Investment decisions are your own responsibility.
















