
This article is based on publicly available IR materials and is not a recommendation to buy or sell any specific securities.
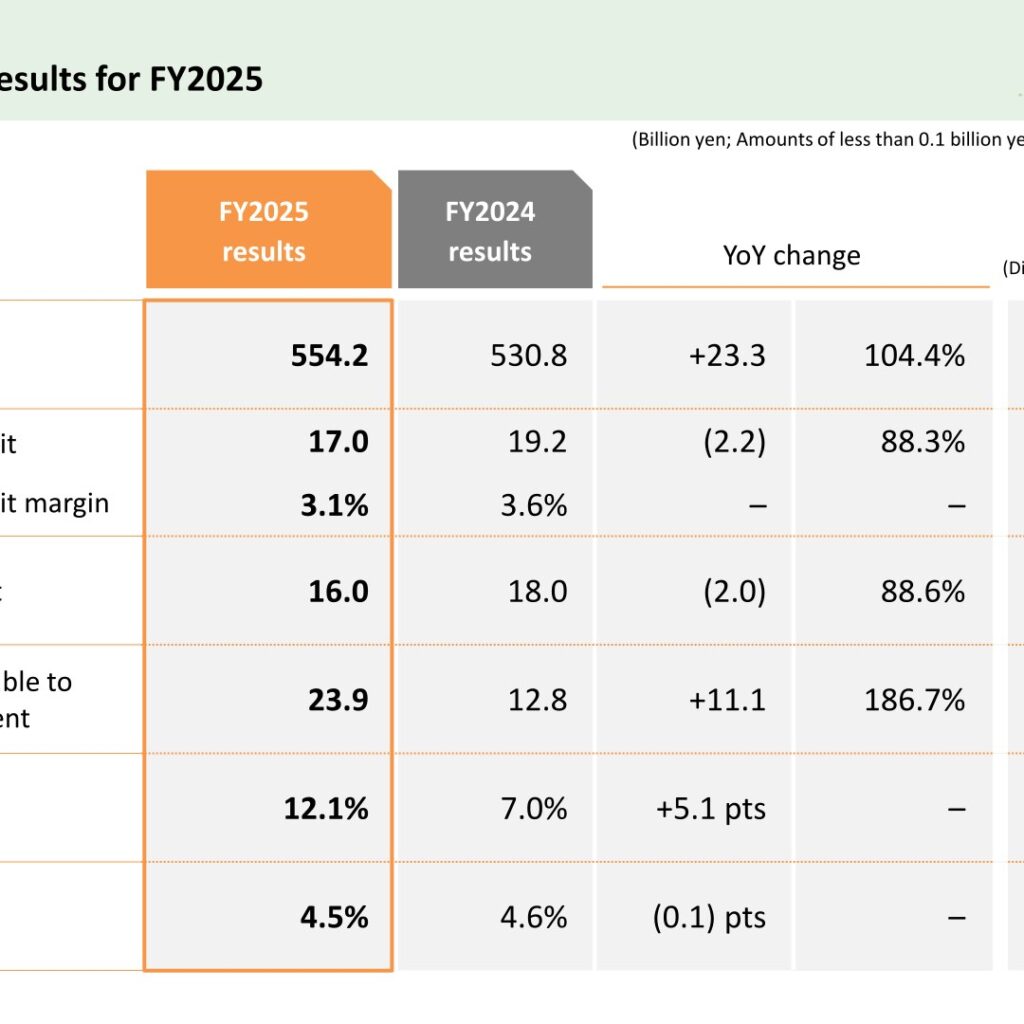
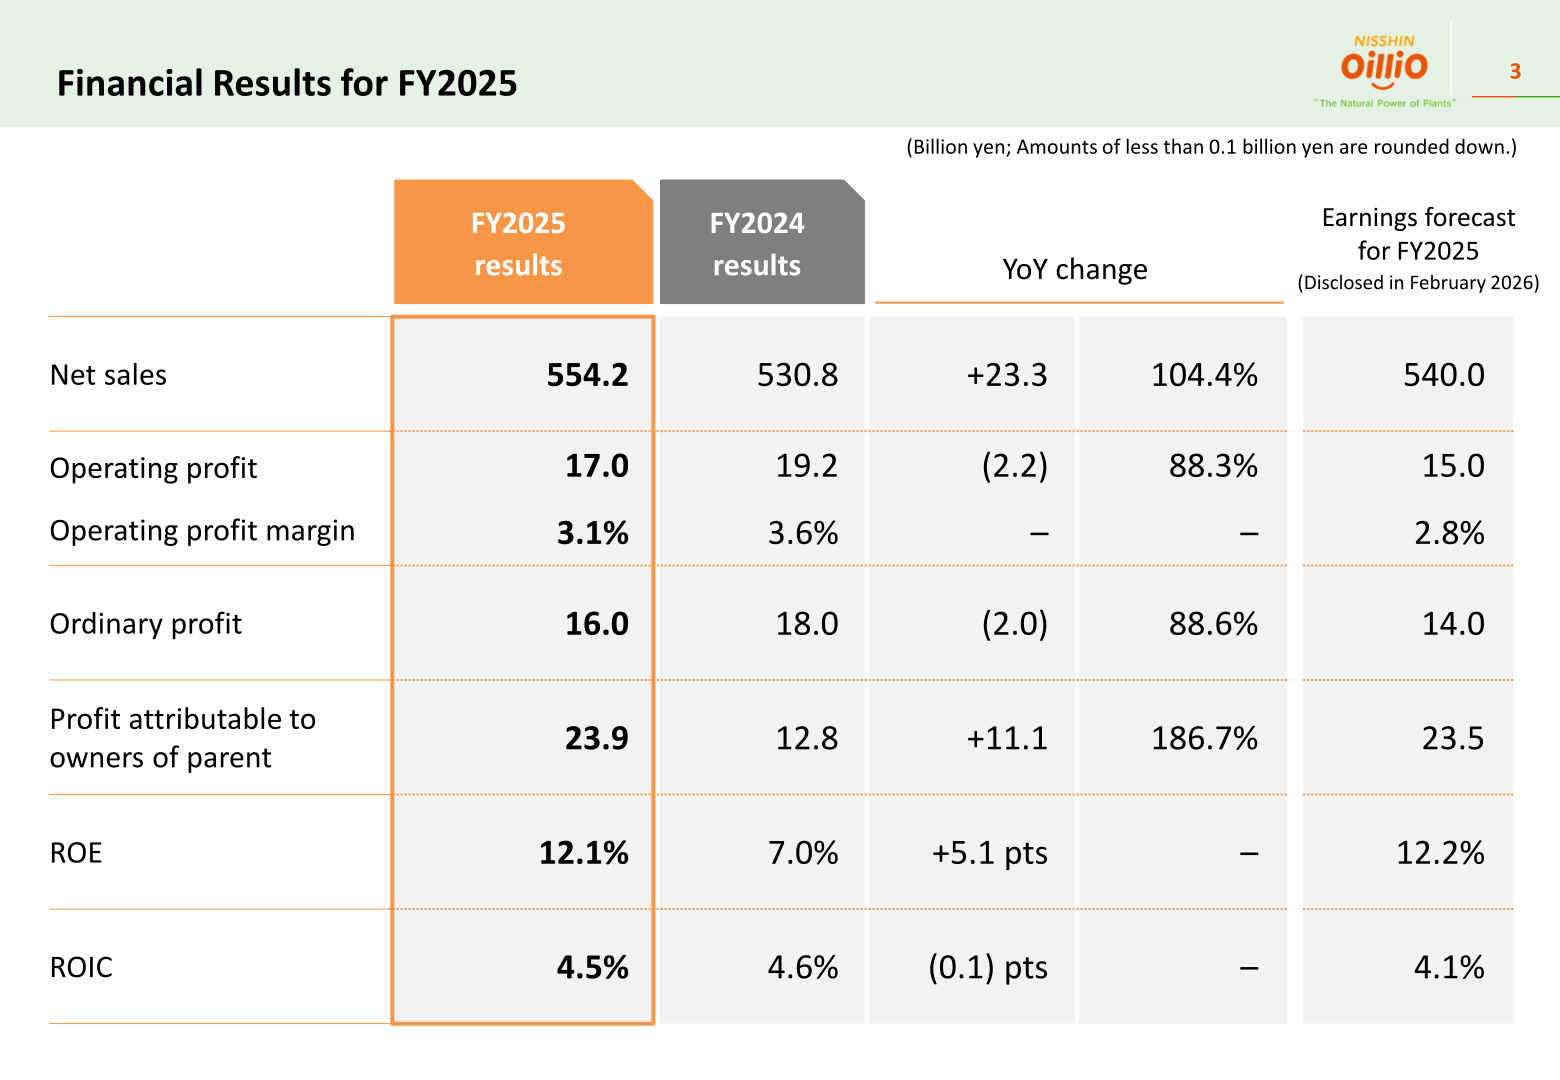
The Nisshin OilliO Group reported net sales of 554.2 billion yen for FY2025, up 23.3 billion yen year on year (104.4%), while operating profit fell 2.2 billion yen to 17.0 billion yen (88.3%) and ordinary profit declined 2.0 billion yen to 16.0 billion yen (88.6%). Profit attributable to owners of parent rose 11.1 billion yen to 23.9 billion yen (186.7% year on year), ahead of the 23.5 billion yen forecast disclosed in February 2026. ROE improved 5.1 points to 12.1%, while ROIC slipped 0.1 points to 4.5%. The company labels the year ended March 31, 2026 as “FY2025”, and the labels in the tables below follow the presentation.
Consolidated Results (Full-Year Actual)
Net sales exceeded the February 2026 forecast of 540.0 billion yen, and operating profit of 17.0 billion yen also came in above the 15.0 billion yen forecast, but both operating profit and ordinary profit declined year on year. The operating profit margin was 3.1%, down from 3.6% in FY2024. Amounts are stated in billions of yen, with amounts of less than 0.1 billion yen rounded down.
| Item | FY2025 results | FY2024 results | YoY change | YoY (%) | Earnings forecast for FY2025 (Disclosed in February 2026) |
|---|---|---|---|---|---|
| Net sales | 554.2 | 530.8 | +23.3 | 104.4% | 540.0 |
| Operating profit | 17.0 | 19.2 | (2.2) | 88.3% | 15.0 |
| Operating profit margin | 3.1% | 3.6% | – | – | 2.8% |
| Ordinary profit | 16.0 | 18.0 | (2.0) | 88.6% | 14.0 |
| Profit attributable to owners of parent | 23.9 | 12.8 | +11.1 | 186.7% | 23.5 |
| ROE | 12.1% | 7.0% | +5.1 pts | – | 12.2% |
| ROIC | 4.5% | 4.6% | (0.1) pts | – | 4.1% |
Segment Results
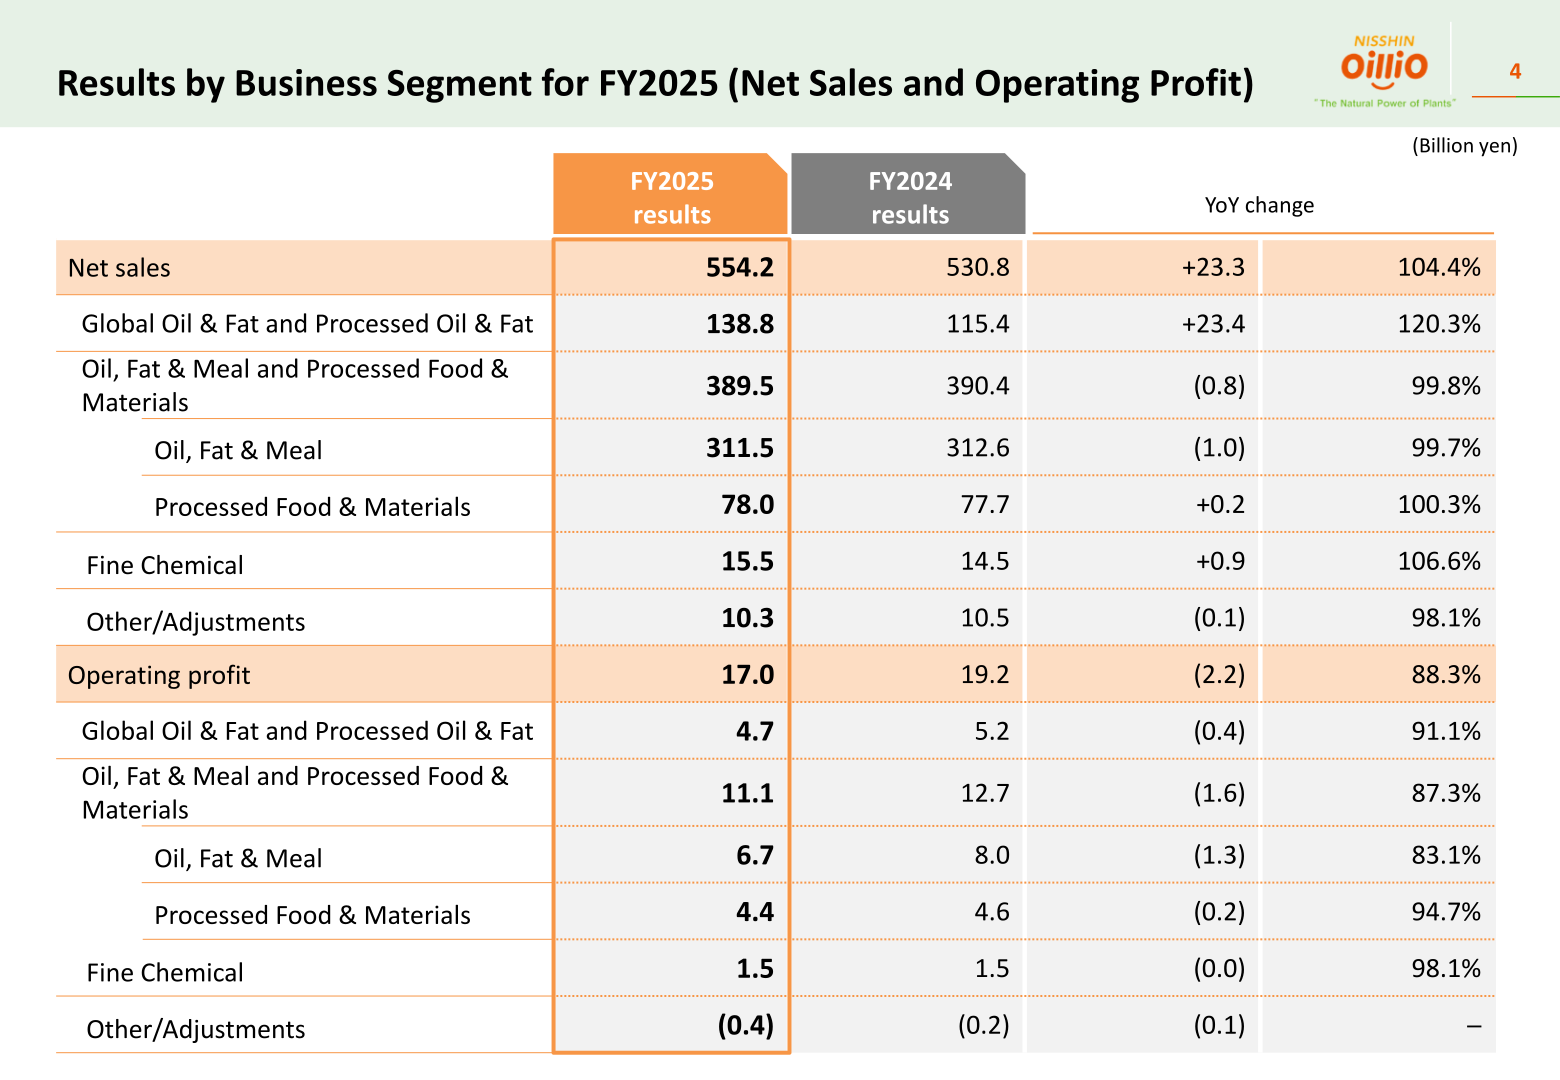
Global Oil & Fat and Processed Oil & Fat drove the sales increase, with net sales up 23.4 billion yen to 138.8 billion yen (120.3%), while Oil, Fat & Meal and Processed Food & Materials was broadly flat at 389.5 billion yen (99.8%). On the profit line, however, every reported segment was flat or lower: Global Oil & Fat and Processed Oil & Fat operating profit fell to 4.7 billion yen (91.1%), Oil, Fat & Meal and Processed Food & Materials to 11.1 billion yen (87.3%), and Fine Chemical was essentially unchanged at 1.5 billion yen (98.1%).
| Item | FY2025 results | FY2024 results | YoY change | YoY (%) |
|---|---|---|---|---|
| Net sales | 554.2 | 530.8 | +23.3 | 104.4% |
| Global Oil & Fat and Processed Oil & Fat | 138.8 | 115.4 | +23.4 | 120.3% |
| Oil, Fat & Meal and Processed Food & Materials | 389.5 | 390.4 | (0.8) | 99.8% |
| Oil, Fat & Meal | 311.5 | 312.6 | (1.0) | 99.7% |
| Processed Food & Materials | 78.0 | 77.7 | +0.2 | 100.3% |
| Fine Chemical | 15.5 | 14.5 | +0.9 | 106.6% |
| Other/Adjustments | 10.3 | 10.5 | (0.1) | 98.1% |
| Operating profit | 17.0 | 19.2 | (2.2) | 88.3% |
| Global Oil & Fat and Processed Oil & Fat | 4.7 | 5.2 | (0.4) | 91.1% |
| Oil, Fat & Meal and Processed Food & Materials | 11.1 | 12.7 | (1.6) | 87.3% |
| Oil, Fat & Meal | 6.7 | 8.0 | (1.3) | 83.1% |
| Processed Food & Materials | 4.4 | 4.6 | (0.2) | 94.7% |
| Fine Chemical | 1.5 | 1.5 | (0.0) | 98.1% |
| Other/Adjustments | (0.4) | (0.2) | (0.1) | ─ |
In Global Oil & Fat and Processed Oil & Fat, the company states that operating profit decreased year on year due to the significant impact of mark-to-market valuation losses on palm oil transactions, despite profit growth driven mainly by higher sales volume of confectionery fats and an improvement in gross profit per unit achieved through its successful capture of demand for cocoa butter substitutes. The mark-to-market valuation of palm oil transactions swung from +0.45 billion yen in FY2024 to (1.15) billion yen in FY2025, and confectionery fats sales volume rose 4% year on year. In Oil, Fat & Meal, operating profit decreased due to higher oil & fat costs and lower sales volume of household-use products, coupled with higher SG&A expenses, despite higher unit sales prices; household-use sales volume fell 9%. In Processed Food & Materials, Daito Cacao posted higher profit on higher gross profit per unit in chocolate products despite lower sales volume, while profit decreased at overseas subsidiaries. Fine Chemical operating profit remained flat, as lower overseas sales volume offset higher sales volume of cosmetic ingredients in Japan.
Balance Sheet and Cash Flows
Total assets increased 62.9 billion yen to 451.1 billion yen as of the end of March 2026, with interest-bearing liabilities up 27.5 billion yen to 118.2 billion yen. The equity ratio was 46.6% (48.2% a year earlier) and the net D/E ratio was 0.47 (0.39). Operating cash flows fell 10.7 billion yen to +10.4 billion yen, mainly reflecting a 16.0 billion yen swing in working capital.
| Item | End of March 2026 / FY2025 | End of March 2025 / FY2024 | Change |
|---|---|---|---|
| Total assets | 451.1 | 388.2 | +62.9 |
| Current assets | 262.0 | 228.6 | +33.4 |
| Non-current assets | 189.0 | 159.5 | +29.5 |
| Total liabilities | 229.1 | 190.1 | +39.0 |
| Interest-bearing liabilities | 118.2 | 90.7 | +27.5 |
| Other liabilities | 110.8 | 99.3 | +11.5 |
| Total net assets | 222.0 | 198.0 | +23.9 |
| Equity ratio | 46.6% | 48.2% | – |
| Net D/E ratio | 0.47 | 0.39 | – |
| Operating cash flows | +10.4 | +21.1 | (10.7) |
| Depreciation | +11.5 | +10.4 | +1.1 |
| Decrease (increase) in working capital | (12.4) | +3.6 | (16.0) |
| Investing cash flows | (9.8) | (9.5) | (0.2) |
| Financing cash flows | +8.2 | (13.8) | +22.1 |
Next-Year Forecast
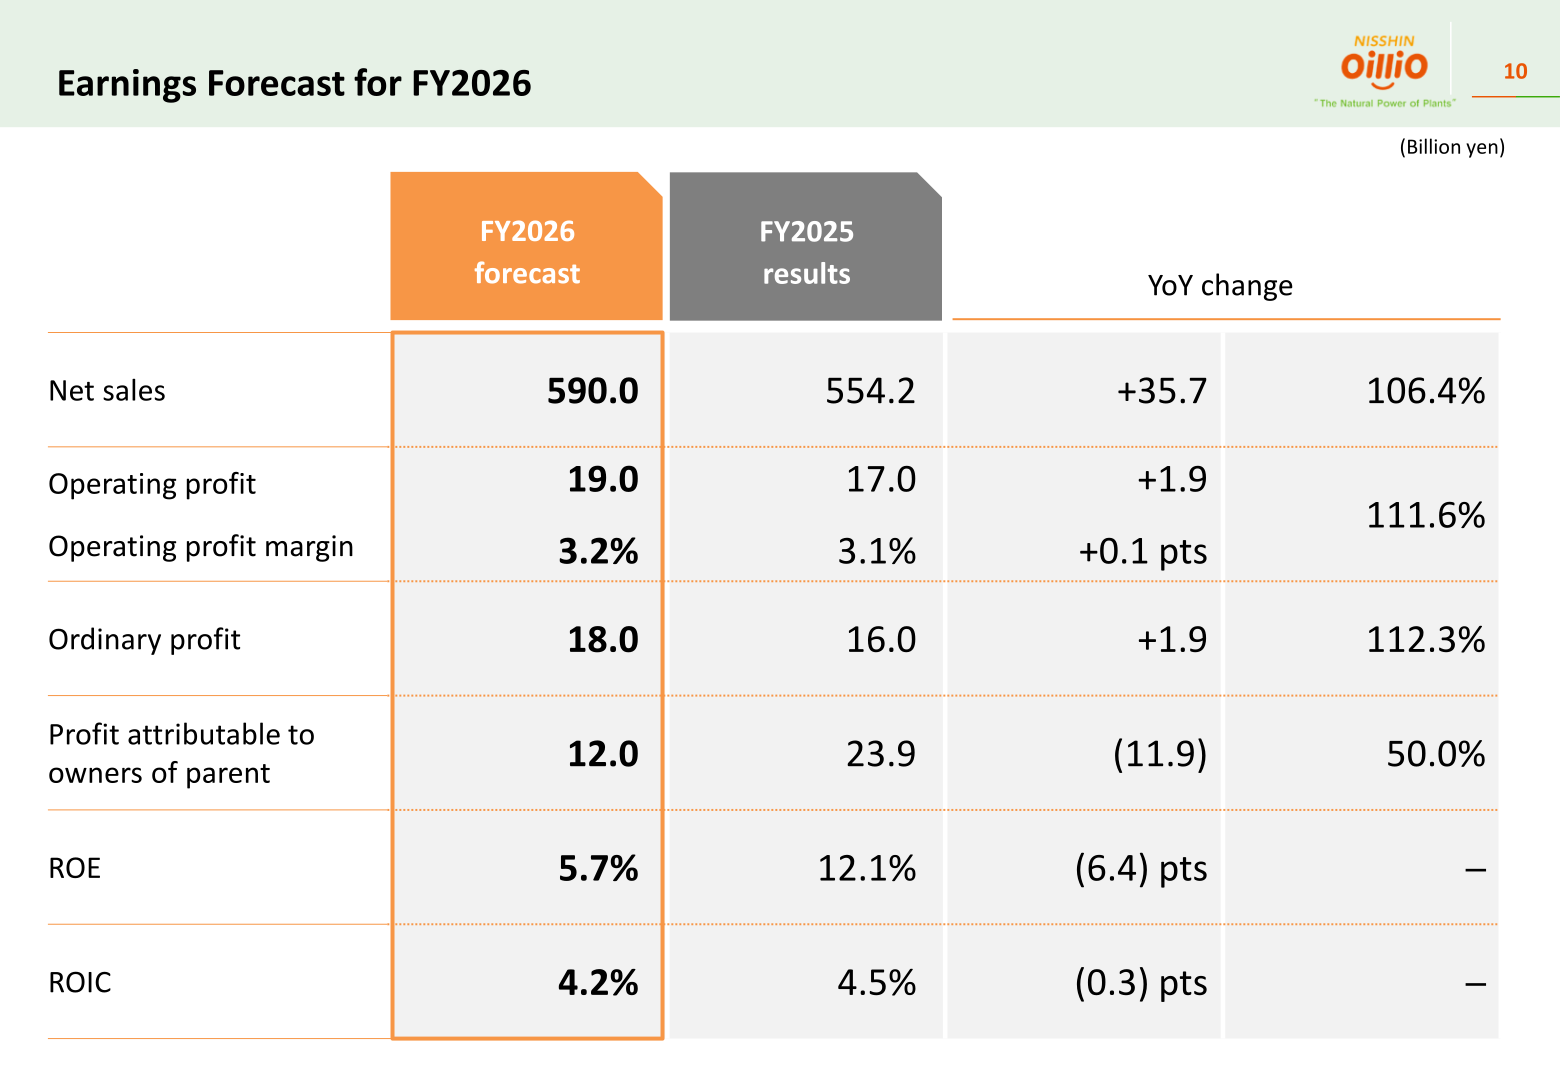
For FY2026, the company forecasts net sales of 590.0 billion yen (+35.7 billion yen, 106.4%), operating profit of 19.0 billion yen (+1.9 billion yen, 111.6%) and ordinary profit of 18.0 billion yen (+1.9 billion yen, 112.3%). Profit attributable to owners of parent is projected to halve to 12.0 billion yen (50.0%), with ROE at 5.7% and ROIC at 4.2%.
| Item | FY2026 forecast | FY2025 results | YoY change | YoY (%) |
|---|---|---|---|---|
| Net sales | 590.0 | 554.2 | +35.7 | 106.4% |
| Operating profit | 19.0 | 17.0 | +1.9 | 111.6% |
| Operating profit margin | 3.2% | 3.1% | +0.1 pts | 111.6% |
| Ordinary profit | 18.0 | 16.0 | +1.9 | 112.3% |
| Profit attributable to owners of parent | 12.0 | 23.9 | (11.9) | 50.0% |
| ROE | 5.7% | 12.1% | (6.4) pts | ─ |
| ROIC | 4.2% | 4.5% | (0.3) pts | ─ |
By segment, the company expects Global Oil & Fat and Processed Oil & Fat operating profit to recover to 6.9 billion yen (144.8%) on appropriate sales pricing, higher confectionery fats sales volume (+8%) and the impact of mark-to-market valuation of palm oil transactions. Oil, Fat & Meal operating profit is forecast at 7.6 billion yen (113.3%) on higher sales volume and sales price revisions, while Processed Food & Materials is expected to fall to 3.0 billion yen (67.9%) on higher chocolate product costs and lower unit sales prices as cocoa bean market prices drop. Fine Chemical is forecast at 1.8 billion yen (118.7%) on higher cosmetic ingredient sales volume in Japan and overseas.
| Item | FY2026 forecast | FY2025 results | YoY change | YoY (%) |
|---|---|---|---|---|
| Net sales | 590.0 | 554.2 | +35.7 | 106.4% |
| Global Oil & Fat and Processed Oil & Fat | 149.0 | 138.8 | +10.2 | 107.3% |
| Oil, Fat & Meal and Processed Food & Materials | 411.9 | 389.5 | +22.3 | 105.7% |
| Oil, Fat & Meal | 328.4 | 311.5 | +16.8 | 105.4% |
| Processed Food & Materials | 83.5 | 78.0 | +5.5 | 107.1% |
| Fine Chemical | 18.6 | 15.5 | +3.1 | 120.2% |
| Other/Adjustments | 10.3 | 10.3 | +0.0 | 100.4% |
| Operating profit | 19.0 | 17.0 | +1.9 | 111.6% |
| Global Oil & Fat and Processed Oil & Fat | 6.9 | 4.7 | +2.1 | 144.8% |
| Oil, Fat & Meal and Processed Food & Materials | 10.6 | 11.1 | (0.5) | 95.3% |
| Oil, Fat & Meal | 7.6 | 6.7 | +0.8 | 113.3% |
| Processed Food & Materials | 3.0 | 4.4 | (1.4) | 67.9% |
| Fine Chemical | 1.8 | 1.5 | +0.2 | 118.7% |
| Other/Adjustments | (0.3) | (0.4) | +0.0 | ─ |
Medium-Term Plan (Value UpX) and Key Measures
FY2025 was the first fiscal year of the Value UpX medium-term plan. The company states that it steadily delivered results in its growth-driving segments — appropriate price pass-through for chocolate and confectionery fats gained further market acceptance, and the Fine Chemical business captured global demand for cosmetic ingredients — but identified challenges related to profitability and efficiency in the domestic oil, fat & meal business, where earnings declined as price pass-through lagged behind rising costs for raw materials and logistics and higher oil values, and where working capital increased. It positions FY2026 as the year of restarting efforts to achieve the Value UpX targets, with short-term priorities of completing price revisions and optimizing invested capital across the balance sheet.
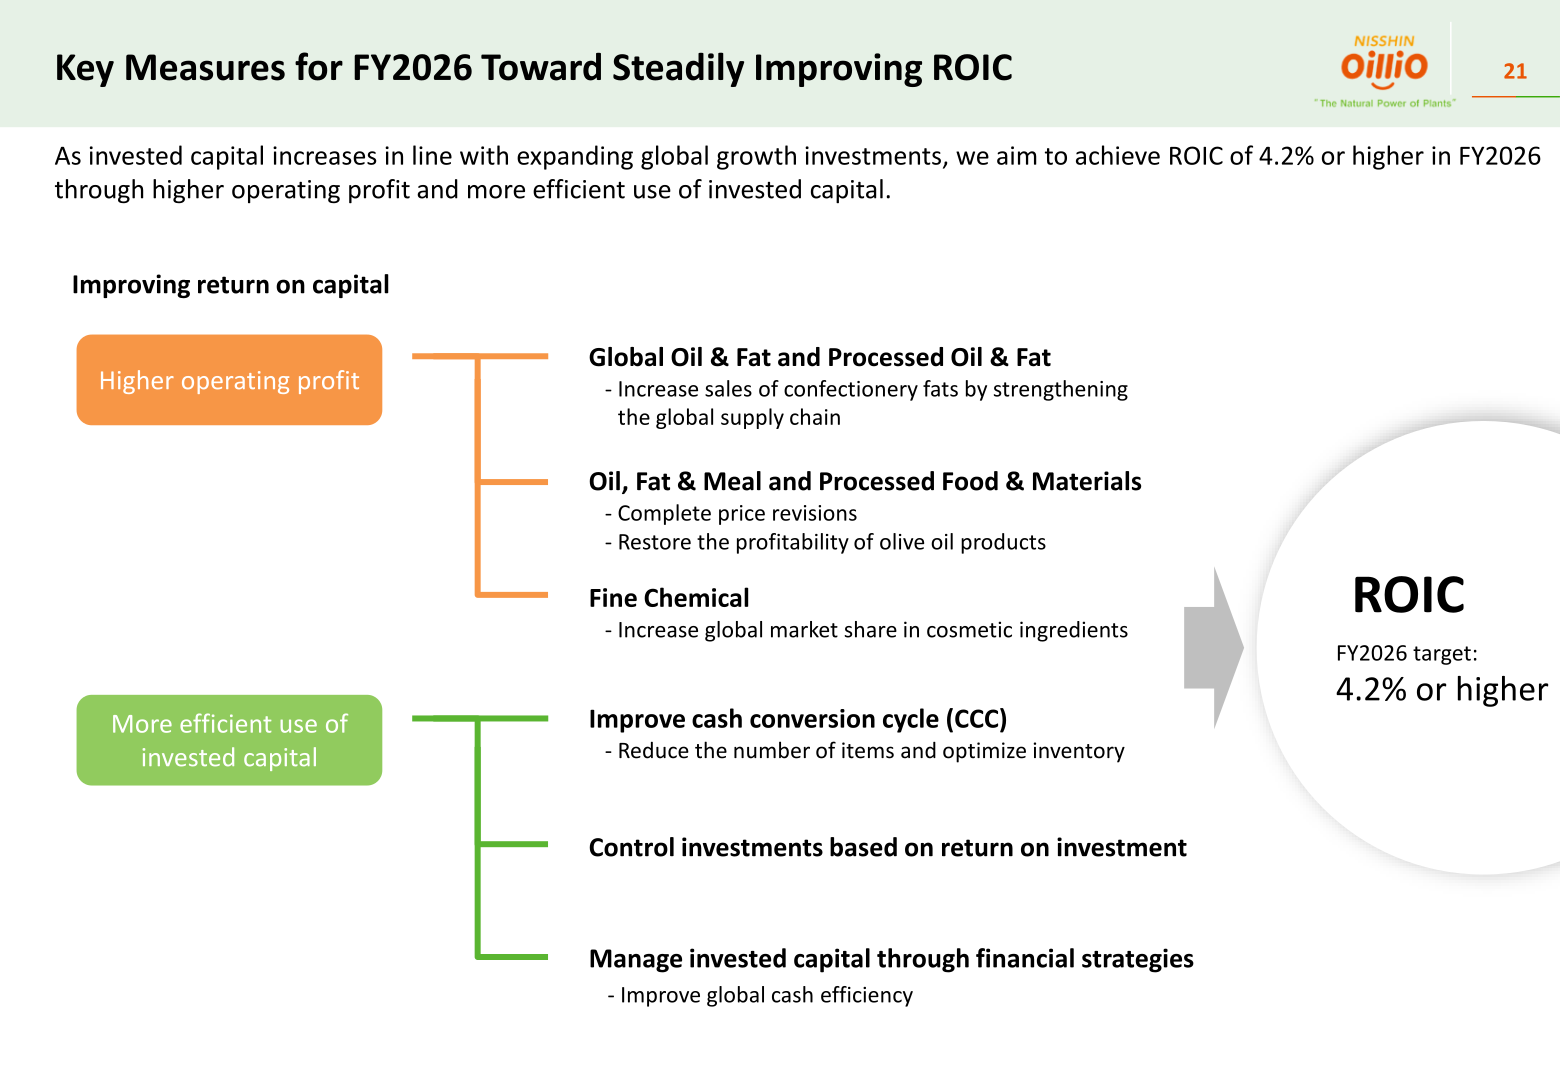
Under Value UpX the company has set performance targets of ROE of 8.0% or higher and ROIC of 6.0% or higher. For FY2026 it targets groupwide ROIC of 4.2% or higher, to be achieved through higher operating profit and more efficient use of invested capital, including improving the cash conversion cycle, reducing the number of items and optimizing inventory, improving global cash efficiency, and controlling investments based on return on investment. Segment ROIC targets for FY2026 are 6.8% for Global Oil & Fat and Processed Oil & Fat (6.1% in FY2025), 3.5% for Oil, Fat & Meal and Processed Food & Materials (4.3%) and 11.0% for Fine Chemical (10.0%).
The presentation also addresses the impact of the Middle East situation, which the company says could affect costs, procurement and market trends. It estimates the impact of increased energy and packaging/materials costs in the first half at approximately 2.0–3.0 billion yen, and notes that higher oil & fat costs and related impacts, together with price revisions effective from June 2026, have been incorporated into the first-half plan. Given the high degree of uncertainty, the impact of the Middle East situation and related factors has not been incorporated into the second-half plan.
The briefing materials do not include information on dividends or share buybacks, so shareholder returns cannot be confirmed from the materials.
This article is an analysis based on publicly available information and is not a recommendation to buy or sell any specific securities. Investment decisions are your own responsibility.
















