
This article is based on publicly available IR materials and is not a recommendation to buy or sell any specific securities.
Note: SBS Holdings closes its books in December. The company labels the fiscal year ended December 31, 2025 as “FY12/25” (shown as “FY2025” on some slides) and the fiscal year ending December 31, 2026 as “FY12/26”; the labels in the text and tables below follow the presentation. In FY12/25 net sales rose 9.4% year on year to 490,344 million yen and operating income rose 20.3% to 21,295 million yen, with net sales and profit attributable to owners of the parent both reaching record highs. ROE improved to 12.7% (+1.3pp) and the annual dividend was raised to 90 yen, 5 yen above the initial forecast of 85 yen. For FY12/26 the company forecasts net sales of 560,000 million yen and operating income of 24,000 million yen, and it has launched a new five-year medium-term management plan, “Harmonized Growth 2030.”
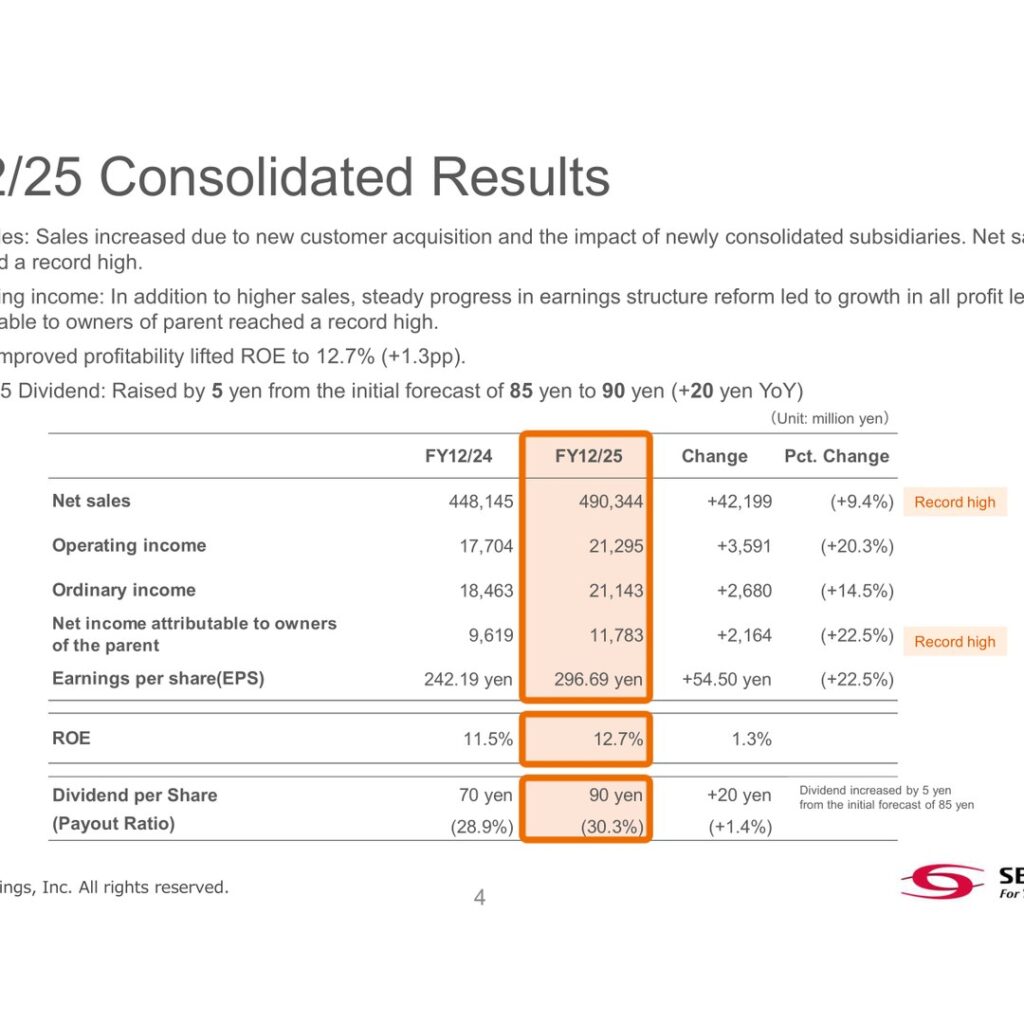
Consolidated Results (FY12/25 Actual)
Net sales increased on new customer acquisition and the impact of newly consolidated subsidiaries, reaching a record high. In addition to higher sales, steady progress in earnings structure reform lifted profit at all levels, and profit attributable to owners of the parent also reached a record high. Improved profitability lifted ROE to 12.7% (+1.3pp). The FY12/25 dividend was raised by 5 yen from the initial forecast of 85 yen to 90 yen (+20 yen year on year).
| Item (Unit: million yen) | FY12/24 | FY12/25 | Change | Pct. Change |
|---|---|---|---|---|
| Net sales | 448,145 | 490,344 | +42,199 | (+9.4%) |
| Operating income | 17,704 | 21,295 | +3,591 | (+20.3%) |
| Ordinary income | 18,463 | 21,143 | +2,680 | (+14.5%) |
| Net income attributable to owners of the parent | 9,619 | 11,783 | +2,164 | (+22.5%) |
| Earnings per share (EPS) | 242.19 yen | 296.69 yen | +54.50 yen | (+22.5%) |
| ROE | 11.5% | 12.7% | 1.3% | - |
| Dividend per share | 70 yen | 90 yen | +20 yen | - |
| (Payout ratio) | (28.9%) | (30.3%) | (+1.4%) | - |
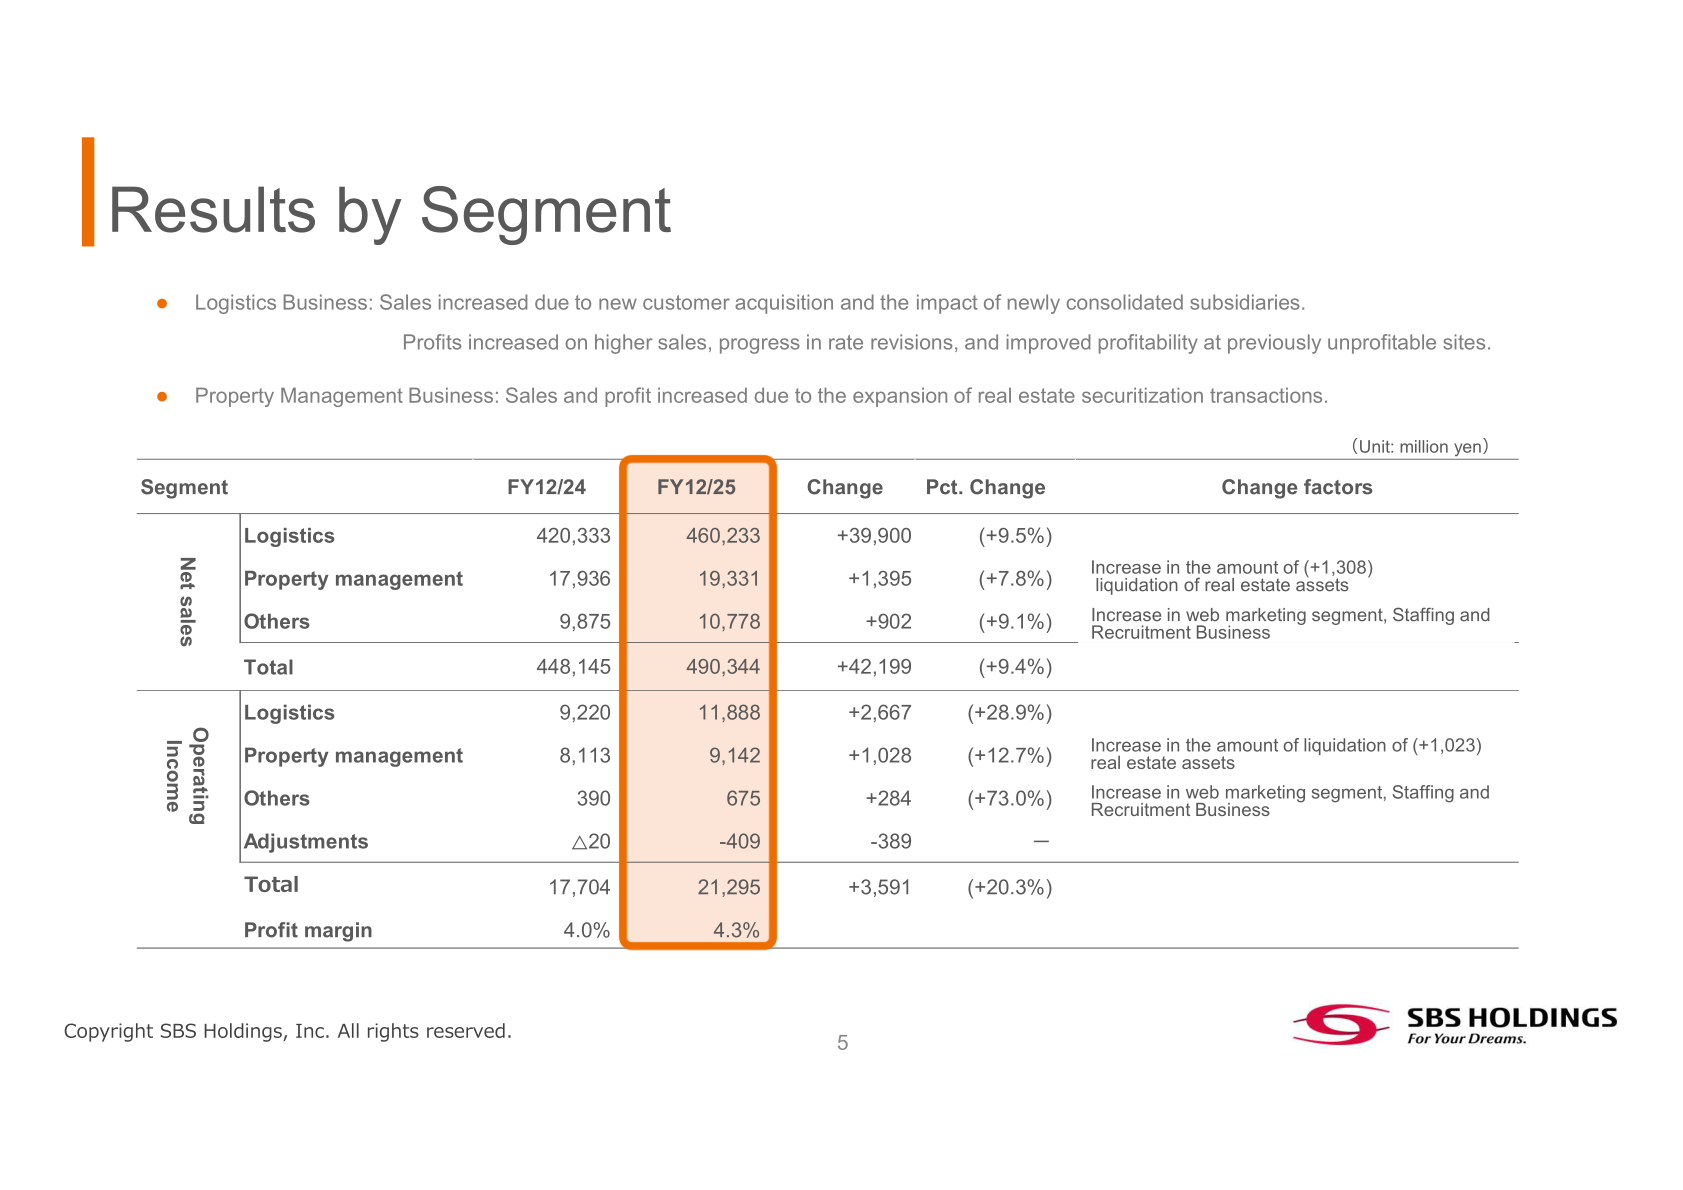
Segment Results
In the Logistics Business, sales increased due to new customer acquisition and the impact of newly consolidated subsidiaries, and profits increased on higher sales, progress in rate revisions, and improved profitability at previously unprofitable sites. In the Property Management Business, sales and profit increased due to the expansion of real estate securitization transactions; the increase in the amount of liquidation of real estate assets contributed +1,308 million yen to net sales and +1,023 million yen to operating income. The consolidated operating profit margin rose to 4.3% from 4.0%.
| Metric / Segment (Unit: million yen) | FY12/24 | FY12/25 | Change | Pct. Change |
|---|---|---|---|---|
| Net sales — Logistics | 420,333 | 460,233 | +39,900 | (+9.5%) |
| Net sales — Property management | 17,936 | 19,331 | +1,395 | (+7.8%) |
| Net sales — Others | 9,875 | 10,778 | +902 | (+9.1%) |
| Net sales — Total | 448,145 | 490,344 | +42,199 | (+9.4%) |
| Operating income — Logistics | 9,220 | 11,888 | +2,667 | (+28.9%) |
| Operating income — Property management | 8,113 | 9,142 | +1,028 | (+12.7%) |
| Operating income — Others | 390 | 675 | +284 | (+73.0%) |
| Operating income — Adjustments | △20 | -409 | -389 | - |
| Operating income — Total | 17,704 | 21,295 | +3,591 | (+20.3%) |
| Profit margin | 4.0% | 4.3% | - | - |
Performance by Major Group Companies
Figures below are on an internal management basis, and figures for the SBS Logicom group exclude real estate liquidation figures. At SBS Toshiba Logistics, sales and profit increased due to higher shipment volumes in home appliances, medical equipment and energy-related fields, as well as improved profitability at sites launched in the previous year and progress in rate optimization. At SBS NEXTHIRD, although sales increased on new customer acquisition and steady office supply demand, profits declined due to lower shipment volumes and upfront costs for new site openings. At SBS Logicom, sales increased on new site openings and higher shipment volumes from existing customers, while profits declined due to rising warehouse vacancy space and startup costs for new sites.
| Company / Metric (Unit: million yen) | FY12/24 | FY12/25 | Change | Pct. Change |
|---|---|---|---|---|
| SBS TOSHIBA Logistics group — Net sales | 117,672 | 126,201 | +8,528 | (+7.2%) |
| SBS TOSHIBA Logistics group — Operating income | 3,547 | 5,132 | +1,585 | (+44.7%) |
| SBS Ricoh Logistics group — Net sales | 104,375 | 107,867 | +3,491 | (+3.3%) |
| SBS Ricoh Logistics group — Operating income | 3,348 | 3,088 | -259 | (-7.8%) |
| SBS Logicom group — Net sales | 74,800 | 77,365 | +2,565 | (+3.4%) |
| SBS Logicom group — Operating income | 5,837 | 5,591 | -246 | (-4.2%) |
| Total of 3 companies — Net sales | 296,848 | 311,434 | +14,586 | (+4.9%) |
| Total of 3 companies — Operating income | 12,732 | 13,811 | +1,079 | (+8.5%) |
| Other total — Net sales | 151,297 | 178,909 | +27,612 | (+18.3%) |
| Other total — Operating income | 4,971 | 7,484 | +2,512 | (+50.5%) |
Structural Reform of the Logistics Business
Losses at newly opened business locations amounted to 1,928 million yen in FY12/25, down 222 million yen (10%) from 2,150 million yen in FY12/24, although the result was below the plan of 970 million yen. The breakdown was 1,544 million yen for bases opened in 2024 and 384 million yen for bases opened in 2025. Profitability improvement across unprofitable sites totaled +1,794 million yen in FY12/25. Vacant warehouse space stood at 20,964 tsubo at end-FY2025 against 25,500 tsubo at end-FY2024, a decline of 18%; the company targets a vacancy rate below 1% by the end of FY2026. On cash flow, operating CF expanded to 25.1 billion yen, supported by investment recovery from the securitization of logistics facilities such as the Noda Seto Logistics Center (19.5 billion yen), while the company continued proactive investment totaling 37.8 billion yen in 2025, including M&A investments and warehouse investment in Tomisato.
FY12/26 Forecast
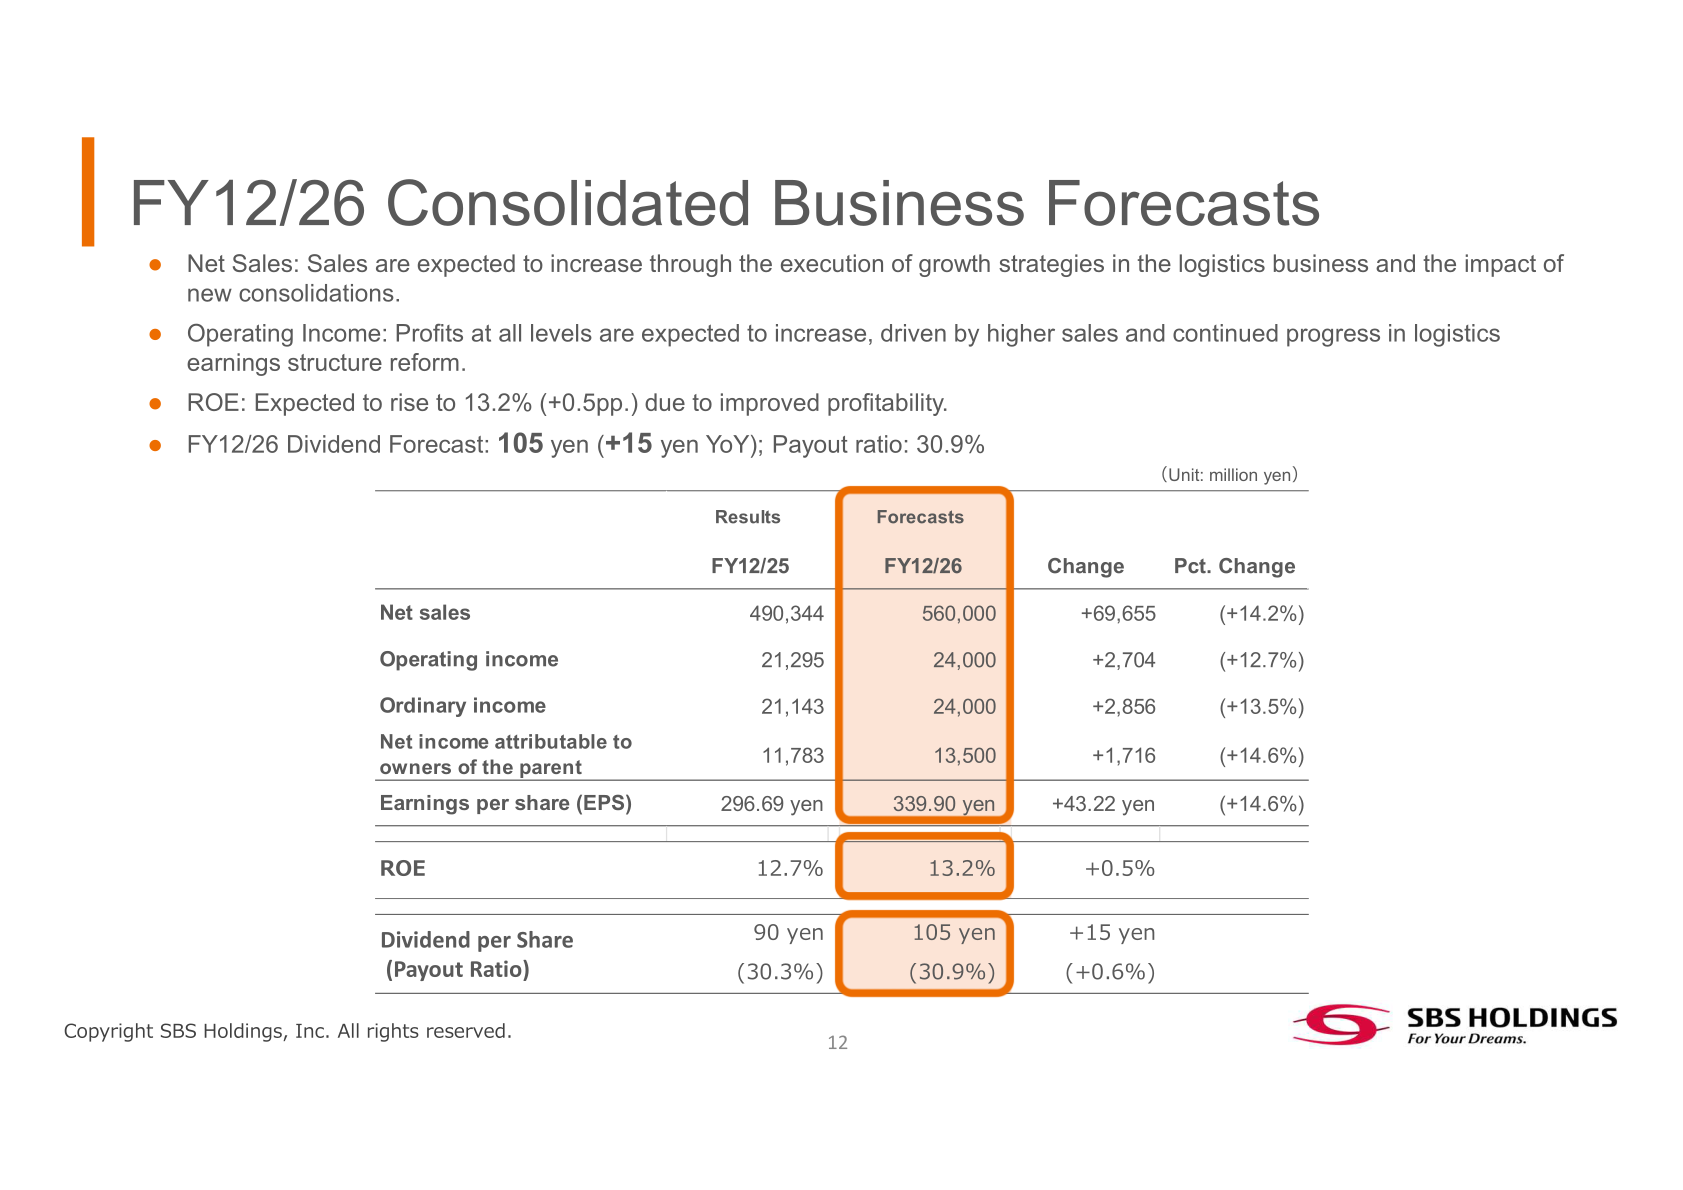
Sales are expected to increase through the execution of growth strategies in the Logistics Business and the impact of new consolidations, and profits at all levels are expected to increase, driven by higher sales and continued progress in logistics earnings structure reform. ROE is expected to rise to 13.2% (+0.5pp). In the Logistics Business, the forecast reflects growth strategies in 3PL, international logistics and EC operations, as well as the consolidation of Bridgestone Logistics (planned sales: 55.0 billion yen). In the Property Management Business, the company plans real estate securitization at a similar scale to the previous year and expects sales and operating income to remain at roughly the same level.
| Item (Unit: million yen) | FY12/25 | FY12/26 Forecast | Change | Pct. Change |
|---|---|---|---|---|
| Net sales | 490,344 | 560,000 | +69,655 | (+14.2%) |
| Operating income | 21,295 | 24,000 | +2,704 | (+12.7%) |
| Ordinary income | 21,143 | 24,000 | +2,856 | (+13.5%) |
| Net income attributable to owners of the parent | 11,783 | 13,500 | +1,716 | (+14.6%) |
| Earnings per share (EPS) | 296.69 yen | 339.90 yen | +43.22 yen | (+14.6%) |
| ROE | 12.7% | 13.2% | +0.5% | - |
| Dividend per share | 90 yen | 105 yen | +15 yen | - |
| (Payout ratio) | (30.3%) | (30.9%) | (+0.6%) | - |
| Metric / Segment (Unit: million yen) | FY2025 Actual | FY2026 Forecast | Change | Pct. Change |
|---|---|---|---|---|
| Net sales — Logistics | 460,233 | 527,000 | +66,766 | (+14.5%) |
| Net sales — Property Management | 19,331 | 20,000 | +668 | (+3.5%) |
| Net sales — Others | 10,778 | 13,000 | +2,221 | (+20.6%) |
| Net sales — Total | 490,344 | 560,000 | +69,655 | (+14.2%) |
| Operating income — Logistics | 11,888 | 14,700 | +2,811 | (+23.7%) |
| Operating income — Property Management | 9,142 | 9,000 | -142 | (-1.6%) |
| Operating income — Others | 675 | 700 | +24 | (+3.7%) |
| Operating income — Adjusted amount | -409 | -400 | +9 | - |
| Operating income — Total | 21,295 | 24,000 | +2,704 | (+12.7%) |
| Profit margin | 4.3% | 4.3% | - | - |
Shareholder Returns
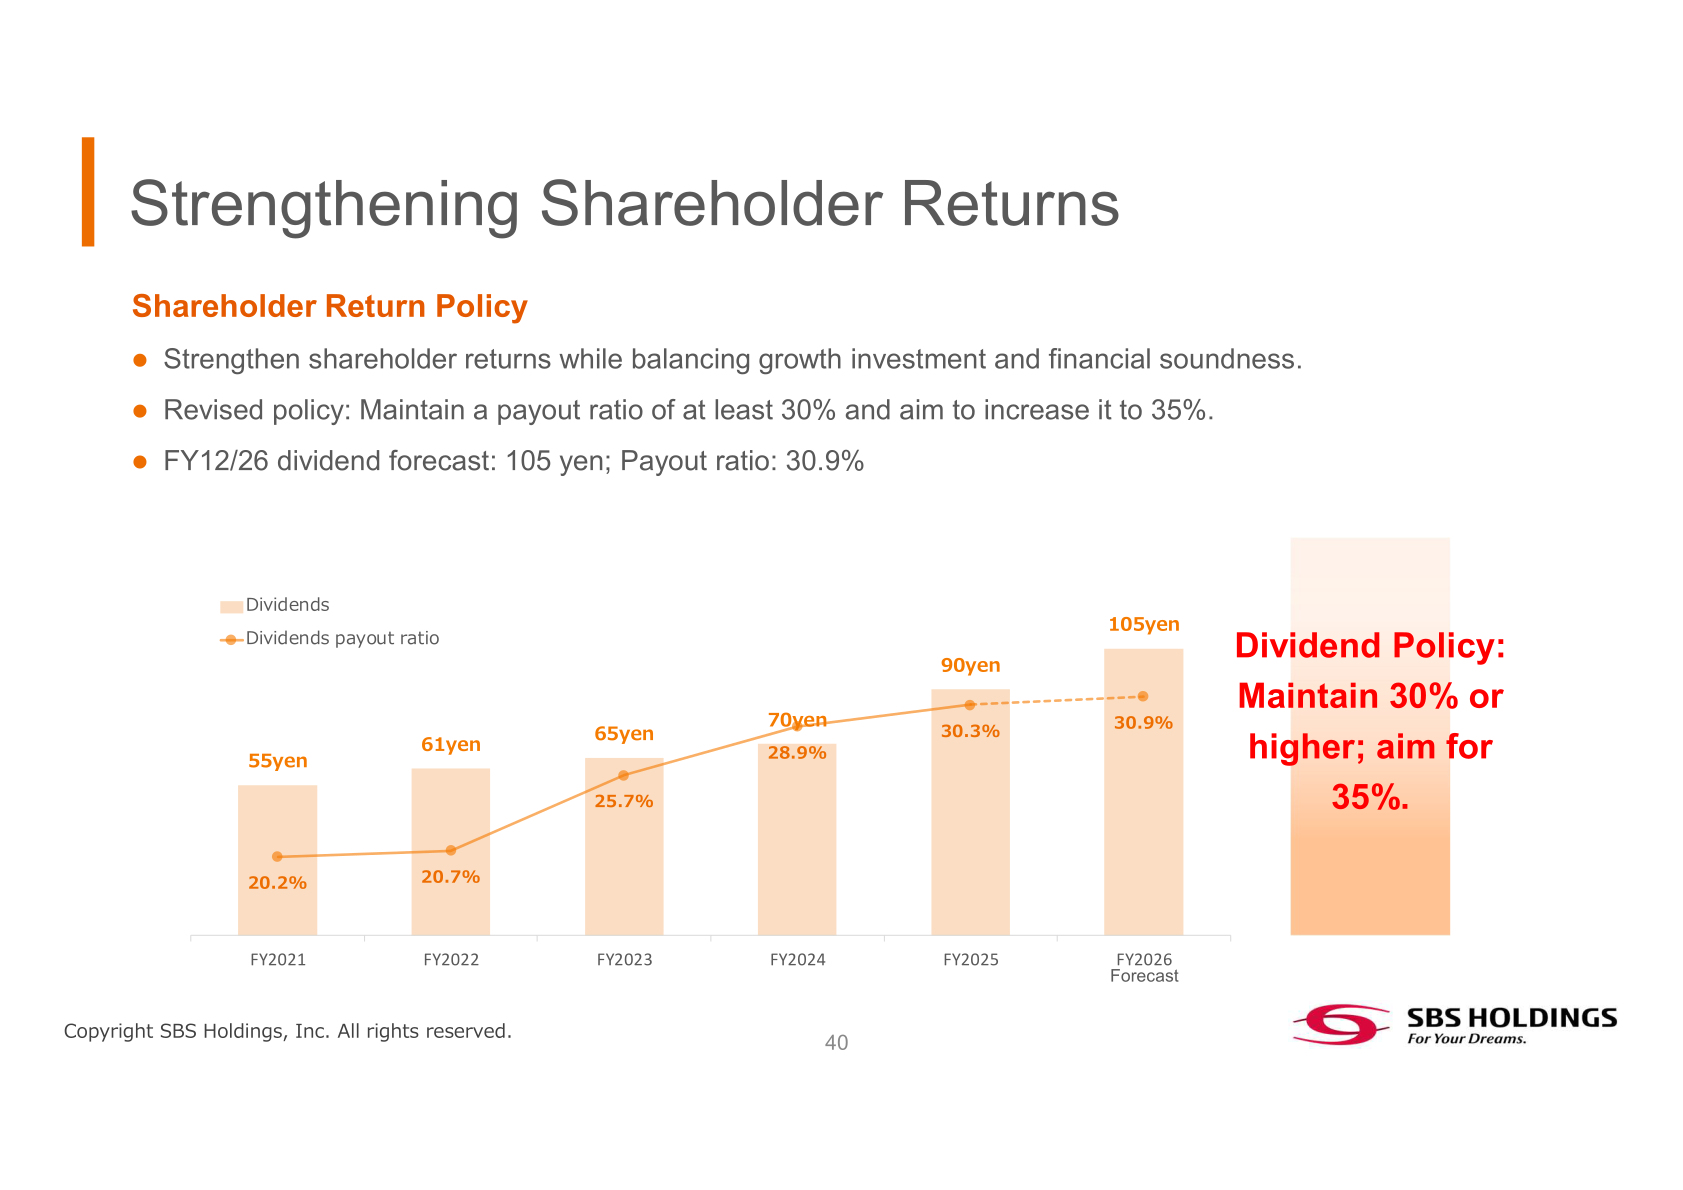
The company aims to strengthen shareholder returns while balancing growth investment and financial soundness. Under its revised policy, it will maintain a payout ratio of at least 30% and aim to increase it to 35%. The FY12/26 dividend forecast is 105 yen with a payout ratio of 30.9%. Annual dividends per share have risen from 55 yen in FY2021 to 61 yen in FY2022, 65 yen in FY2023, 70 yen in FY2024 and 90 yen in FY2025, with payout ratios of 20.2%, 20.7%, 25.7%, 28.9% and 30.3% respectively.
Medium-Term Management Plan “Harmonized Growth 2030”
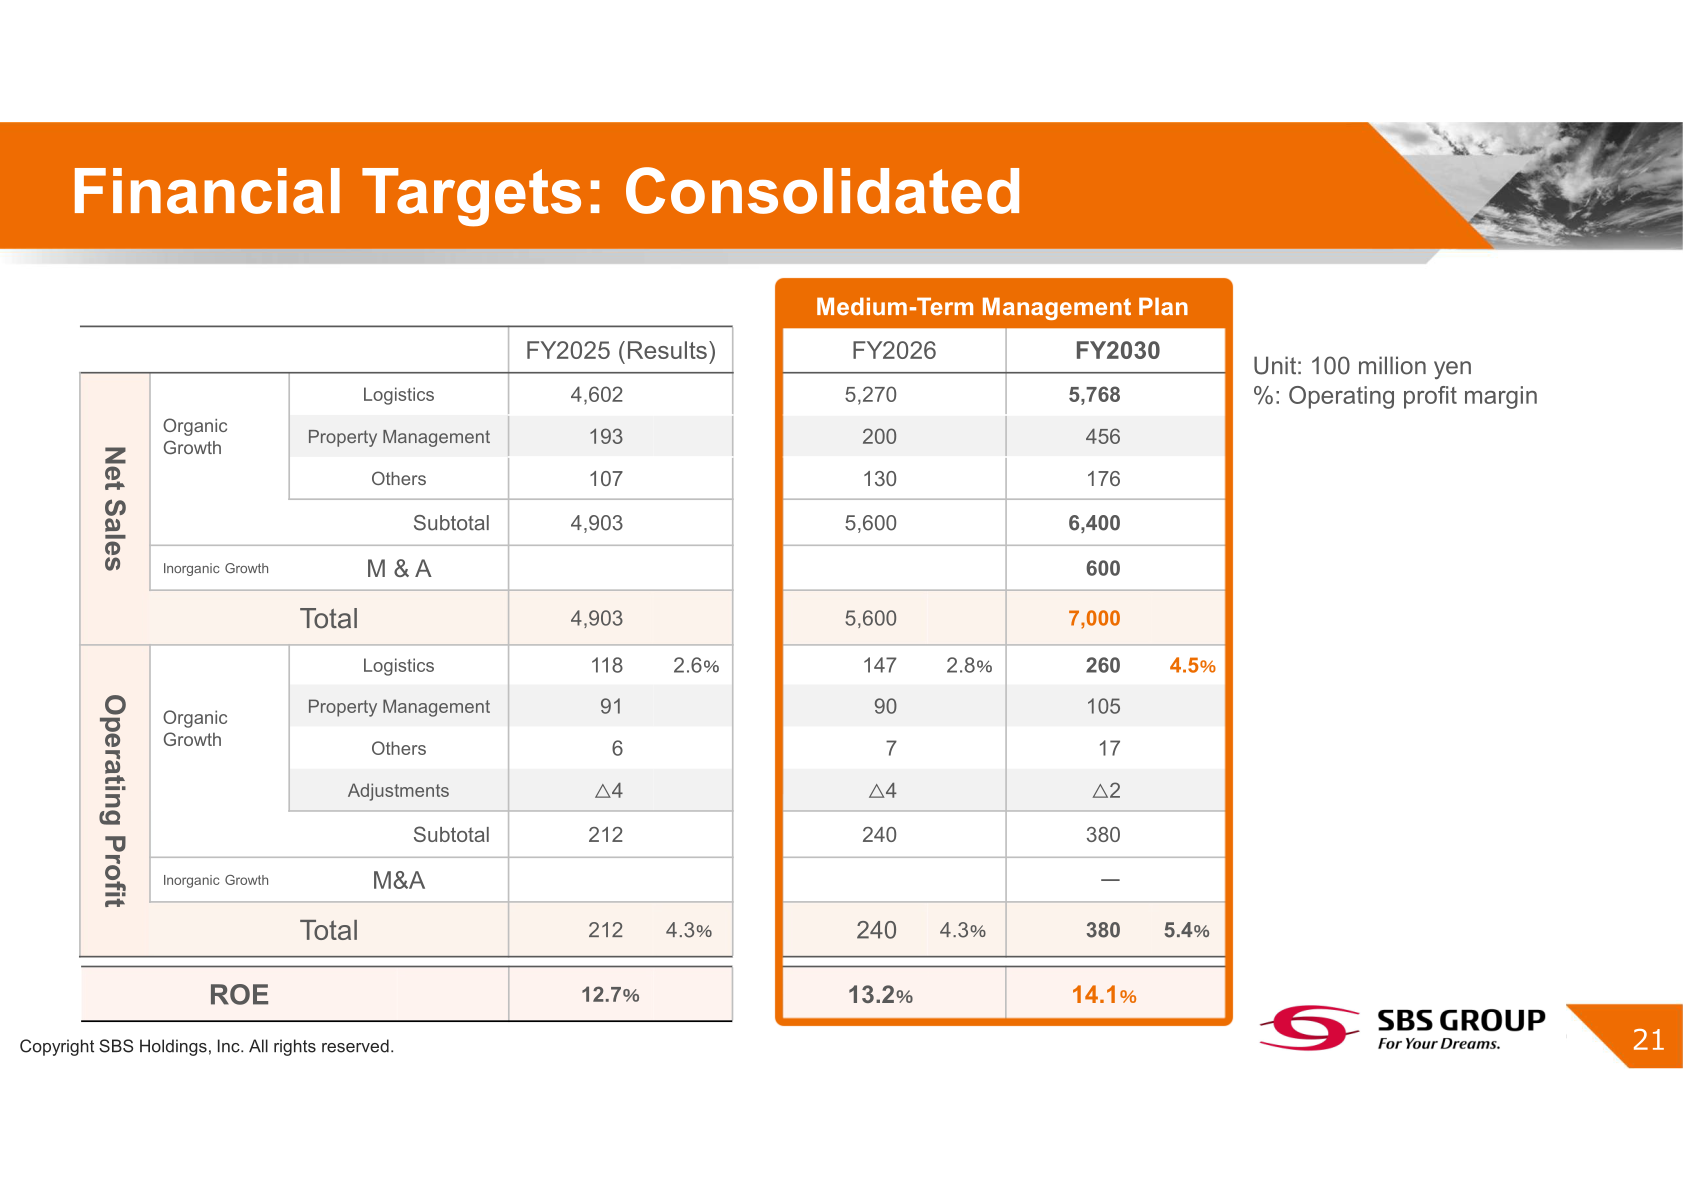
The SBS Group has launched a new five-year medium-term management plan covering FY2026 to FY2030, “Harmonized Growth 2030.” The basic policy is to achieve growth by combining organic growth in the Logistics Business (3PL, international logistics and EC logistics) and real estate development with inorganic growth through M&A targeting companies with unique competitive advantages, while promoting structural reforms to improve the operating profit margin of the Logistics Business. The plan targets consolidated sales of 700 billion yen and a Logistics Business operating profit margin of 4.5%. Structural reforms are to be driven by a PDCA cycle based on four KPIs: elimination of unprofitable locations and businesses, reduction of vacant warehouse space, optimization of workforce composition, and strengthening initiatives to ensure appropriate pricing.
| Item (Unit: 100 million yen) | FY2025 (Results) | FY2026 | FY2030 |
|---|---|---|---|
| Net sales — Logistics (organic growth) | 4,602 | 5,270 | 5,768 |
| Net sales — Property Management | 193 | 200 | 456 |
| Net sales — Others | 107 | 130 | 176 |
| Net sales — Subtotal | 4,903 | 5,600 | 6,400 |
| Net sales — M&A (inorganic growth) | - | - | 600 |
| Net sales — Total | 4,903 | 5,600 | 7,000 |
| Operating profit — Logistics (organic growth) | 118 (2.6%) | 147 (2.8%) | 260 (4.5%) |
| Operating profit — Property Management | 91 | 90 | 105 |
| Operating profit — Others | 6 | 7 | 17 |
| Operating profit — Adjustments | △4 | △4 | △2 |
| Operating profit — Subtotal | 212 | 240 | 380 |
| Operating profit — Total | 212 (4.3%) | 240 (4.3%) | 380 (5.4%) |
| ROE | 12.7% | 13.2% | 14.1% |
Initiatives to Enhance Corporate Value
ROE exceeds the cost of shareholders’ equity, securing a high equity spread, and ROIC continues to exceed WACC. WACC is stated at approximately 3.5-4.0% and the cost of equity at approximately 6.0-6.8% on a CAPM basis. ROIC was 6.6% in 2025 against 5.8% in 2024. In FY12/25, improvements in ROE and PER led to a higher PBR: PER improved to 12.7x and PBR to 1.6x, with ROE at 12.7%. The company targets a stable ROE level of 12-14%+, a PER of approximately 15x in line with the industry average, and a PBR of 1.6x-2.0x. On the balance sheet, the equity ratio was 27.9% at FY2025 with financial leverage of 3.6x and a net debt/equity ratio of 0.9x; for FY2026-FY2030 the company assumes an equity ratio of 25%-33%, financial leverage of 3x-4x and a net debt/equity ratio of 0.8x-1.2x.
On capital allocation, cumulative FY2021-FY2025 actual cash in comprised operating CF of 900 and liquidation of real estate assets of 750 (unit: 100 million yen), with cash out of strategic investment 1,050 (M&A investment 300 and real estate investment 750), LT/IT and equipment renewal 500, and dividends 110. For the medium-term plan period FY2026-FY2030, cash in is planned at operating CF of 1,400-1,500, liquidation of real estate assets of 1,300-1,400 and interest-bearing debt procurement of 200-400, with cash out of strategic investment 1,900-2,200, LT/IT and equipment renewal 750-800, and dividends 220-240.
Progress on Key Initiatives
Bridgestone Logistics Co., Ltd. was acquired in October 2025 and is included in consolidated results from January 2026. Established in 1995 as a logistics company of the Bridgestone Group, it derives approximately 95% of sales from the Bridgestone Group and operates around 180 warehouse locations in Japan, handling the distribution and import/export of tires, raw materials and related products. A relocation to the SBS Holdings headquarters and a corporate name change are planned during FY2026. Blackbird Logistics was acquired in April 2025 and included in consolidated results from July 2025; it is a holding company overseeing 3PL businesses centered on De Zwaluw Logistiek B.V., which was founded in 1948, and operates four ambient warehouses and one hazardous materials warehouse with approximately 65 trucks and approximately 120 trailers/chassis, participating in a logistics network with over 600 vehicles operating in the Benelux region.
In logistics facility development, 35% of Noda-Seto A was transferred in September 2025 and 40% in January 2026, with the remaining 25% scheduled for transfer in January 2027. Under construction are Tomisato (Chiba), scheduled for completion in August 2026 with a leasing area of 100,473 square meters (30,392 tsubo) for use as a 3PL facility for the SBS Group, and Kirishima (Kagoshima), scheduled for completion in March 2026 with a leasing area of 5,920 square meters (1,790 tsubo) as a dedicated logistics center for SBS NEXTHIRD customers. Noda-Seto B & C (Chiba) and Nasu (Tochigi) are planned, and land has been acquired in Tokorozawa (Saitama), Yokoshibahikari (Chiba), Kasumigaura (Ibaraki) and Chikushino (Fukuoka), among others.
This article is an analysis based on publicly available information and is not a recommendation to buy or sell any specific securities. Investment decisions are your own responsibility.
















