
This article is based on publicly available IR materials and is not a recommendation to buy or sell any specific securities.
Note on fiscal-year labels: Ichigo’s fiscal year ends in February, and Ichigo labels the year ended February 28, 2026 as “FY26/2”; this site classifies that most recently completed fiscal year as FY2025, and all labels in the text, tables, and segment data below are kept exactly as they appear in Ichigo’s materials.
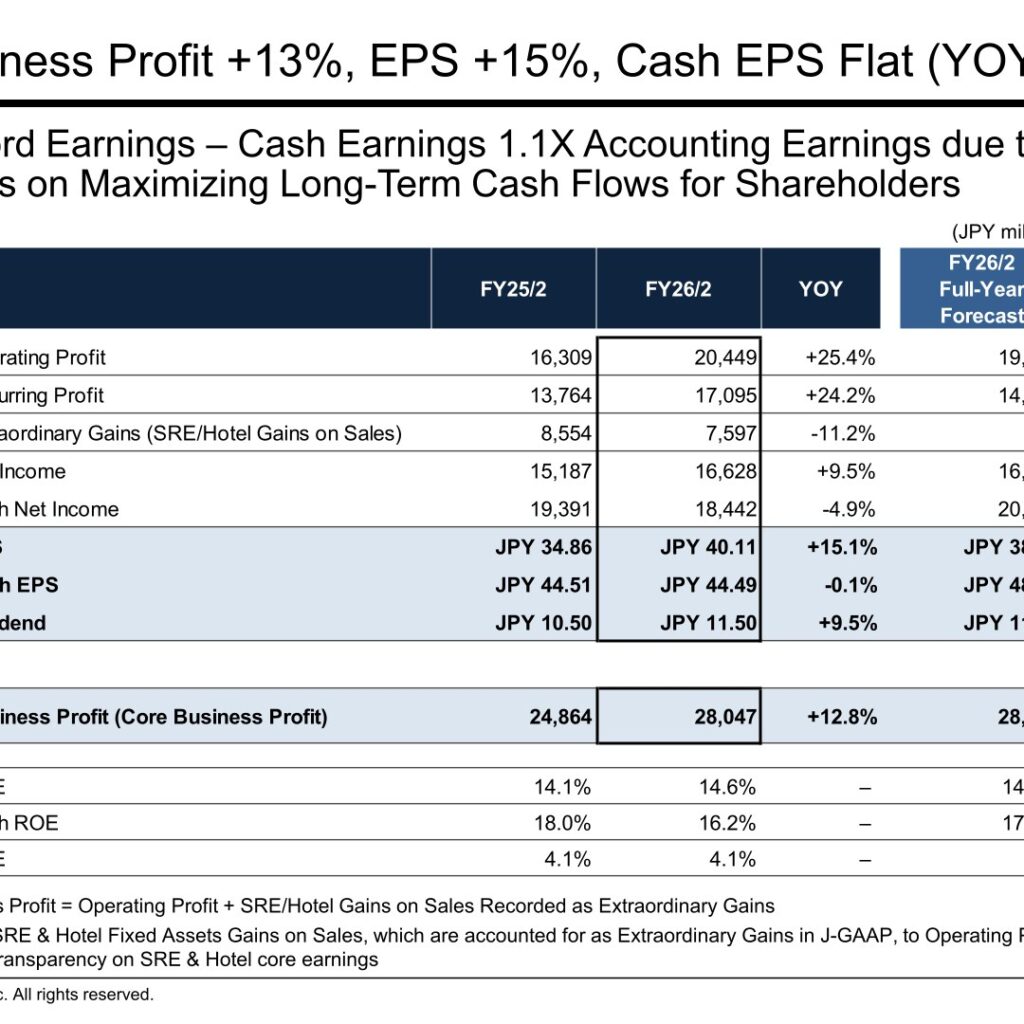
Ichigo Inc. reported record FY26/2 earnings, with business profit rising 12.8% year-on-year to JPY 28,047 million and net income rising 9.5% to JPY 16,628 million. Operating profit increased 25.4% to JPY 20,449 million and recurring profit increased 24.2% to JPY 17,095 million, while cash net income declined 4.9% to JPY 18,442 million. Ichigo describes FY26/2 as delivering record business profit, net income, cash earnings, and stock earnings. For FY27/2 Ichigo forecasts business profit of JPY 34,000 million (+21.2%) and has raised its Dividend on Equity (DOE) target from over 4% to over 5%, guiding to a dividend of JPY 15.50 per share.
Consolidated Results (Full-Year Actual)
Ichigo uses business profit, which it defines as operating profit plus SRE and Hotel gains on sales that are recorded as extraordinary gains under J-GAAP, as its core earnings measure. Ichigo explains that adding these gains to operating profit provides greater transparency on SRE and Hotel core earnings. Cash net income is defined as net income plus non-cash expenses such as depreciation and goodwill amortization. Revenue for FY26/2 was JPY 92,705 million, an increase of JPY 9,129 million versus FY25/2, and gross profit was JPY 30,119 million (+JPY 4,595 million). Ichigo notes that business profit came in at 98.8% of its FY26/2 full-year forecast, while operating profit reached 104.9% and recurring profit 115.5% of forecast.
| Item (JPY million) | FY25/2 | FY26/2 | YOY | FY26/2 Full-Year Forecast |
|---|---|---|---|---|
| Operating Profit | 16,309 | 20,449 | +25.4% | 19,500 |
| Recurring Profit | 13,764 | 17,095 | +24.2% | 14,800 |
| Extraordinary Gains (SRE/Hotel Gains on Sales) | 8,554 | 7,597 | -11.2% | – |
| Net Income | 15,187 | 16,628 | +9.5% | 16,000 |
| Cash Net Income | 19,391 | 18,442 | -4.9% | 20,500 |
| Business Profit (Core Business Profit) | 24,864 | 28,047 | +12.8% | 28,400 |
| EPS | JPY 34.86 | JPY 40.11 | +15.1% | JPY 38.13 |
| Cash EPS | JPY 44.51 | JPY 44.49 | -0.1% | JPY 48.85 |
| Dividend | JPY 10.50 | JPY 11.50 | +9.5% | JPY 11.50 |
| ROE | 14.1% | 14.6% | – | 14.0% |
| Cash ROE | 18.0% | 16.2% | – | 17.9% |
| DOE | 4.1% | 4.1% | – | – |
Segment Results
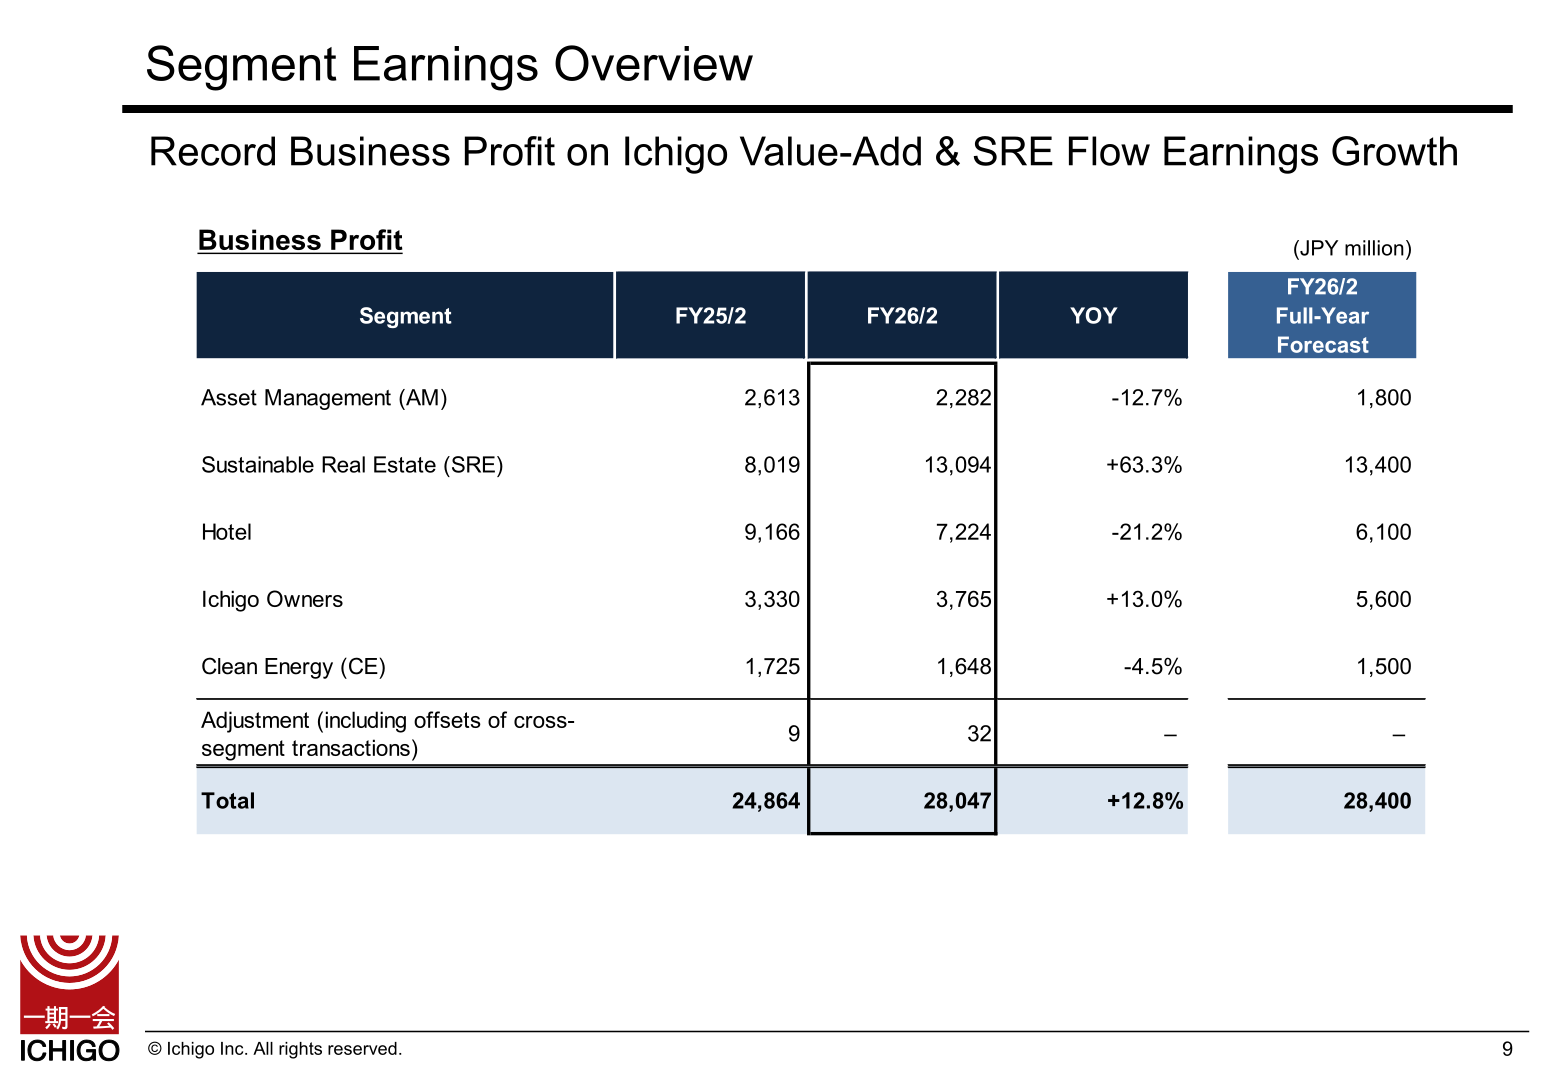
Sustainable Real Estate (SRE) was the main driver of the record result, with business profit up 63.3% year-on-year as SRE stock earnings rose 14.2% to JPY 9,025 million on increased office NOI from newly acquired assets, Tradepia Odaiba occupancy growth to 97%, and Ready to Move In office rental growth with an average rent increase of 66%. SRE flow earnings rose 73.9% to JPY 9,579 million. Ichigo Owners business profit rose 13.0% on stock earnings up 10.7% and flow earnings up 10.1%. Hotel business profit fell 21.2%: stock earnings rose 2.3% to JPY 7,150 million, but flow earnings fell 45.9% to JPY 2,635 million on the drop-off of large FY25/2 gains on sale. Asset Management business profit fell 12.7% despite stock earnings rising 5.4% to JPY 2,741 million, reflecting a 21.6% increase in SG&A from acquiring a private REIT asset management company. Clean Energy business profit fell 4.5% on higher operating costs.
| Segment — Business Profit (JPY million) | FY25/2 | FY26/2 | YOY | FY26/2 Full-Year Forecast |
|---|---|---|---|---|
| Asset Management (AM) | 2,613 | 2,282 | -12.7% | 1,800 |
| Sustainable Real Estate (SRE) | 8,019 | 13,094 | +63.3% | 13,400 |
| Hotel | 9,166 | 7,224 | -21.2% | 6,100 |
| Ichigo Owners | 3,330 | 3,765 | +13.0% | 5,600 |
| Clean Energy (CE) | 1,725 | 1,648 | -4.5% | 1,500 |
| Adjustment (including offsets of cross-segment transactions) | 9 | 32 | – | – |
| Total | 24,864 | 28,047 | +12.8% | 28,400 |
Stock and Flow Earnings
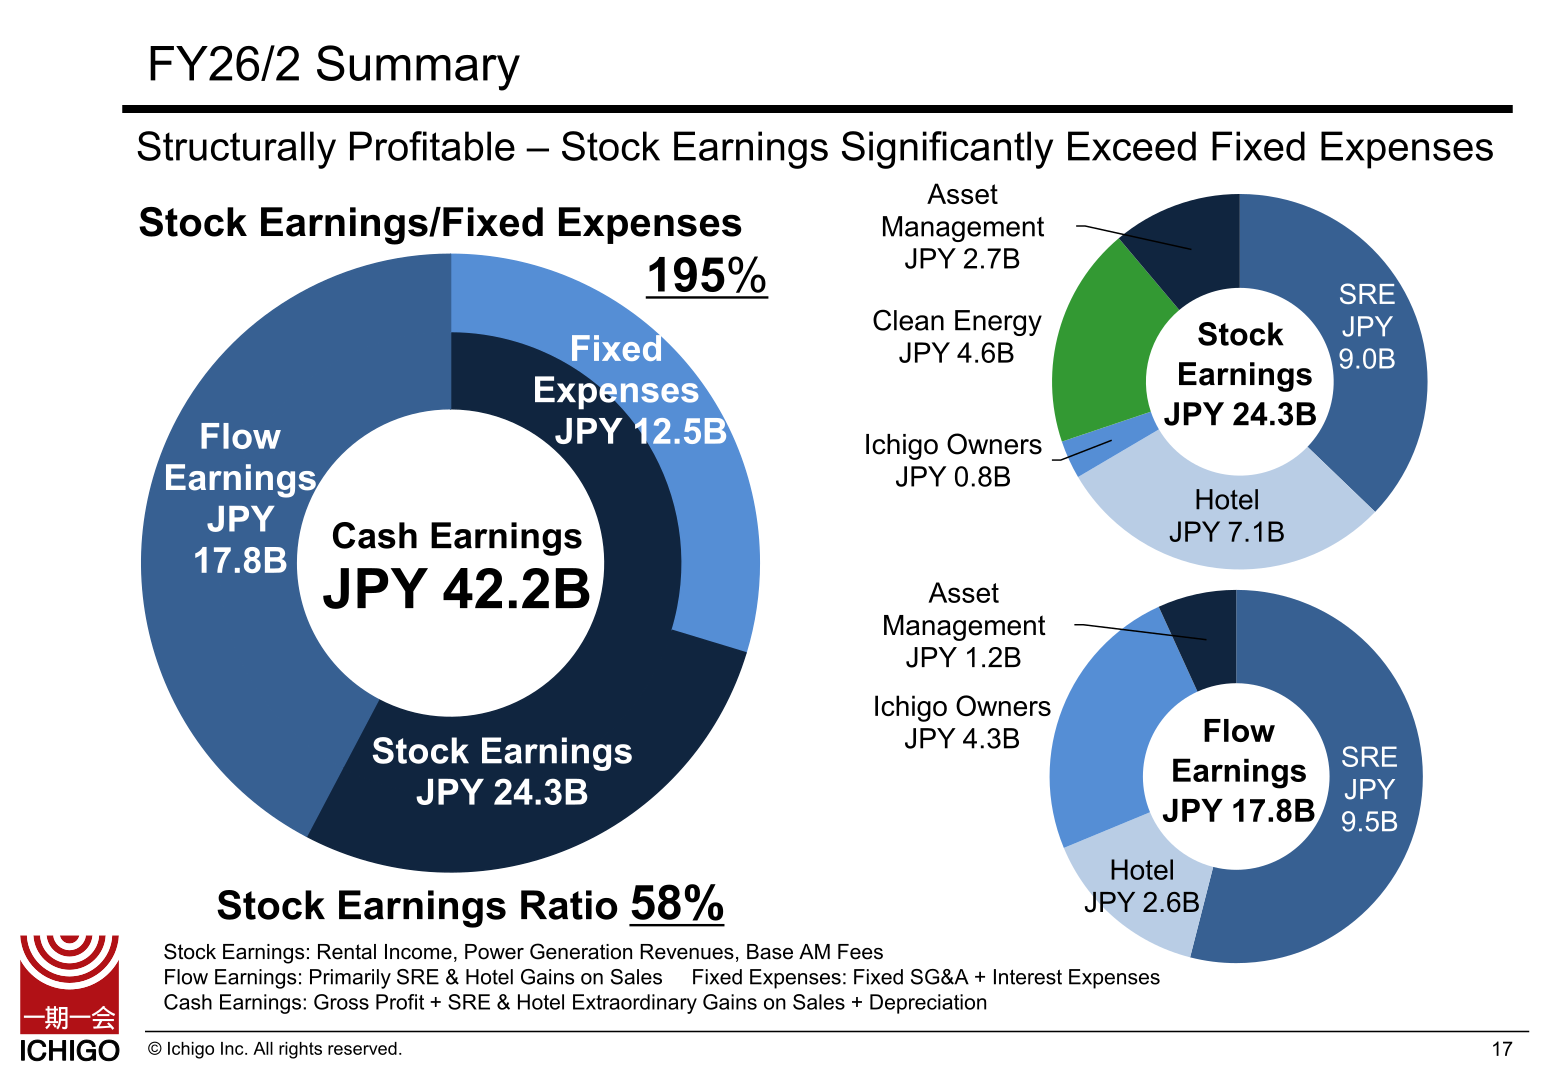
Ichigo defines stock earnings as rental income, power generation revenues, and base AM fees, and flow earnings as primarily SRE and Hotel gains on sales. In FY26/2 cash earnings reached JPY 42.2B, comprising stock earnings of JPY 24.3B and flow earnings of JPY 17.8B, for a stock earnings ratio of 58%. Against fixed expenses of JPY 12.5B, the stock earnings to fixed expenses coverage ratio was 195%. By segment, stock earnings were SRE JPY 9.0B, Hotel JPY 7.1B, Clean Energy JPY 4.6B, Asset Management JPY 2.7B, and Ichigo Owners JPY 0.8B; flow earnings were SRE JPY 9.5B, Ichigo Owners JPY 4.3B, Hotel JPY 2.6B, and Asset Management JPY 1.2B. Ichigo reports record cash earnings, up 9% year-on-year, and record stock earnings, up 6% year-on-year.
Acquisitions and Sales
FY26/2 acquisitions totaled JPY 79.5B (+5% year-on-year) across 47 assets, comprising SRE of 4 assets at JPY 10.7B (including 3 logistics assets at JPY 10.4B), Hotel of 3 hotels at JPY 20.6B plus 1 hotel ground lease at JPY 0.8B for a total of JPY 21.5B, and Ichigo Owners of 39 residential assets at JPY 47.1B. Sales totaled JPY 73.5B (+14% year-on-year) across 37 assets, comprising SRE of 9 assets at JPY 23.2B plus 2 other items at JPY 5.7B for a total of JPY 28.9B, Hotel of 1 hotel at JPY 6.7B, and Ichigo Owners of 25 residential assets at JPY 37.8B. Net acquisitions were JPY 5.9B, and the book value of sales was JPY 57.0B. Third-party appraisal value-based unrealized gains reached a record JPY 83.5B, up 13% year-on-year.
Next-Year Forecast (FY27/2)
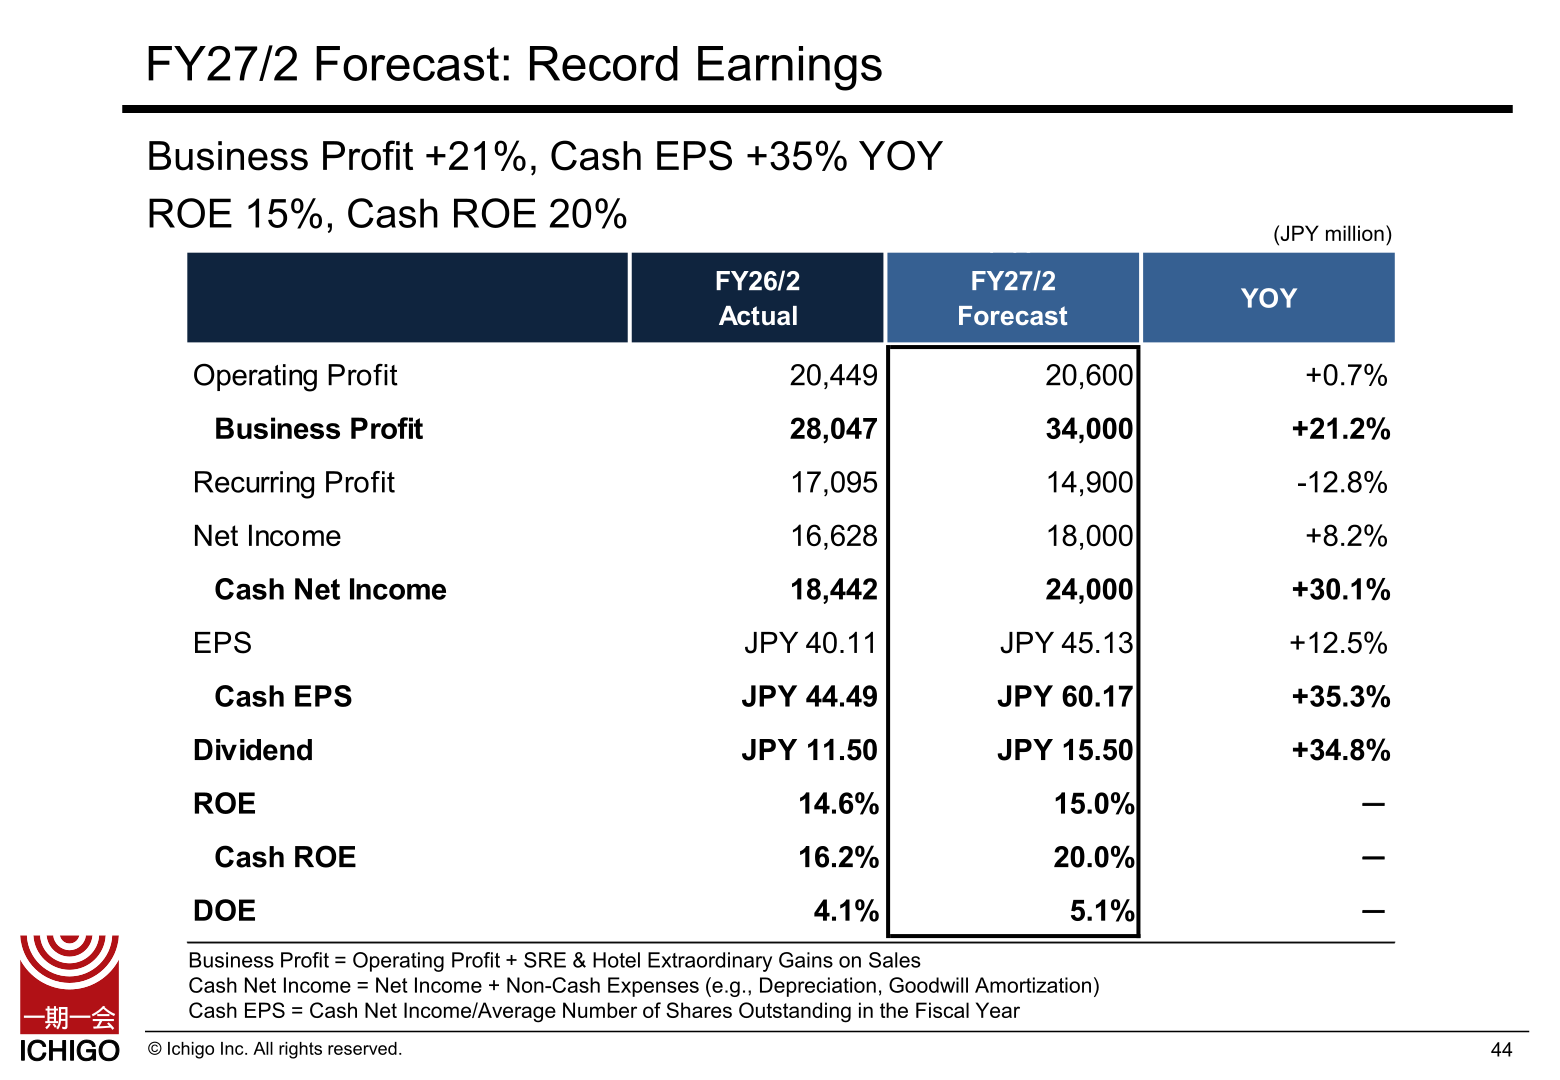
Ichigo forecasts record FY27/2 earnings, with business profit of JPY 34,000 million (+21.2%) and cash net income of JPY 24,000 million (+30.1%). Recurring profit is forecast to decline 12.8% to JPY 14,900 million. Ichigo attributes the business profit growth to flow earnings rising 35% year-on-year on strong SRE and Ichigo Owners earnings, while stock earnings are forecast to decline 2% year-on-year as SRE asset sales shrink the balance sheet and reduce NOI. By segment, SRE business profit is forecast up 41.7% on asset sales and a real estate subsidiary sale, and Ichigo Owners up 101.9% on higher sales including FY26/2 sales pushed out into FY27/2, while AM is forecast down 45.2% on excluding REIT AM performance fees from the forecast, Hotel down 28.7% on the drop-off of FY26/2 gains on sale flow earnings of JPY 2.6B, and Clean Energy down 12.0% on power suspensions and an SG&A increase.
| Item (JPY million) | FY26/2 Actual | FY27/2 Forecast | YOY |
|---|---|---|---|
| Operating Profit | 20,449 | 20,600 | +0.7% |
| Business Profit | 28,047 | 34,000 | +21.2% |
| Recurring Profit | 17,095 | 14,900 | -12.8% |
| Net Income | 16,628 | 18,000 | +8.2% |
| Cash Net Income | 18,442 | 24,000 | +30.1% |
| EPS | JPY 40.11 | JPY 45.13 | +12.5% |
| Cash EPS | JPY 44.49 | JPY 60.17 | +35.3% |
| Dividend | JPY 11.50 | JPY 15.50 | +34.8% |
| ROE | 14.6% | 15.0% | - |
| Cash ROE | 16.2% | 20.0% | - |
| DOE | 4.1% | 5.1% | - |
| Segment — Business Profit (JPY million) | FY26/2 Actual | FY27/2 Forecast | YOY |
|---|---|---|---|
| Asset Management (AM) | 2,282 | 1,250 | -45.2% |
| Sustainable Real Estate (SRE) | 13,094 | 18,550 | +41.7% |
| Hotel | 7,224 | 5,150 | -28.7% |
| Ichigo Owners | 3,765 | 7,600 | +101.9% |
| Clean Energy | 1,648 | 1,450 | -12.0% |
| Adjustments (Inter-Segment Transactions, etc.) | 32 | - | - |
| Total | 28,047 | 34,000 | +21.2% |
Shareholder Returns
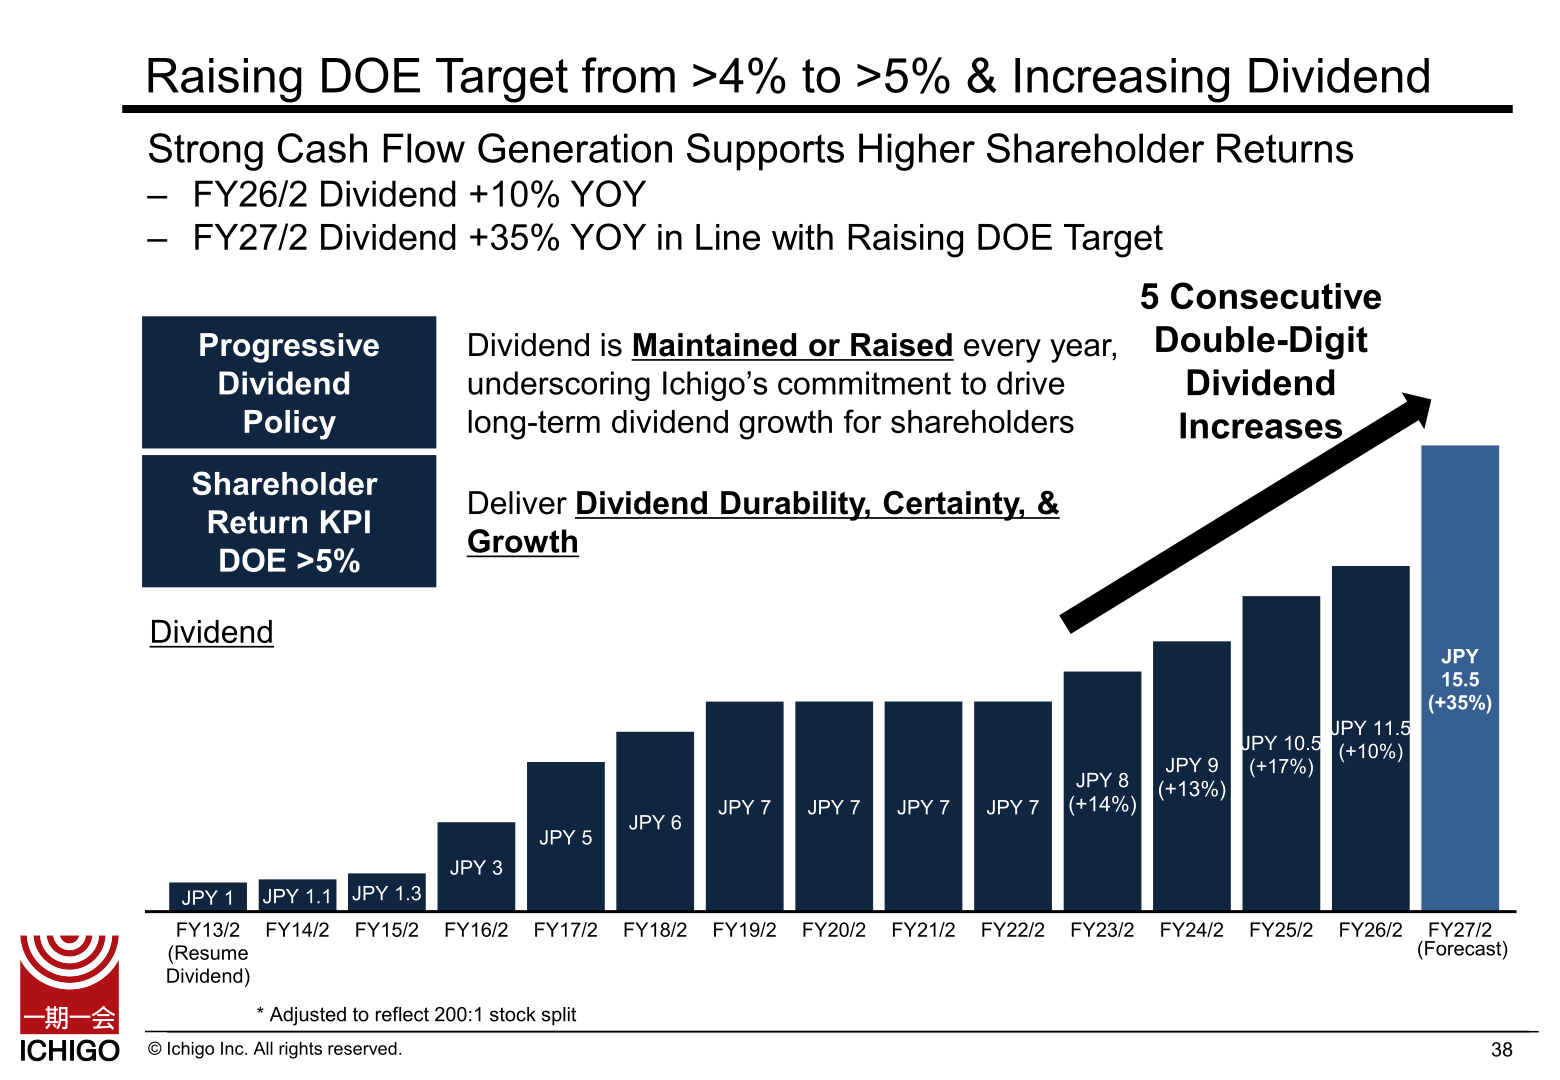
Ichigo conducted share buybacks for a ninth consecutive year, running a JPY 15B share buyback program in FY26/2 of which JPY 10B was executed, and cancelling 30 million shares, equal to 7% of shares outstanding. Cumulative share buybacks including the program in progress amount to JPY 43.3B. On dividends, Ichigo applies a progressive dividend policy under which the dividend is maintained or raised every year but not cut, and uses DOE as its shareholder return KPI. The FY26/2 dividend is JPY 11.50 (+10% year-on-year, DOE 4.1%), the fifth consecutive double-digit dividend increase. Having raised its DOE target to 4% from 3% in FY25/2, Ichigo has raised the DOE target again to over 5% from FY27/2 and forecasts a FY27/2 dividend of JPY 15.50, up 35% year-on-year, at a DOE of 5.1%.
| Item | FY25/2 | FY26/2 | FY27/2 (Forecast) |
|---|---|---|---|
| Dividend per Share | JPY 10.5 | JPY 11.5 | JPY 15.5 |
| Year-on-Year Change | +17% | +10% | +35% |
| DOE | 4.1% | 4.1% | 5.1% |
Medium-Term Plan and Topics
Under its Ichigo 2030 long-term vision, Ichigo is positioning itself as a sustainable infrastructure company and has set KPIs of ROE above 15%, cash ROE above 18%, economic operating cash flow exceeding net income, an FY30/2 stock earnings ratio above 60%, a stock earnings to fixed expenses ratio above 200%, and a shareholder return policy of DOE above 5% combined with flexible deployment of share buybacks and a progressive dividend policy, alongside environmental targets of Ichigo Climate Positive, achieving RE100, and maintaining CDP leadership levels. In FY26/2 Ichigo received RE100 certification and reported CO2 reductions of 103,954 tons against CO2 emissions of 12,000 tons, a ratio of nine times. Ichigo was selected as an A List Company in both the 2025 CDP Climate Change and Water Security Assessments. In Clean Energy, Ichigo is expanding its battery storage pipeline, with its first battery storage plant in Chiba Prefecture of 8.9MWh scheduled to launch in FY27/2. Ichigo also announced that, upon the expiration of its J.League top partner agreement on June 30, 2026, it will conclude its J.League shareholder program and launch the Ichigo THANKS! Monthly Present program.
This article is an analysis based on publicly available information and is not a recommendation to buy or sell any specific securities. Investment decisions are your own responsibility.
















