
This article is based on publicly available IR materials and is not a recommendation to buy or sell any specific securities.
MEGMILK SNOW BRAND Co.,Ltd. reported FY2025 (the fiscal year ended March 2026) net sales of 615.7 billion yen, a change of -0.0% year on year, and operating profit of 18.2 billion yen, down 4.5%. Profitability improved on the back of price increases, but sales volume fell short of expectations. Profit attributable to owners of parent rose 136.6% to 32.8 billion yen. For FY2026 the company forecasts net sales of 645.0 billion yen and operating profit of 21.0 billion yen, describing the outlook as profit growth driven by higher sales unit prices and growth in sales volume.
Consolidated Results (Full-Year Actual)
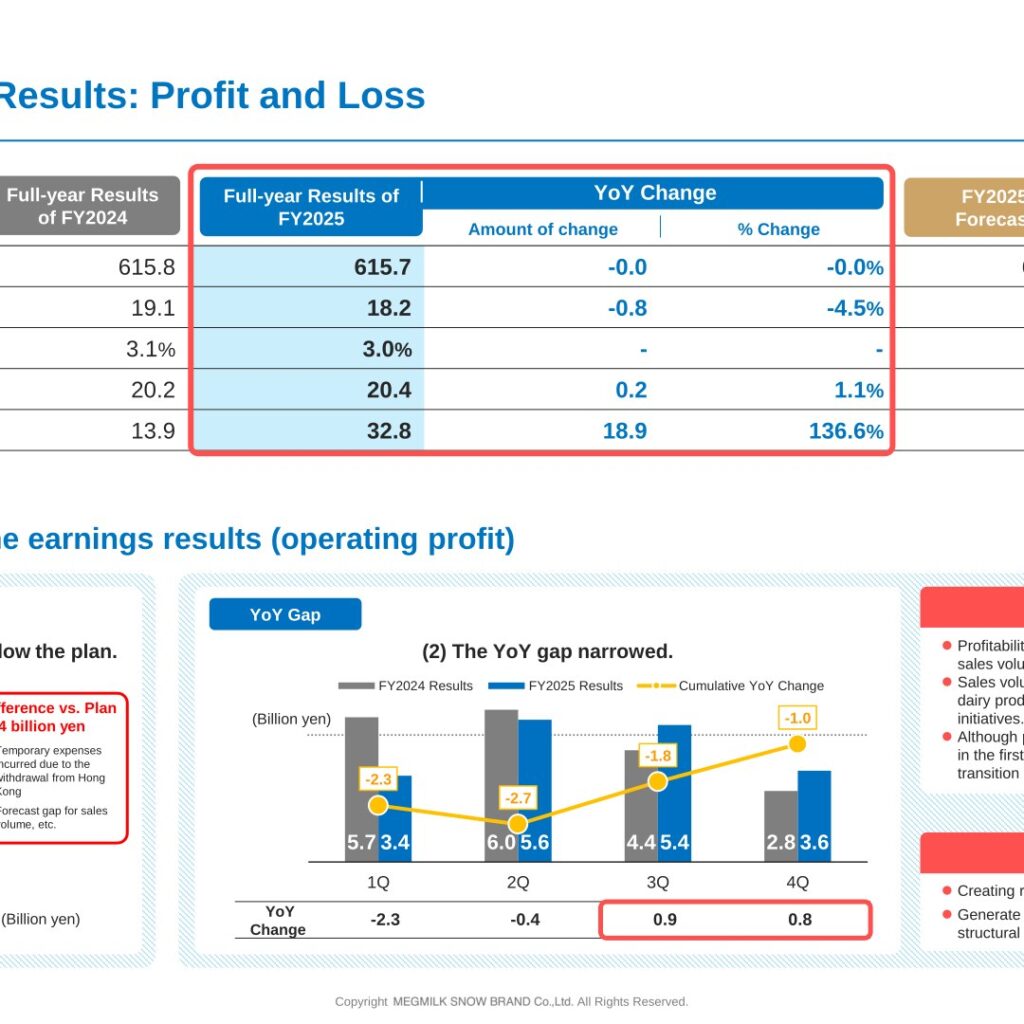
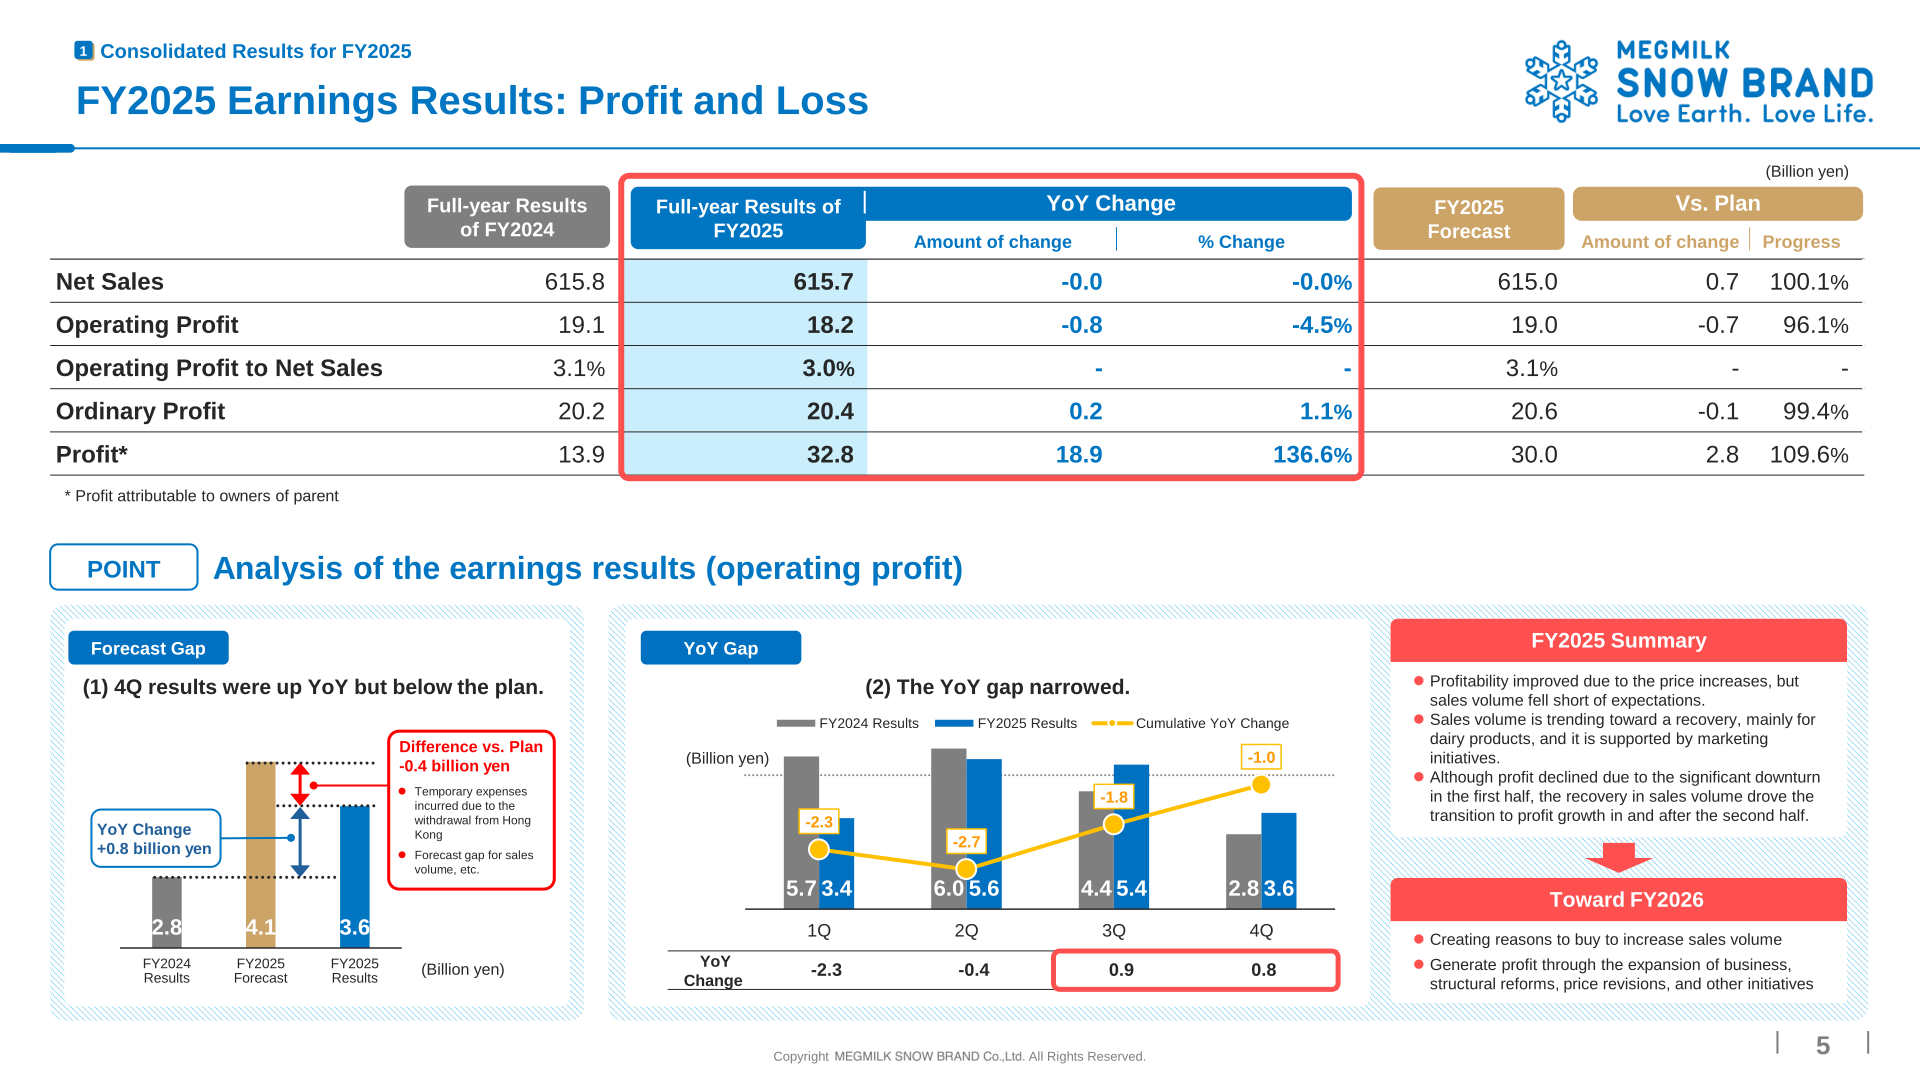
Net sales were virtually unchanged from the prior year at 615.7 billion yen, while operating profit declined 0.8 billion yen to 18.2 billion yen and the operating profit margin eased to 3.0% from 3.1%. Ordinary profit rose 1.1% to 20.4 billion yen and profit attributable to owners of parent reached 32.8 billion yen. The company summarised the year as follows: profitability improved due to the price increases, but sales volume fell short of expectations; although profit declined due to the significant downturn in the first half, the recovery in sales volume drove the transition to profit growth in and after the second half.
| Item (Billion yen) | FY2024 Full Year | FY2025 Full Year | YoY Amount of Change | % Change YoY |
|---|---|---|---|---|
| Net Sales | 615.8 | 615.7 | -0.0 | -0.0% |
| Operating Profit | 19.1 | 18.2 | -0.8 | -4.5% |
| Operating Profit to Net Sales | 3.1% | 3.0% | – | – |
| Ordinary Profit | 20.2 | 20.4 | 0.2 | 1.1% |
| Profit (attributable to owners of parent) | 13.9 | 32.8 | 18.9 | 136.6% |
Against the company’s own FY2025 forecast, net sales and profit came in ahead of plan while operating profit fell short. The materials attribute the operating profit shortfall versus plan of -0.4 billion yen at the fourth-quarter level to temporary expenses incurred due to the withdrawal from Hong Kong and a forecast gap for sales volume, etc.
| Item (Billion yen) | FY2025 Forecast | FY2025 Results | Amount of Change | Progress |
|---|---|---|---|---|
| Net Sales | 615.0 | 615.7 | 0.7 | 100.1% |
| Operating Profit | 19.0 | 18.2 | -0.7 | 96.1% |
| Operating Profit to Net Sales | 3.1% | 3.0% | – | – |
| Ordinary Profit | 20.6 | 20.4 | -0.1 | 99.4% |
| Profit (attributable to owners of parent) | 30.0 | 32.8 | 2.8 | 109.6% |
Segment Results
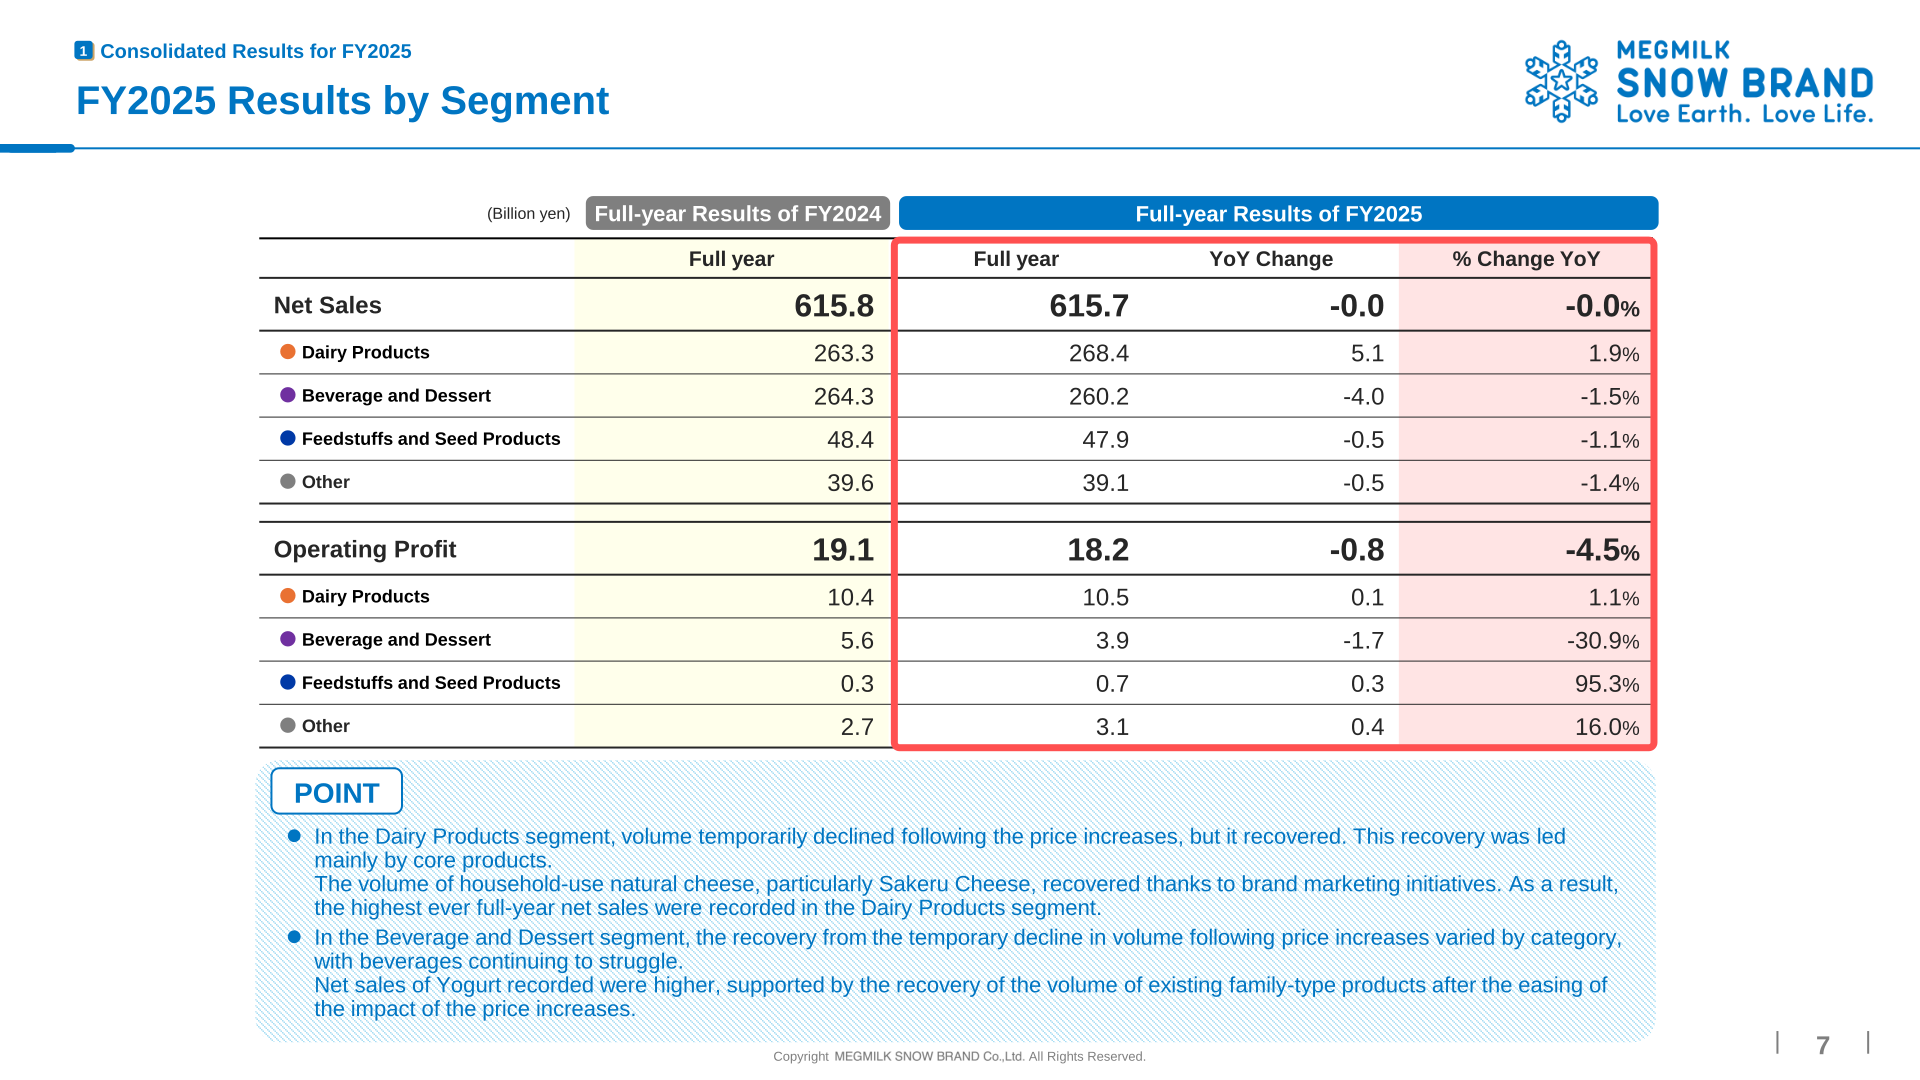
Dairy Products was the only reporting segment to grow net sales, rising 1.9% to 268.4 billion yen. The company states that in the Dairy Products segment volume temporarily declined following the price increases but it recovered, led mainly by core products; the volume of household-use natural cheese, particularly Sakeru Cheese, recovered thanks to brand marketing initiatives, and as a result the highest ever full-year net sales were recorded in the Dairy Products segment. In Beverage and Dessert, net sales fell 1.5% to 260.2 billion yen and operating profit dropped 30.9% to 3.9 billion yen, with the recovery from the temporary decline in volume following price increases varying by category and beverages continuing to struggle. Feedstuffs and Seed Products saw lower net sales but operating profit up 95.3% to 0.7 billion yen, as the decline in sales did not significantly impact profitability due to reduced raw material costs.
| Segment (Billion yen) | Metric | FY2024 Full Year | FY2025 Full Year | YoY Change | % Change YoY |
|---|---|---|---|---|---|
| Net Sales (total) | Net Sales | 615.8 | 615.7 | -0.0 | -0.0% |
| Dairy Products | Net Sales | 263.3 | 268.4 | 5.1 | 1.9% |
| Beverage and Dessert | Net Sales | 264.3 | 260.2 | -4.0 | -1.5% |
| Feedstuffs and Seed Products | Net Sales | 48.4 | 47.9 | -0.5 | -1.1% |
| Other | Net Sales | 39.6 | 39.1 | -0.5 | -1.4% |
| Operating Profit (total) | Operating Profit | 19.1 | 18.2 | -0.8 | -4.5% |
| Dairy Products | Operating Profit | 10.4 | 10.5 | 0.1 | 1.1% |
| Beverage and Dessert | Operating Profit | 5.6 | 3.9 | -1.7 | -30.9% |
| Feedstuffs and Seed Products | Operating Profit | 0.3 | 0.7 | 0.3 | 95.3% |
| Other | Operating Profit | 2.7 | 3.1 | 0.4 | 16.0% |
FY2026 Forecast
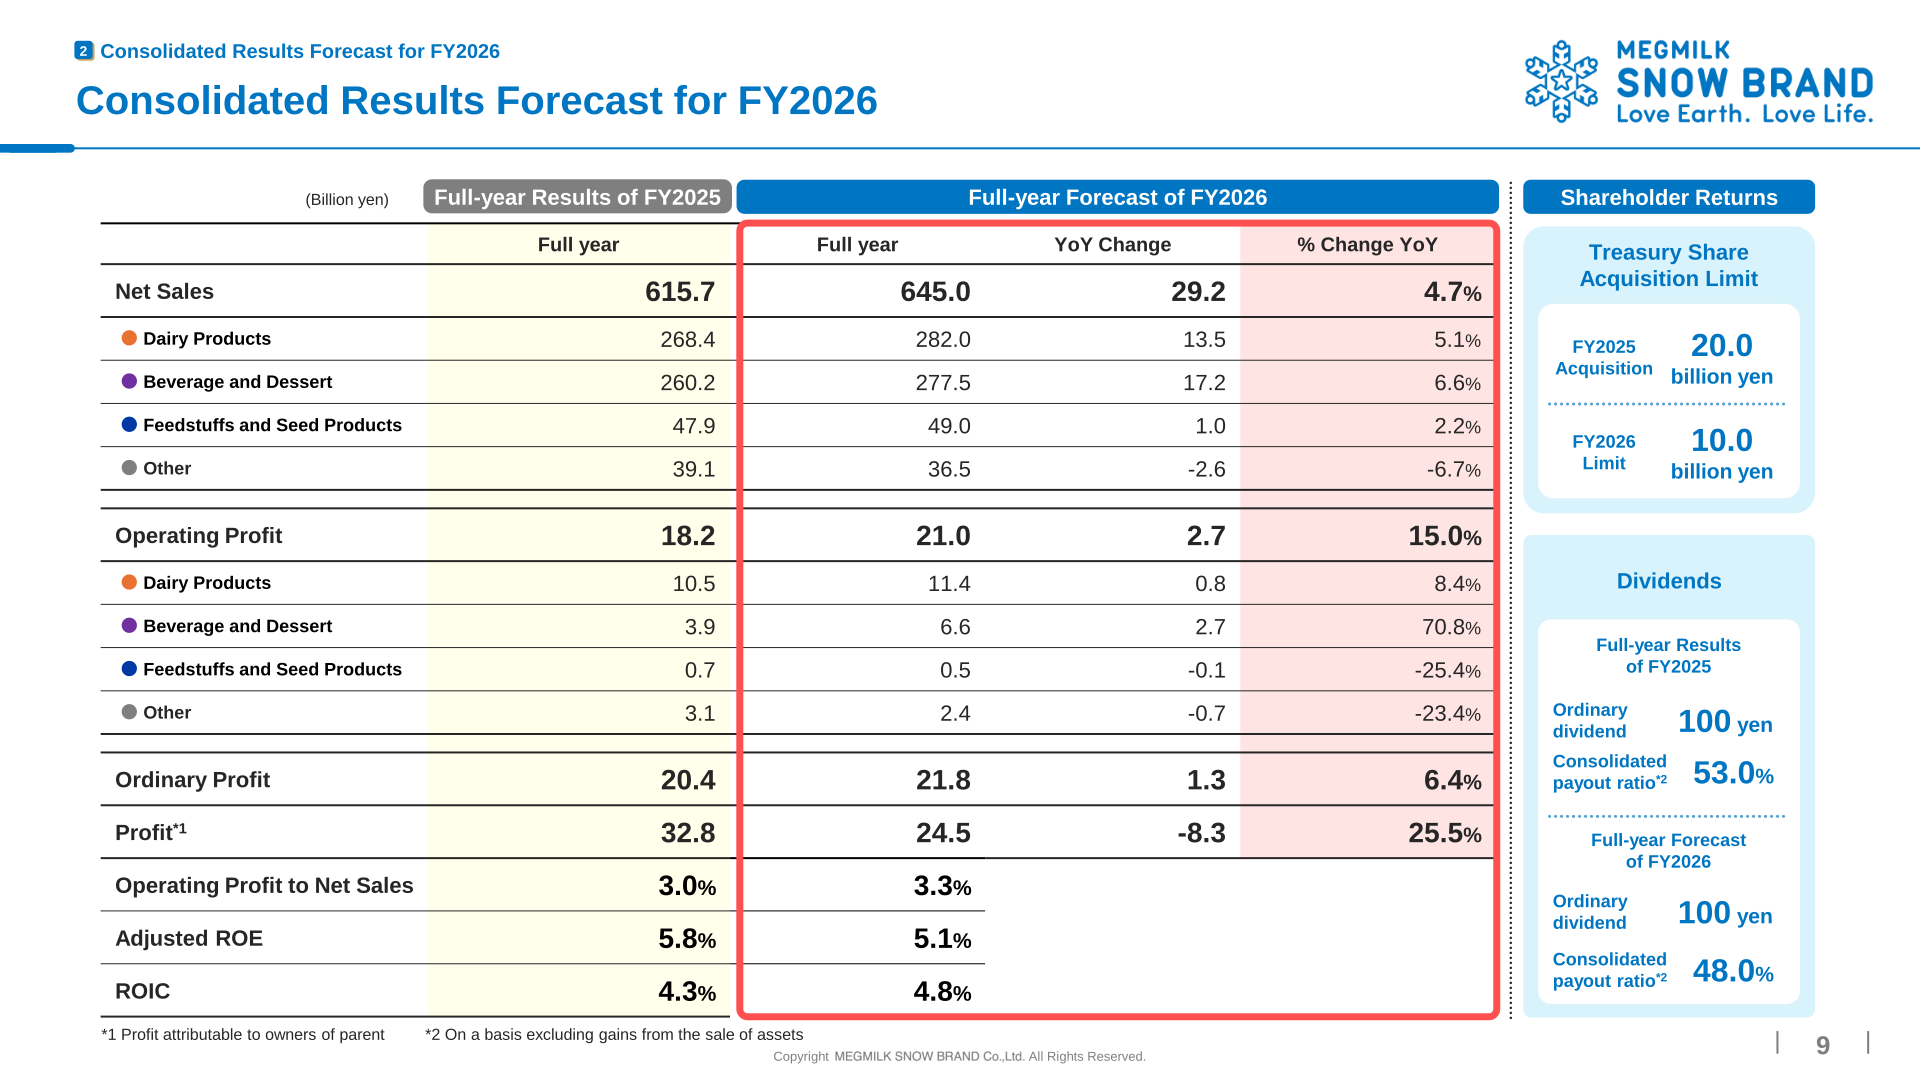
For FY2026 the company forecasts net sales of 645.0 billion yen, up 29.2 billion yen or 4.7%, and operating profit of 21.0 billion yen, up 2.7 billion yen or 15.0%. Ordinary profit is forecast at 21.8 billion yen and profit attributable to owners of parent at 24.5 billion yen. The operating profit margin is projected to rise to 3.3%, with adjusted ROE of 5.1% and ROIC of 4.8%. Growth is expected to be led by Beverage and Dessert, where operating profit is forecast to rise 70.8% to 6.6 billion yen, and by Dairy Products at 11.4 billion yen. The presentation notes that the company is closely monitoring developments in the Middle East and will respond as appropriate.
| Item (Billion yen) | FY2025 Full-Year Results | FY2026 Full-Year Forecast | YoY Change | % Change YoY |
|---|---|---|---|---|
| Net Sales | 615.7 | 645.0 | 29.2 | 4.7% |
| Dairy Products | 268.4 | 282.0 | 13.5 | 5.1% |
| Beverage and Dessert | 260.2 | 277.5 | 17.2 | 6.6% |
| Feedstuffs and Seed Products | 47.9 | 49.0 | 1.0 | 2.2% |
| Other | 39.1 | 36.5 | -2.6 | -6.7% |
| Operating Profit | 18.2 | 21.0 | 2.7 | 15.0% |
| Dairy Products | 10.5 | 11.4 | 0.8 | 8.4% |
| Beverage and Dessert | 3.9 | 6.6 | 2.7 | 70.8% |
| Feedstuffs and Seed Products | 0.7 | 0.5 | -0.1 | -25.4% |
| Other | 3.1 | 2.4 | -0.7 | -23.4% |
| Ordinary Profit | 20.4 | 21.8 | 1.3 | 6.4% |
| Profit (attributable to owners of parent) | 32.8 | 24.5 | -8.3 | 25.5% |
| Operating Profit to Net Sales | 3.0% | 3.3% | – | – |
| Adjusted ROE | 5.8% | 5.1% | – | – |
| ROIC | 4.3% | 4.8% | – | – |
Shareholder Returns
The dividend policy is a dividend payout ratio of 40% or higher with a minimum dividend of 100 yen per share. For FY2025 the ordinary dividend was 100 yen and the consolidated payout ratio, on a basis excluding gains from the sale of assets, was 53.0%; the FY2026 forecast is again an ordinary dividend of 100 yen with a consolidated payout ratio on the same basis of 48.0%. On treasury shares, the company states that it repurchased and cancelled 20.0 billion yen of treasury shares in FY2025 and that for FY2026 a treasury share acquisition range of up to 10 billion yen has been set, adding that all acquired treasury shares are expected to be cancelled. The ratio of cross-shareholdings to net assets was reduced to below 10%, at 8.9%, as of the end of FY2025.
| Item | FY2025 | FY2026 |
|---|---|---|
| Ordinary dividend | 100 yen | 100 yen |
| Consolidated payout ratio (excluding gains from the sale of assets) | 53.0% | 48.0% |
| Treasury share acquisition | 20.0 billion yen (FY2025 Acquisition) | 10.0 billion yen (FY2026 Limit) |
Next Design 2030: Progress
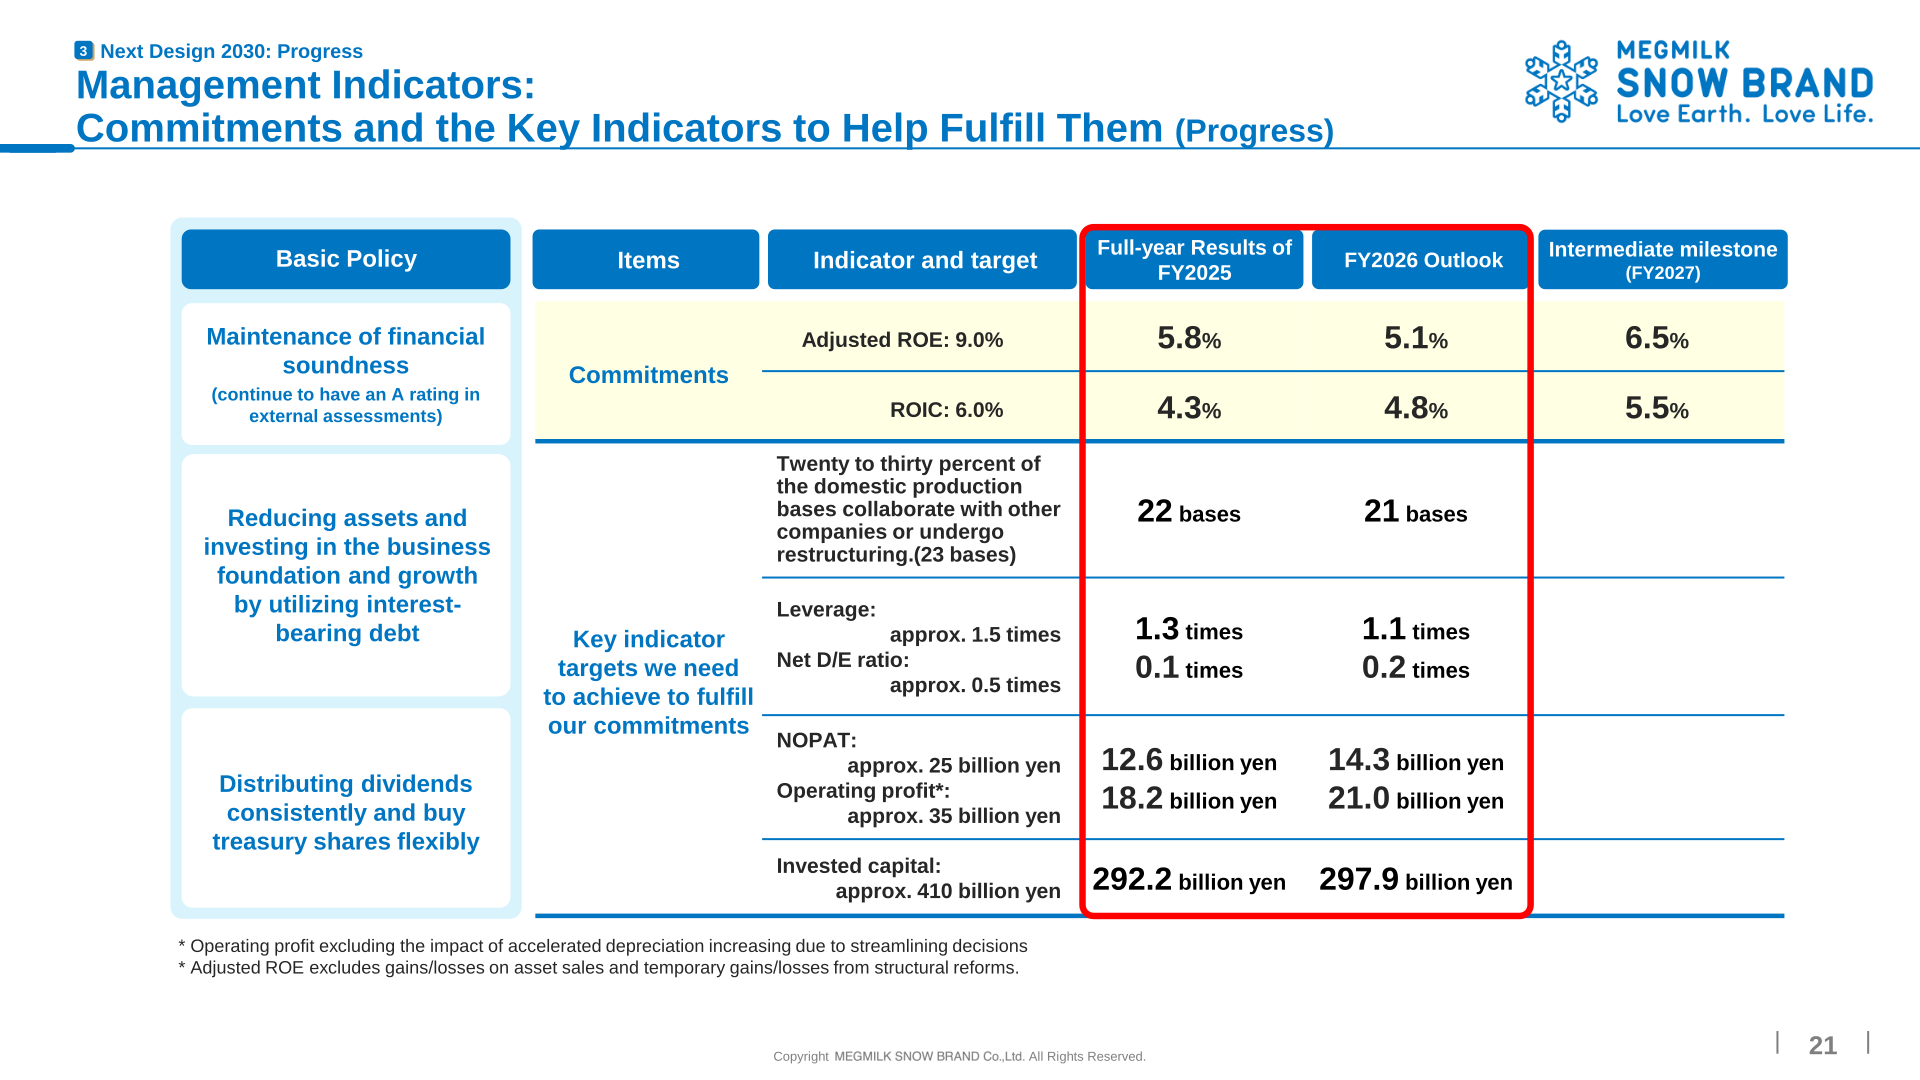
The company reports that its Next Design 2030 business plan is on track and that major asset transformation is progressing steadily. Against a commitment of adjusted ROE of 9.0% and ROIC of 6.0%, FY2025 delivered adjusted ROE of 5.8% and ROIC of 4.3%, with an FY2026 outlook of 5.1% and 4.8% respectively and intermediate milestones for FY2027 of 6.5% and 5.5%. Domestic production bases stood at 22 bases in FY2025 against a base of 23, with 21 bases in the FY2026 outlook. NOPAT was 12.6 billion yen in FY2025 versus a target of approximately 25 billion yen, and invested capital was 292.2 billion yen against approximately 410 billion yen. On the portfolio, production at the Kobe Plant ended in March 2026, production at the Kawagoe Plant is to end (scheduled for the end of the first half of 2028) with reorganisation and consolidation of production functions involving an investment amount of approximately 10.9 billion yen, and capital investment to increase cheese production is underway at the Nakashibetsu and Ami Plants.
| Indicator and target | FY2025 Full-Year Results | FY2026 Outlook | Intermediate milestone (FY2027) |
|---|---|---|---|
| Adjusted ROE: 9.0% | 5.8% | 5.1% | 6.5% |
| ROIC: 6.0% | 4.3% | 4.8% | 5.5% |
| Domestic production bases (23 bases) | 22 bases | 21 bases | – |
| Leverage: approx. 1.5 times | 1.3 times | 1.1 times | – |
| Net D/E ratio: approx. 0.5 times | 0.1 times | 0.2 times | – |
| NOPAT: approx. 25 billion yen | 12.6 billion yen | 14.3 billion yen | – |
| Operating profit: approx. 35 billion yen | 18.2 billion yen | 21.0 billion yen | – |
| Invested capital: approx. 410 billion yen | 292.2 billion yen | 297.9 billion yen | – |
This article is an analysis based on publicly available information and is not a recommendation to buy or sell any specific securities. Investment decisions are your own responsibility.
















