
This article is based on publicly available IR materials and is not a recommendation to buy or sell any specific securities.
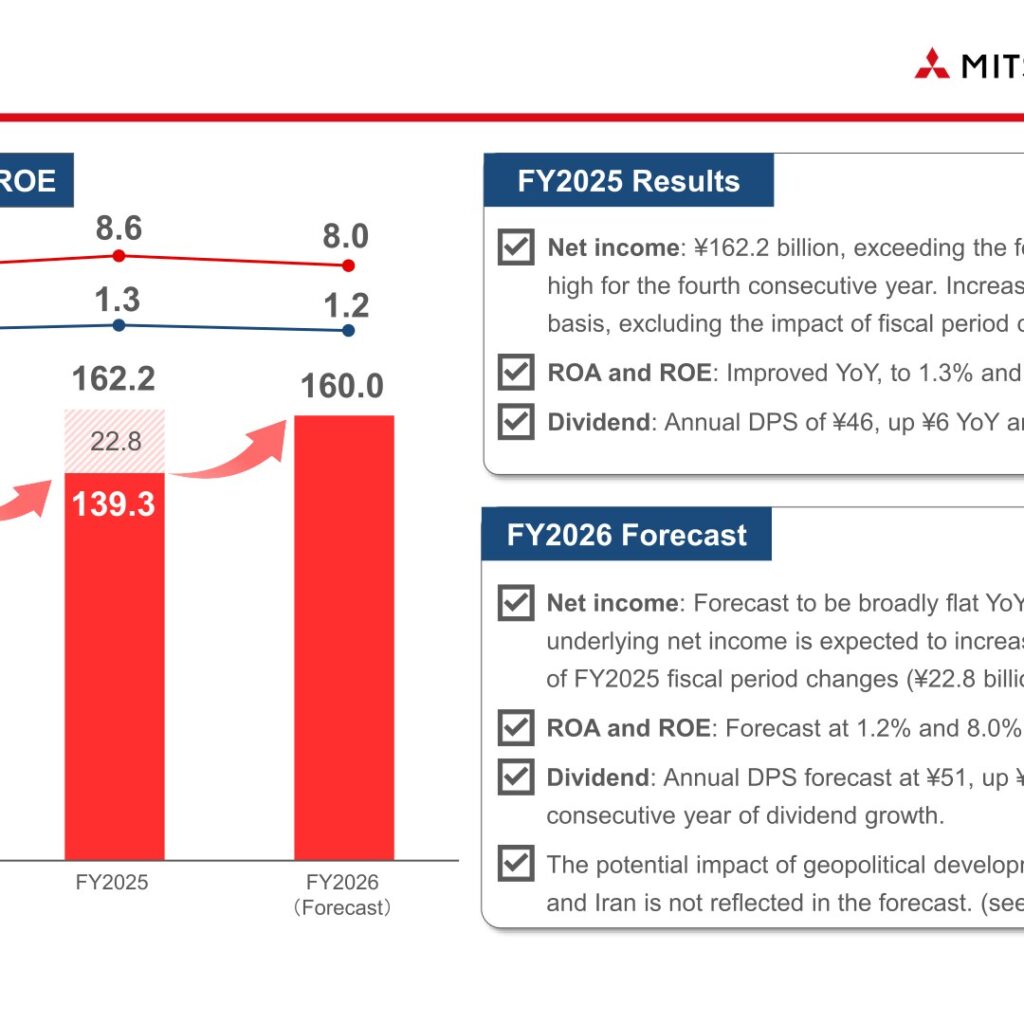
Mitsubishi HC Capital Inc. reported consolidated net income attributable to owners of the parent of ¥162.2 billion for the fiscal year ended March 31, 2026 (FY2025), up 20.0% year on year and a record high for the fourth consecutive year, exceeding its own forecast of ¥160.0 billion. Net income increased year on year even on an underlying basis, excluding the ¥22.8 billion positive impact of fiscal period changes at consolidated subsidiaries (elfc, CAI, and PNW). ROA improved to 1.3% and ROE to 8.6%, both up year on year, while the annual dividend per share was set at ¥46, up ¥6 year on year and ¥1 above the forecast. For FY2026, the company forecasts net income of ¥160.0 billion, roughly flat year on year, with a planned dividend increase to ¥51 per share, marking a 28th consecutive year of dividend growth.
Consolidated Results (Full-Year Actual)
Income gain rose 12.4% year on year to ¥450.1 billion, driven by strong performance in Aviation and a positive impact from fiscal period changes at consolidated subsidiaries. Asset-related gain/loss declined 37.0% to ¥40.8 billion, reflecting the absence of a large prior-year gain of ¥37.0 billion on asset sales by a divested Real Estate subsidiary and higher impairment losses in Aviation; excluding that prior-year impact, asset-related gain/loss was up year on year, driven by multiple large asset sales in Real Estate. New transactions volume increased 1.5% to ¥3,361.5 billion. Total segment assets grew 10.1% to ¥12,034.9 billion, reflecting asset growth in Aviation, Real Estate, and the Global Customer Business (Europe), as well as foreign exchange impact, while the equity ratio was unchanged at 15.2%.
| Item | FY2025 | FY2024 | Change |
|---|---|---|---|
| Income gain | ¥450.1bn | ¥400.5bn | +¥49.6bn (+12.4%) |
| Asset-related gain/loss | ¥40.8bn | ¥64.9bn | -¥24.0bn (-37.0%) |
| Net income | ¥162.2bn | ¥135.1bn | +¥27.0bn (+20.0%) |
| New transactions volume | ¥3,361.5bn | ¥3,311.7bn | +¥49.7bn (+1.5%) |
| ROA | 1.3% | 1.2% | +0.1pt |
| ROE | 8.6% | 7.8% | +0.8pt |
| Total segment assets (end of FY) | ¥12,034.9bn | ¥10,935.6bn | +¥1,099.3bn (+10.1%) |
| Equity ratio (end of FY) | 15.2% | 15.2% | 0.0pt |
| Annual dividend per share | ¥46 | ¥40 | +¥6 |
Segment Results
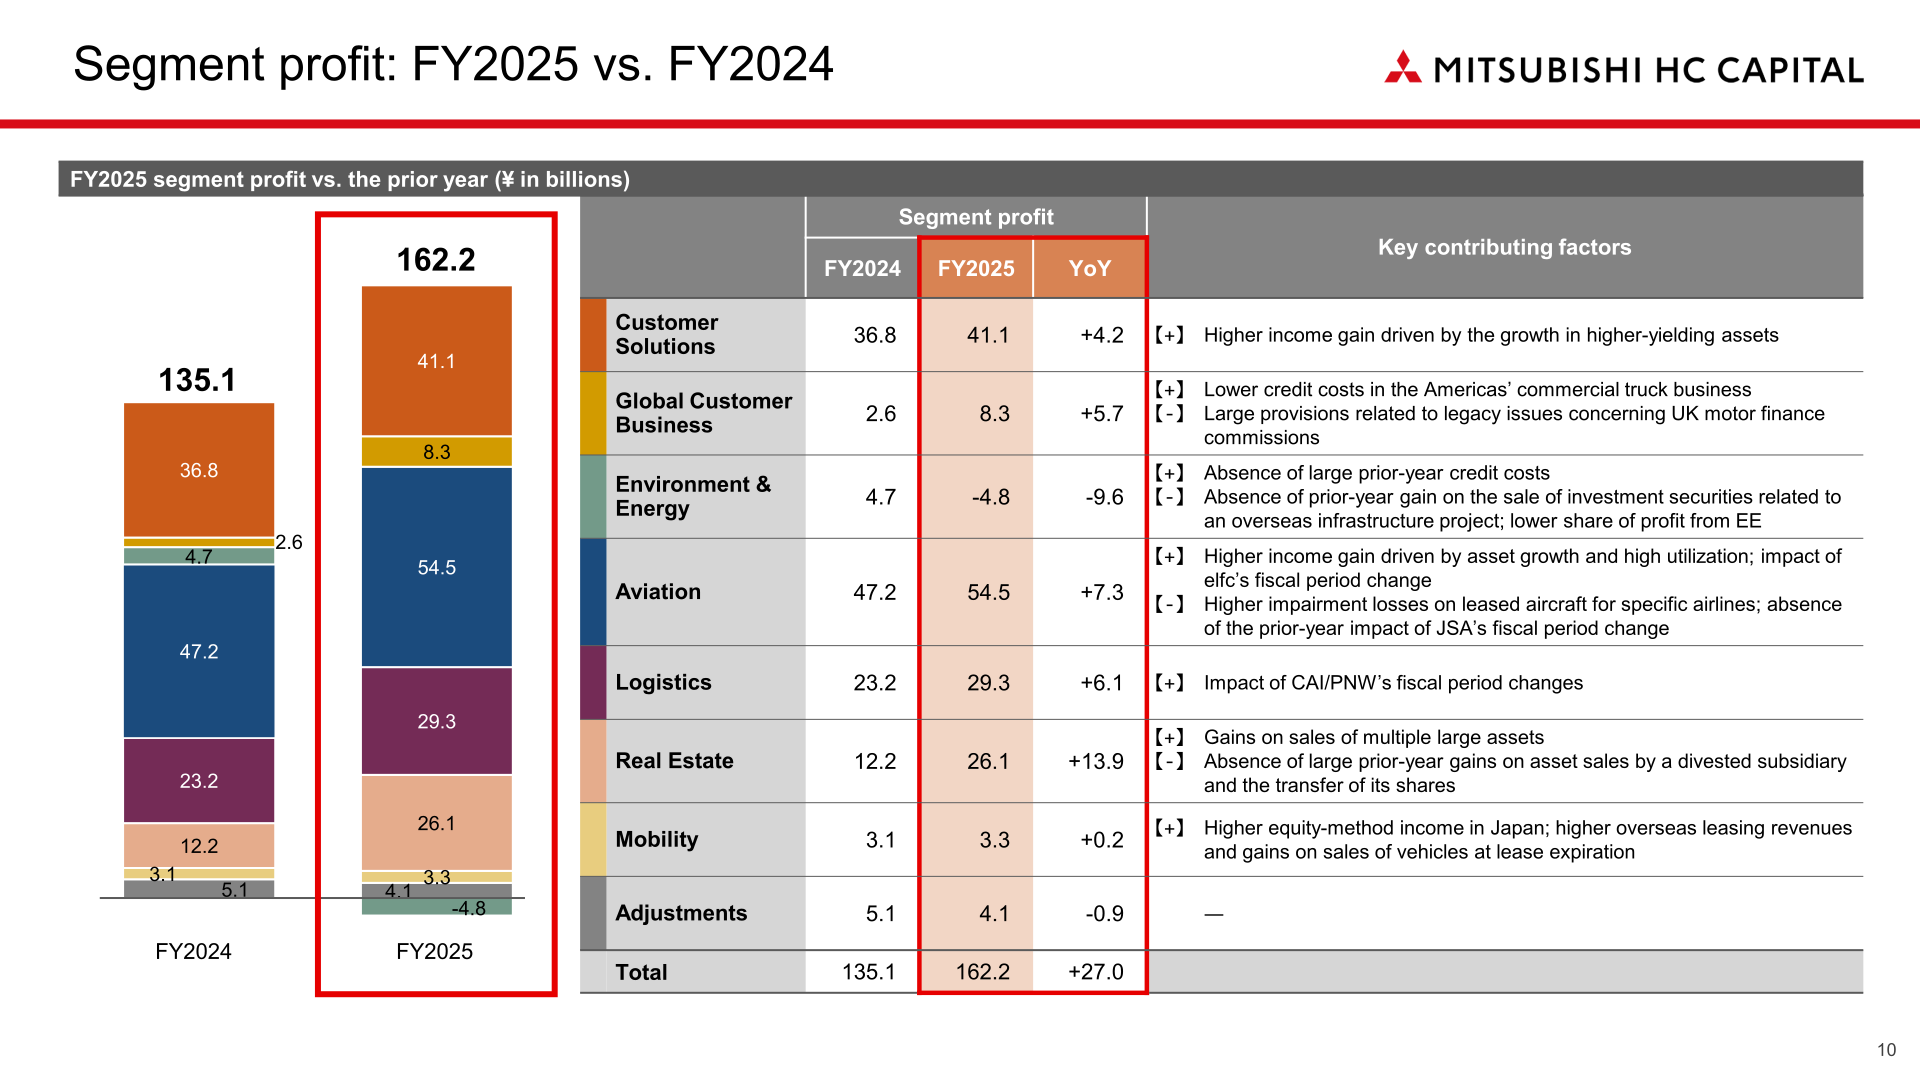
By segment, Aviation posted the largest increase in segment profit, up ¥7.3 billion to ¥54.5 billion, driven by higher income gain from asset growth and sustained high engine utilization, partly offset by impairment losses on leased aircraft for specific airlines. Real Estate profit rose ¥13.9 billion to ¥26.1 billion on multiple large asset sales. Global Customer Business profit increased ¥5.7 billion to ¥8.3 billion, as lower credit costs in the Americas’ commercial truck business more than offset large provisions related to legacy issues concerning UK motor finance commissions. Logistics profit rose ¥6.1 billion to ¥29.3 billion, and Customer Solutions profit rose ¥4.2 billion to ¥41.1 billion. Environment & Energy posted a segment loss of ¥4.8 billion, down ¥9.6 billion year on year, as the absence of large prior-year credit costs was more than offset by the absence of a prior-year gain on the sale of investment securities related to an overseas infrastructure project. Mobility profit was roughly flat at ¥3.3 billion. Effective April 1, 2026, the company revised its reporting segments to a three-unit, six-segment structure: the Mobility segment has been integrated into Logistics, ASEAN within Global Customer Business has been renamed Asia & Oceania, and China has been reclassified into head-office ‘Other’ accounts.
| Segment | FY2025 Segment Profit | FY2024 Segment Profit | YoY Change |
|---|---|---|---|
| Customer Solutions | ¥41.1bn | ¥36.8bn | +¥4.2bn |
| Global Customer Business | ¥8.3bn | ¥2.6bn | +¥5.7bn |
| Environment & Energy | -¥4.8bn | ¥4.7bn | -¥9.6bn |
| Aviation | ¥54.5bn | ¥47.2bn | +¥7.3bn |
| Logistics | ¥29.3bn | ¥23.2bn | +¥6.1bn |
| Real Estate | ¥26.1bn | ¥12.2bn | +¥13.9bn |
| Mobility | ¥3.3bn | ¥3.1bn | +¥0.2bn |
| Adjustments | ¥4.1bn | ¥5.1bn | -¥0.9bn |
| Total | ¥162.2bn | ¥135.1bn | +¥27.0bn |
FY2026 Forecast
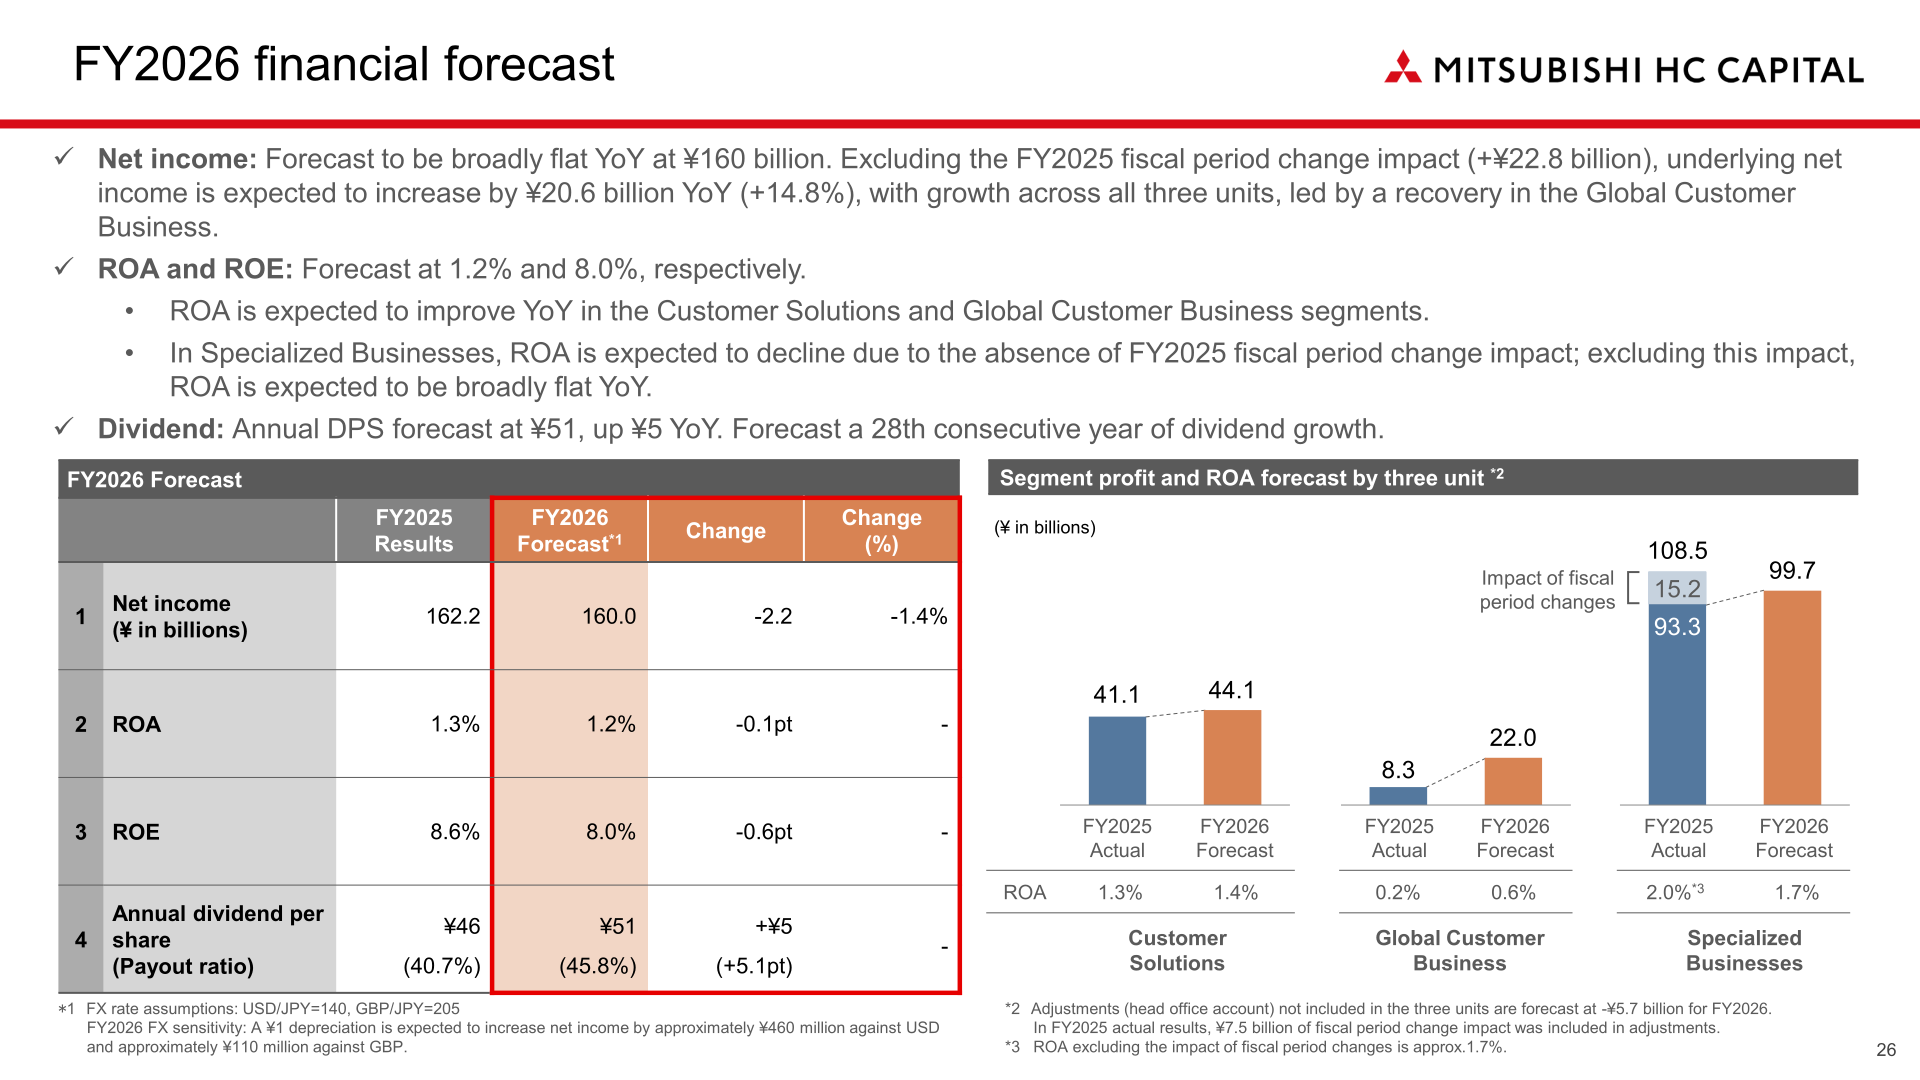
For FY2026, Mitsubishi HC Capital forecasts net income of ¥160.0 billion, broadly flat year on year. Excluding the FY2025 fiscal period change impact of ¥22.8 billion, underlying net income is expected to increase by ¥20.6 billion (+14.8%) year on year, with growth across all three business units led by a recovery in the Global Customer Business. ROA and ROE are forecast at 1.2% and 8.0%, respectively. FX rate assumptions for the forecast are USD/JPY=140 and GBP/JPY=205; a ¥1 depreciation of the yen is estimated to increase net income by approximately ¥460 million against the US dollar and approximately ¥110 million against the British pound. The potential impact of Middle East geopolitical instability involving the U.S., Israel and Iran has not been incorporated into the forecast, as its extent and duration cannot be reasonably assessed at this stage.
| Item | FY2026 Forecast | FY2025 (Actual) |
|---|---|---|
| Net income | ¥160.0bn | ¥162.2bn |
| ROA | 1.2% | 1.3% |
| ROE | 8.0% | 8.6% |
| Annual dividend per share (Payout ratio) | ¥51 (45.8%) | ¥46 (40.7%) |
Shareholder Returns
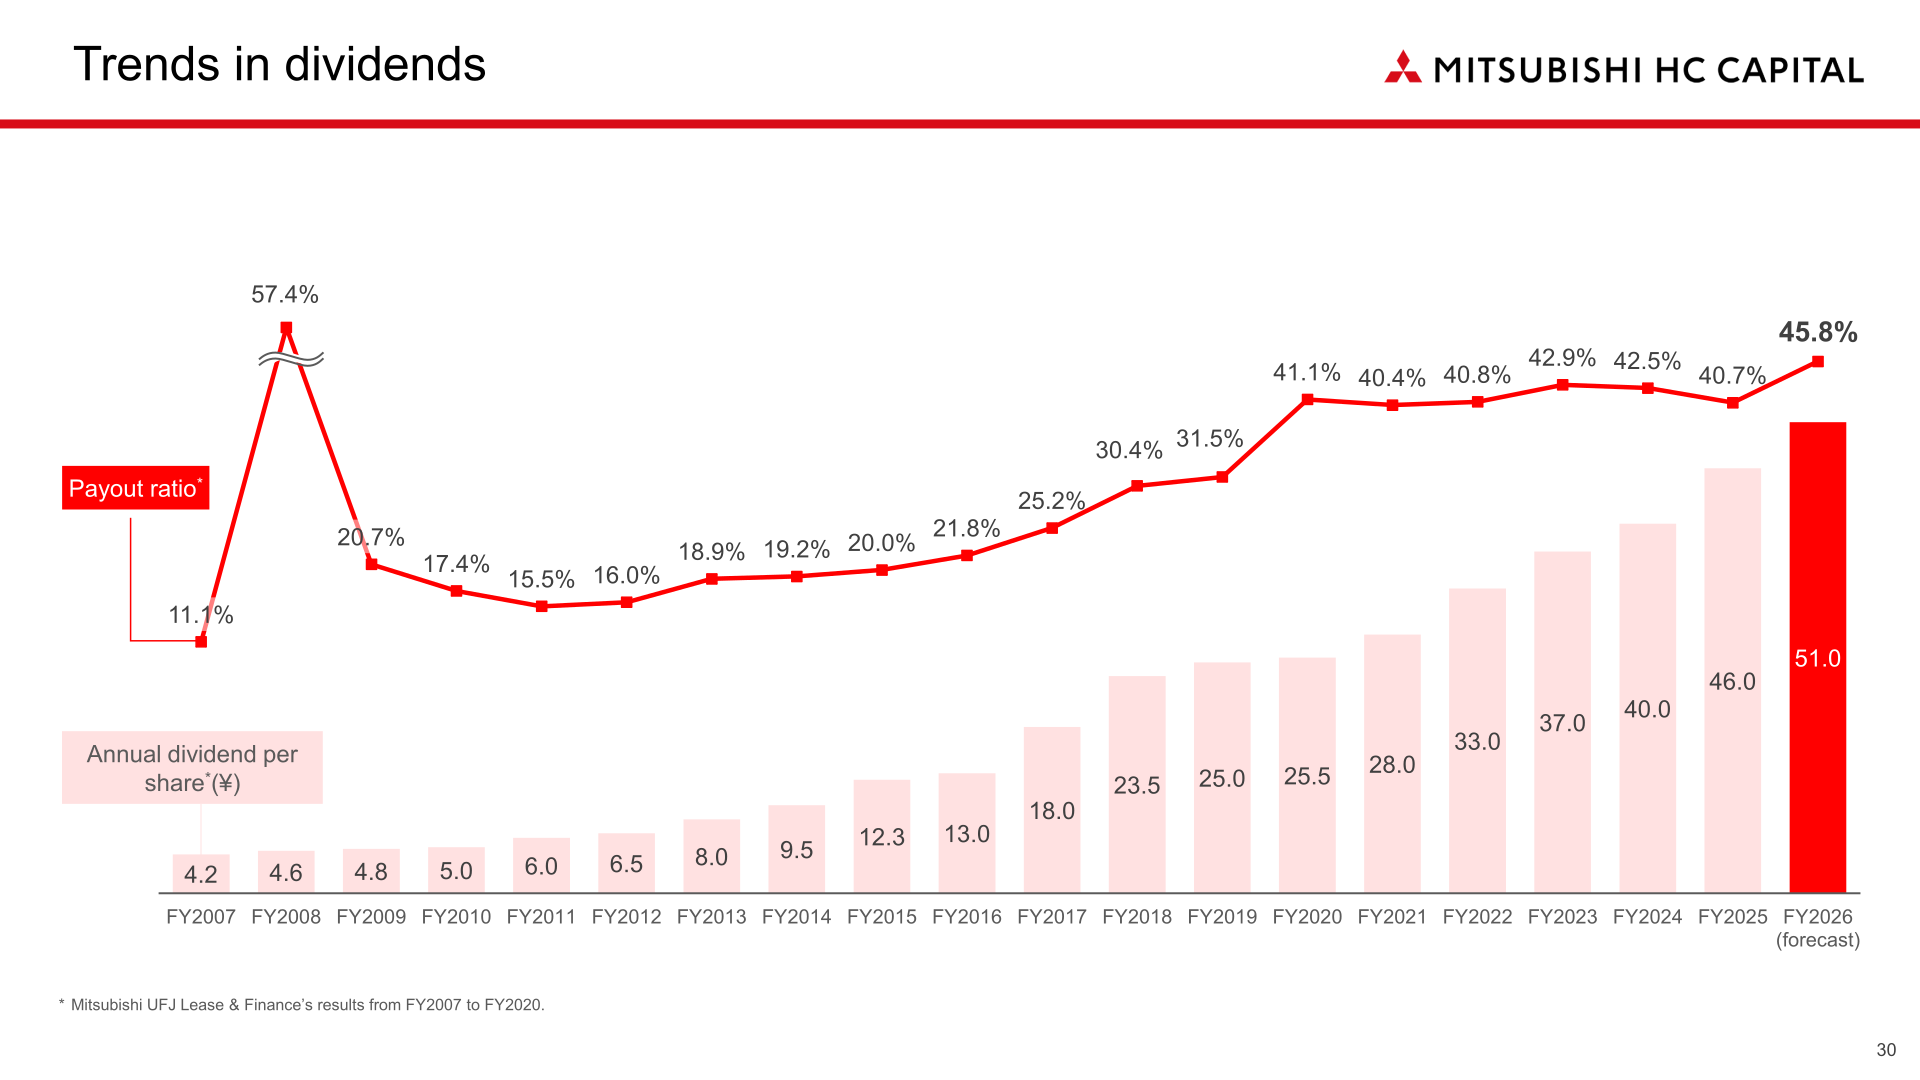
The annual dividend per share for FY2025 was set at ¥46, up ¥6 year on year and ¥1 above the initial forecast, with a payout ratio of 40.7%. For FY2026, the company forecasts an annual dividend of ¥51 per share, up ¥5 year on year, with a payout ratio of 45.8%, marking a 28th consecutive year of dividend growth. Under the 2025 Medium-Term Management Plan, the company targeted a payout ratio of 40% or above throughout the plan period; actual payout ratios were 42.9% in FY2023, 42.5% in FY2024, and 40.7% in FY2025, meeting the target.
Medium-Term Plan / Topics
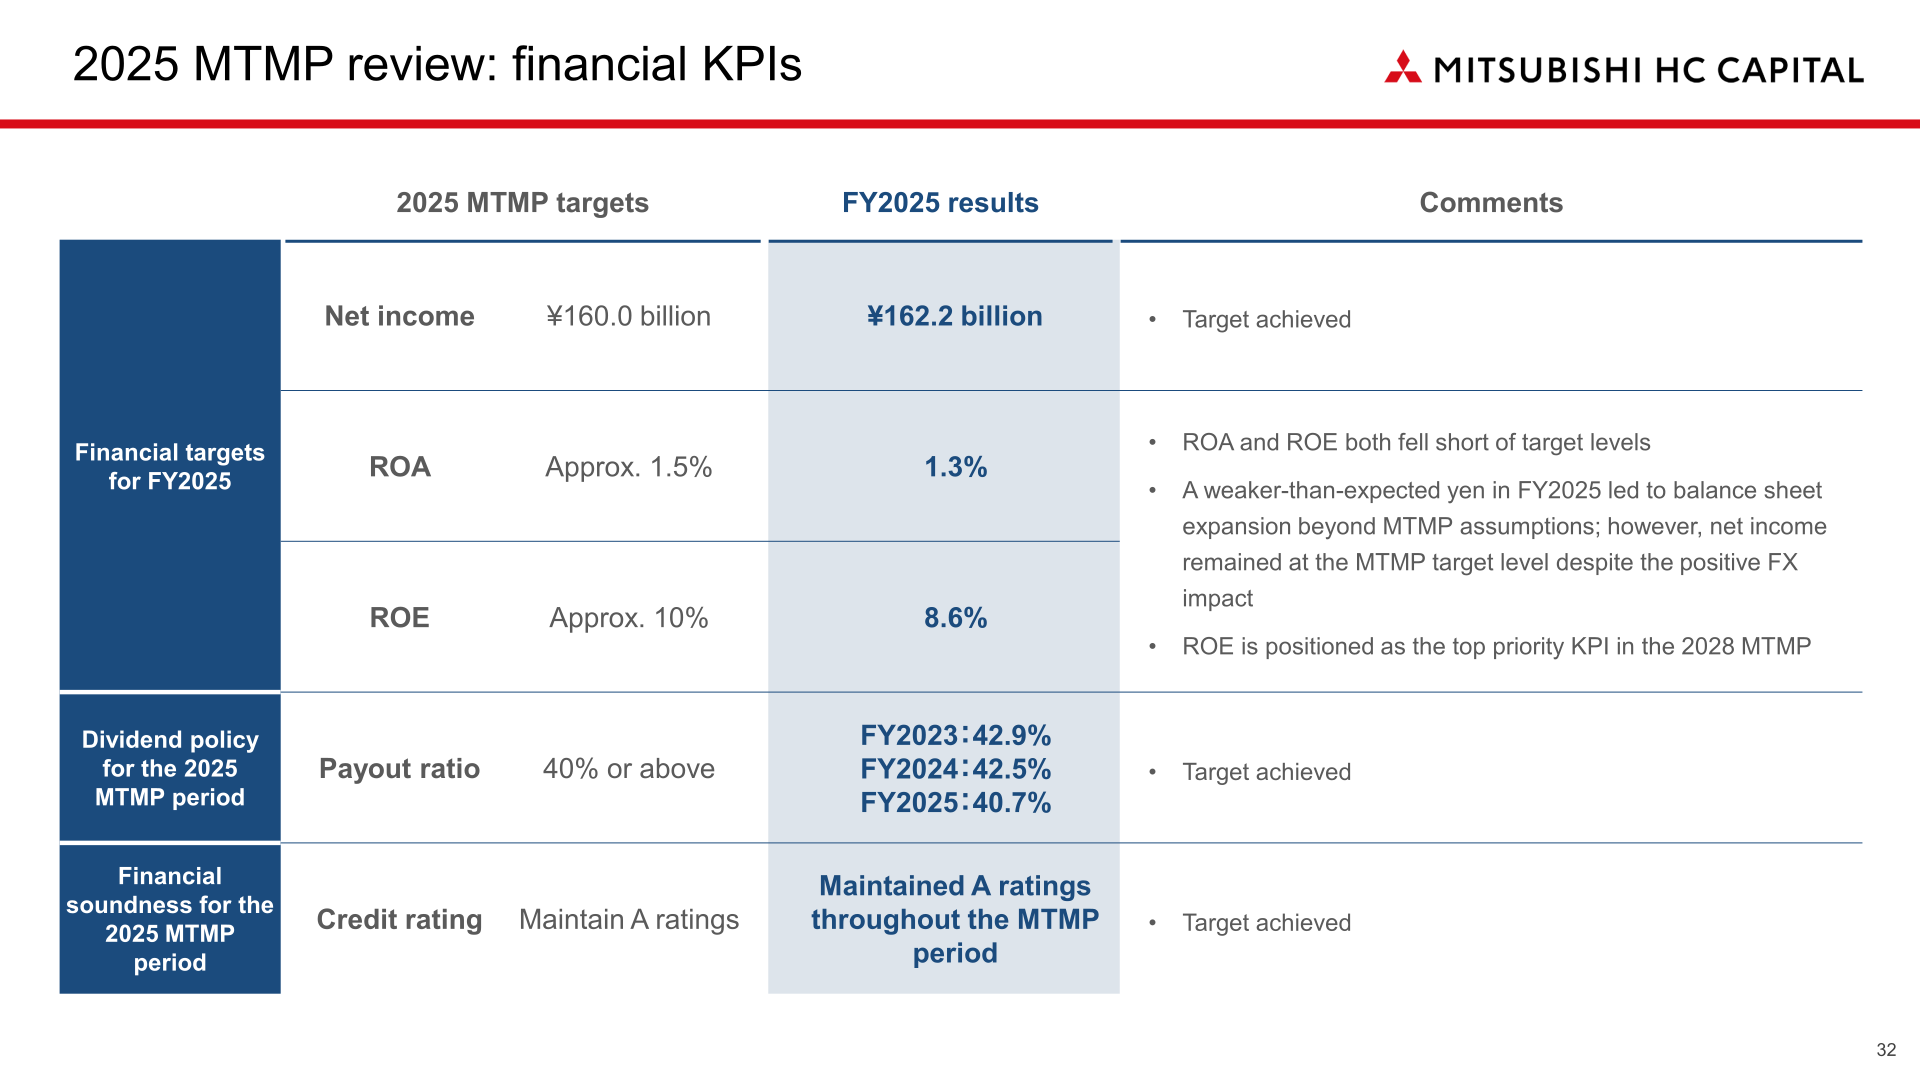
Under the 2025 Medium-Term Management Plan (MTMP), which concluded in FY2025, the company achieved its net income target of ¥160.0 billion (actual: ¥162.2 billion) and maintained A credit ratings throughout the plan period, but ROA (target: approx. 1.5%, actual: 1.3%) and ROE (target: approx. 10%, actual: 8.6%) both fell short of target levels, as a weaker-than-expected yen led to balance sheet expansion beyond MTMP assumptions despite the positive FX impact on net income. All non-financial KPIs under the plan were achieved. The company’s Innovation Investment Fund (¥10 billion fund size) has made cumulative investments of ¥5.2 billion in 26 companies over three years, focused on robotics, healthcare, decarbonization, and real estate, and ranked 9th among domestic financial institutions in FY2024 by number of startup investments. The next plan, the 2028 MTMP covering FY2026 through FY2028, positions ROE as its top-priority KPI.
| KPI | 2025 MTMP Target | FY2025 Result |
|---|---|---|
| Net income | ¥160.0 billion | ¥162.2 billion |
| ROA | Approx. 1.5% | 1.3% |
| ROE | Approx. 10% | 8.6% |
| Payout ratio (2025 MTMP period) | 40% or above | FY2023: 42.9% / FY2024: 42.5% / FY2025: 40.7% |
| Credit rating | Maintain A ratings | Maintained A ratings throughout the MTMP period |
This article is an analysis based on publicly available information and is not a recommendation to buy or sell any specific securities. Investment decisions are your own responsibility.
![[Obayashi] Investors’ Guide 2026 — The Complete 24-Article Breakdown](https://japan-equity.com/wp-content/uploads/2026/07/hub_cover-1024x1024.png)
![[Obayashi] IR & SR Policy — Feeding Dialogue Back into Management](https://japan-equity.com/wp-content/uploads/2026/07/p32_sq-1024x1024.jpg)
![[Obayashi] Real Estate Development — 18.7% Margin, ¥287.7bn Unrealized Gains](https://japan-equity.com/wp-content/uploads/2026/07/p20_sq-1024x1024.jpg)
![[Obayashi] Domestic Civil Engineering — Resilience Spending Supports 9.6% Margin](https://japan-equity.com/wp-content/uploads/2026/07/p11_sq-1024x1024.jpg)
![[Obayashi] Share Price & External Ratings — vs TOPIX, ESG Index Inclusion](https://japan-equity.com/wp-content/uploads/2026/07/p40_sq-1024x1024.jpg)
![[Construction] ¥75.5tn Investment, Shrinking Workforce — Big-5 Market Share](https://japan-equity.com/wp-content/uploads/2026/07/p12_sq-1024x1024.jpg)



![[Obayashi] Capital Policy & Shareholder Returns — ROE 10%+, DOE ~5%, ¥100bn Buyback](https://japan-equity.com/wp-content/uploads/2026/07/p27_sq-1024x1024.jpg)
![[Obayashi] Reducing Cross-Shareholdings — ¥285.2bn Sold in Five Years](https://japan-equity.com/wp-content/uploads/2026/07/p29_sq-1024x1024.jpg)
![[Obayashi] ¥750bn Investment Plan — ¥300bn to Development, ¥190bn to Tech/DX](https://japan-equity.com/wp-content/uploads/2026/07/p30_sq-1024x1024.jpg)
![[Obayashi] MTP2022 KPIs — Operating Profit ~2x Target, ROE 14.4%](https://japan-equity.com/wp-content/uploads/2026/07/p25_sq-1024x1024.jpg)
![[Obayashi] Cash Allocation — ¥420bn Investment CF Over Five Years](https://japan-equity.com/wp-content/uploads/2026/07/p26_sq-1024x1024.jpg)
![[Obayashi] Green Energy — 44 Plants, 344MW, and the Green Hydrogen Challenge](https://japan-equity.com/wp-content/uploads/2026/07/p21_sq-1024x1024.jpg)
![[Obayashi] Tackling the Labor Shortage — Robotics Construction®](https://japan-equity.com/wp-content/uploads/2026/07/p14_sq-1024x1024.jpg)
