
This article is based on publicly available IR materials and is not a recommendation to buy or sell any specific securities.
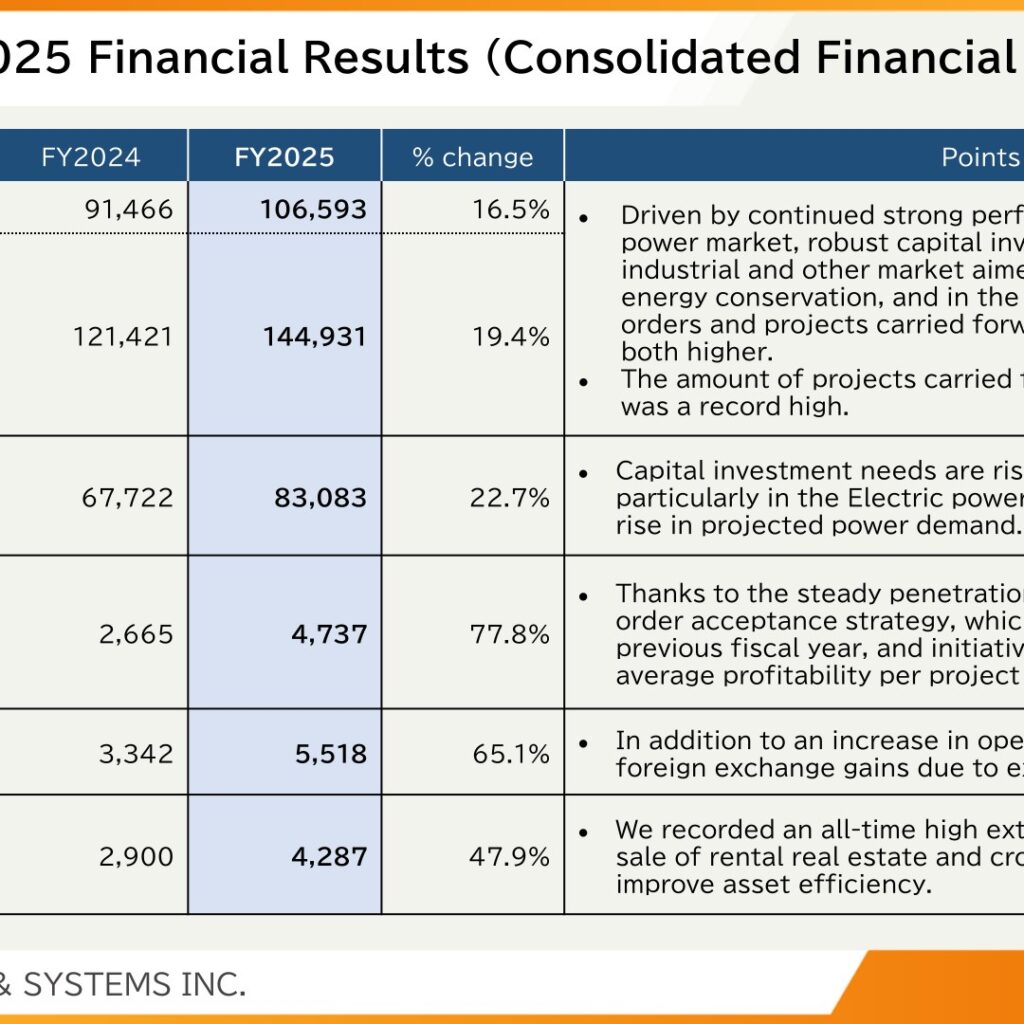
Note: in Tokyo Energy & Systems’ own materials, “FY2025” refers to the fiscal year ended March 31, 2026. In FY2025 the company posted net sales of 83,083 million yen, up 22.7% year on year, and operating profit of 4,737 million yen, up 77.8%. Total orders received rose 16.5% to 106,593 million yen, and the amount of projects carried forward to the next period reached a record high of 144,931 million yen, up 19.4%. Profit attributable to owners of parent company was 4,287 million yen, up 47.9%, which the company attributes in part to an all-time high extraordinary income from the sale of rental real estate and cross-shareholdings to improve asset efficiency.
Consolidated Results (Full-Year Actual)
The company cites continued strong performance in the Nuclear power market, robust capital investment in the General industrial and other market aimed at decarbonization and energy conservation, and growth in the Renewable energy market as the drivers of higher orders. On net sales, it points to rising capital investment needs in each market, particularly in the Electric power market, due to a significant rise in projected power demand. On operating profit, it credits the steady penetration of its profit-centered order acceptance strategy, pursued since the previous fiscal year, together with initiatives to boost productivity, which it says have greatly improved average profitability per project. Ordinary profit also benefited from foreign exchange gains due to exchange rate fluctuations.
| Item (millions of yen) | FY2024 | FY2025 | % change |
|---|---|---|---|
| Total orders received | 91,466 | 106,593 | 16.5% |
| Amount of projects carried forward to next period | 121,421 | 144,931 | 19.4% |
| Net sales | 67,722 | 83,083 | 22.7% |
| Operating profit | 2,665 | 4,737 | 77.8% |
| Ordinary profit | 3,342 | 5,518 | 65.1% |
| Profit attributable to owners of parent company | 2,900 | 4,287 | 47.9% |
On the balance sheet, total assets rose to 119,329 million yen from 108,081 million yen and net assets to 72,452 million yen from 68,427 million yen. Current assets were 66,994 million yen, reflecting higher accounts receivable from completed construction projects and contract assets, while non-current liabilities rose to 15,783 million yen due to bond issuance. As of the end of the fiscal year the equity ratio stood at 60.7% and the current ratio at 215.5%, which the company describes as indicating a high level of financial soundness.
Results by Market
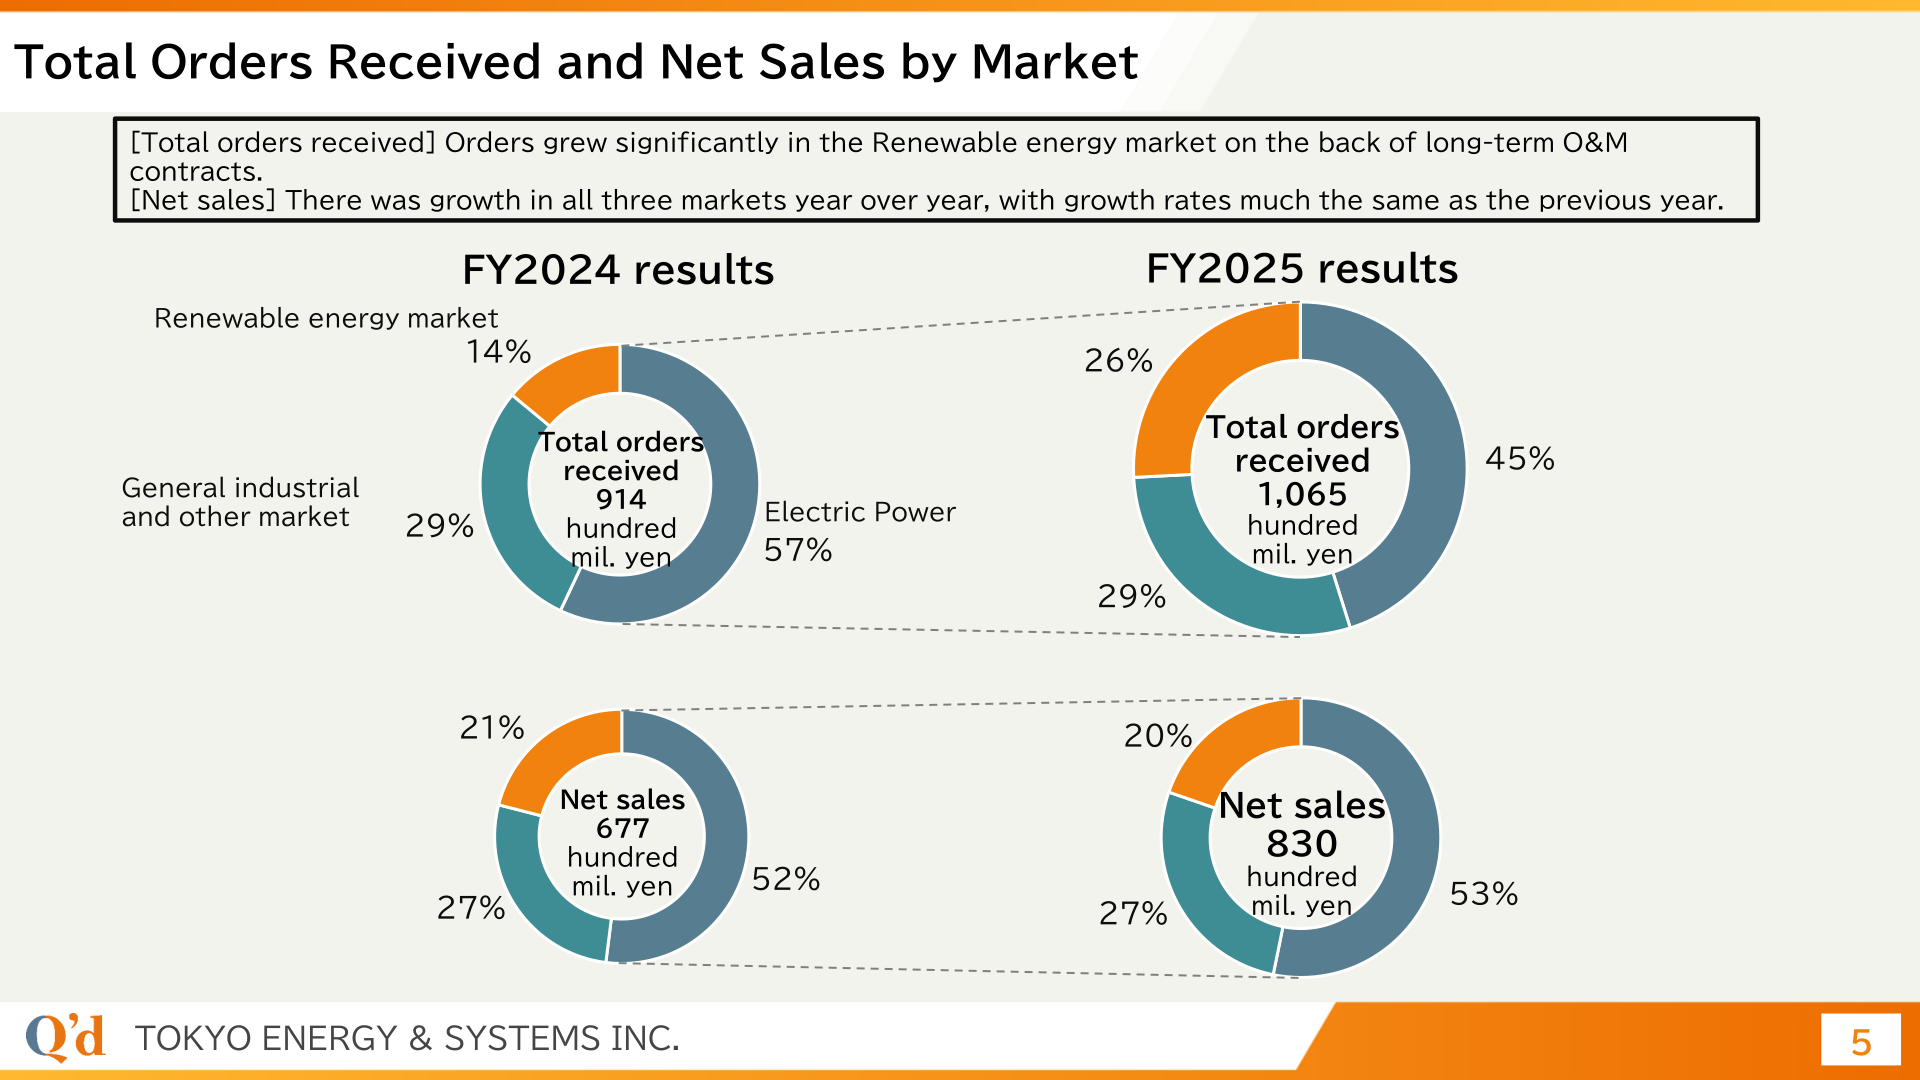
The company reports its business across three markets: Electric power, General industrial and other, and Renewable energy. In the Electric power market, nuclear power orders increased for a second consecutive fiscal year on safety measures construction at nuclear facilities and work related to the decommissioning of the Fukushima Daiichi Nuclear Power Plant, while substation orders fell against a FY2024 that included many large-scale projects. In the General industrial and other market, the company says both total orders received and projects carried forward to the next period were approximately 2.8 times higher than in FY2023. In the Renewable energy market, orders grew significantly on long-term O&M contracts won through long-term decarbonized power source auctions in the biomass field, renovation contracts for public hydro power generation facilities, and on-site PPA and large-scale solar work.
| Market / Field (hundred mil. yen) | Total orders FY2024 | Total orders FY2025 | Net sales FY2024 | Net sales FY2025 |
|---|---|---|---|---|
| Electric Power (market total) | 520 | 482 | 352 | 443 |
| – Substations | 130 | 78 | 56 | 68 |
| – Nuclear power | 172 | 209 | 151 | 200 |
| – Thermal power | 216 | 194 | 144 | 174 |
| General industrial and other (market total) | 262 | 310 | 186 | 225 |
| – General industrial | 190 | 202 | 104 | 136 |
| – Public infrastructure | 51 | 90 | 61 | 67 |
| – Overseas business, etc. | 21 | 17 | 19 | 21 |
| Renewable energy (market total) | 132 | 276 | 139 | 164 |
| – Solar | 26 | 76 | 38 | 62 |
| – Biomass | 67 | 141 | 62 | 70 |
| – Hydro | 38 | 58 | 39 | 31 |
| Consolidated total | 914 | 1,065 | 677 | 830 |
Profitability and Order Backlog
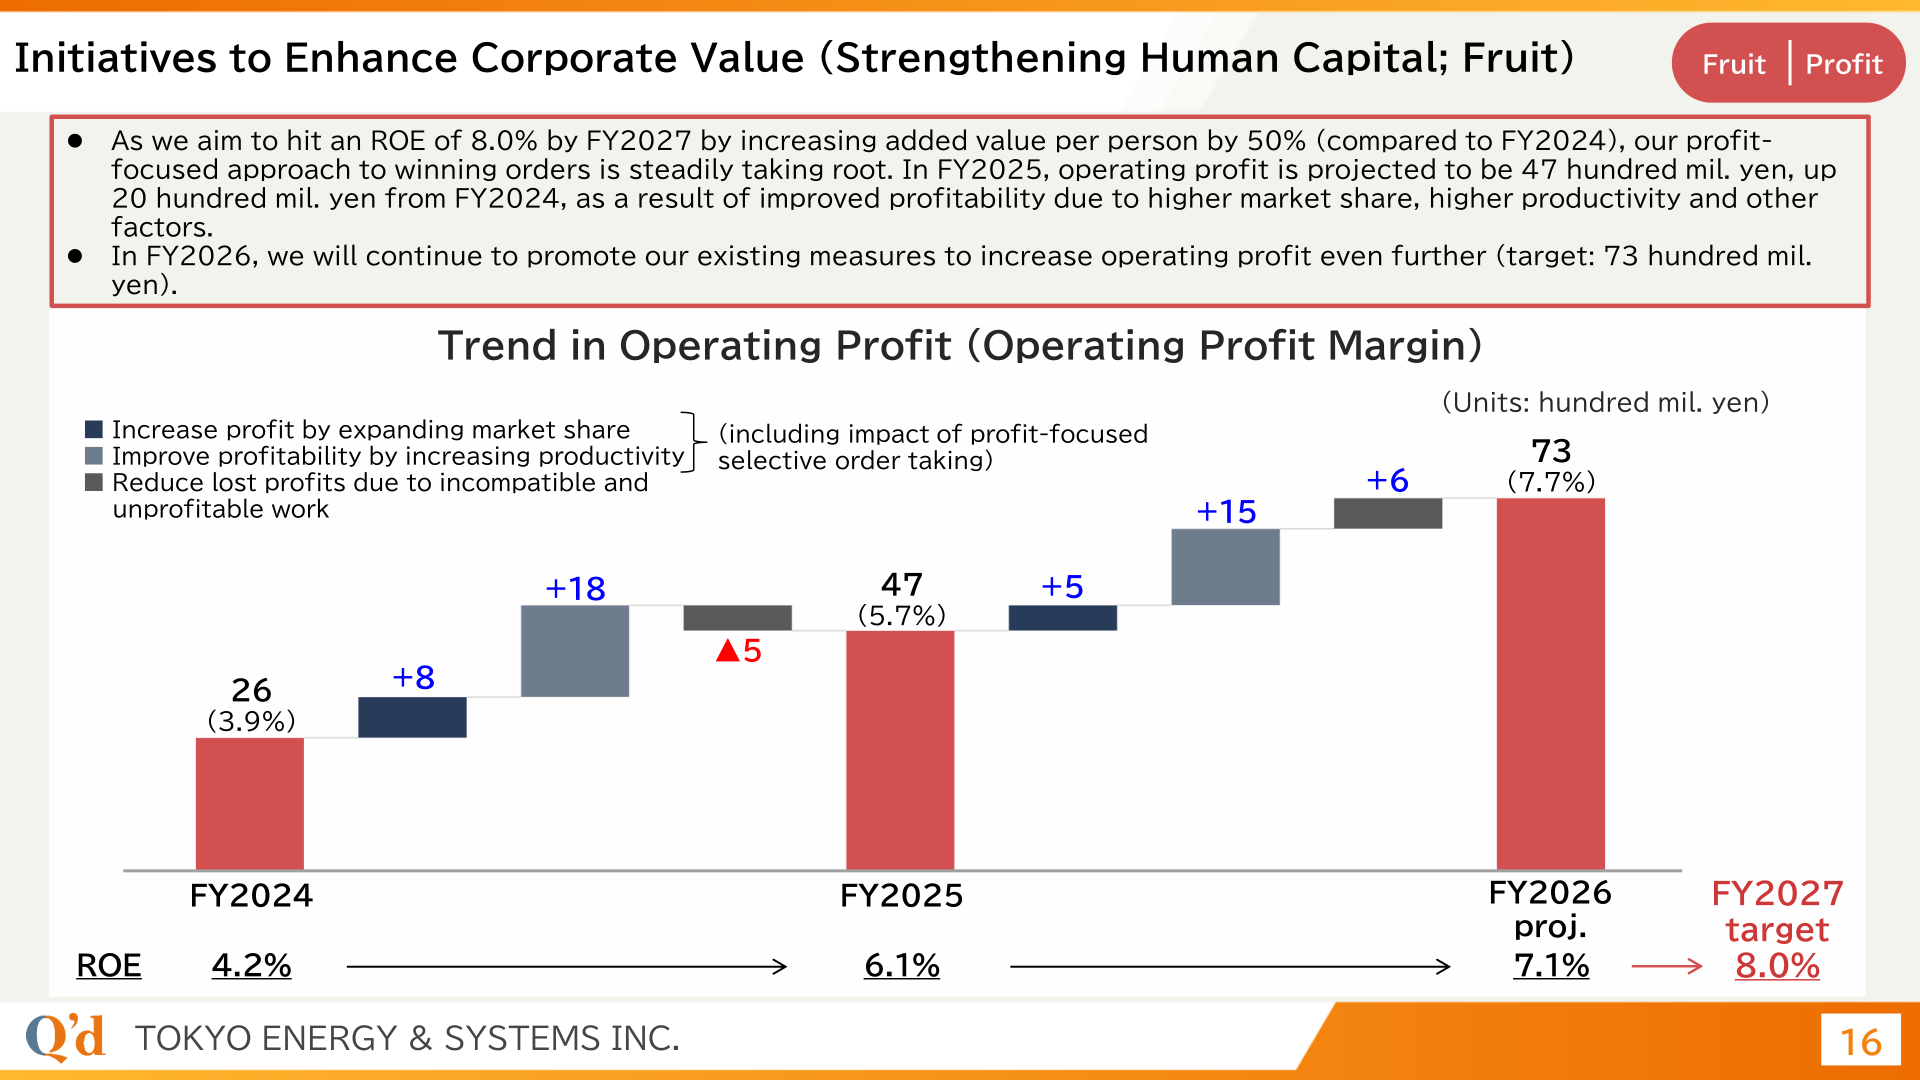
Operating profit rose from 26 hundred million yen (a 3.9% operating profit margin) in FY2024 to 47 hundred million yen (5.7%) in FY2025, and the company targets 73 hundred million yen (7.7%) in FY2026. ROE moved from 4.2% in FY2024 to 6.1% in FY2025, with 7.1% projected for FY2026 and a target of 8.0% by FY2027, supported by a goal of increasing added value per person by 50% compared with FY2024. The amount of projects carried forward to the next period has risen from 976 hundred million yen at the end of FY2023 to a record 1,449 hundred million yen at the end of FY2025, an increase of approximately 50%. Within that total, the nuclear power field stood at 180 hundred million yen and the substations field at 156 hundred million yen at the end of FY2025, with 273 hundred million yen and 158 hundred million yen respectively projected for the end of FY2026.
FY2026 Forecast
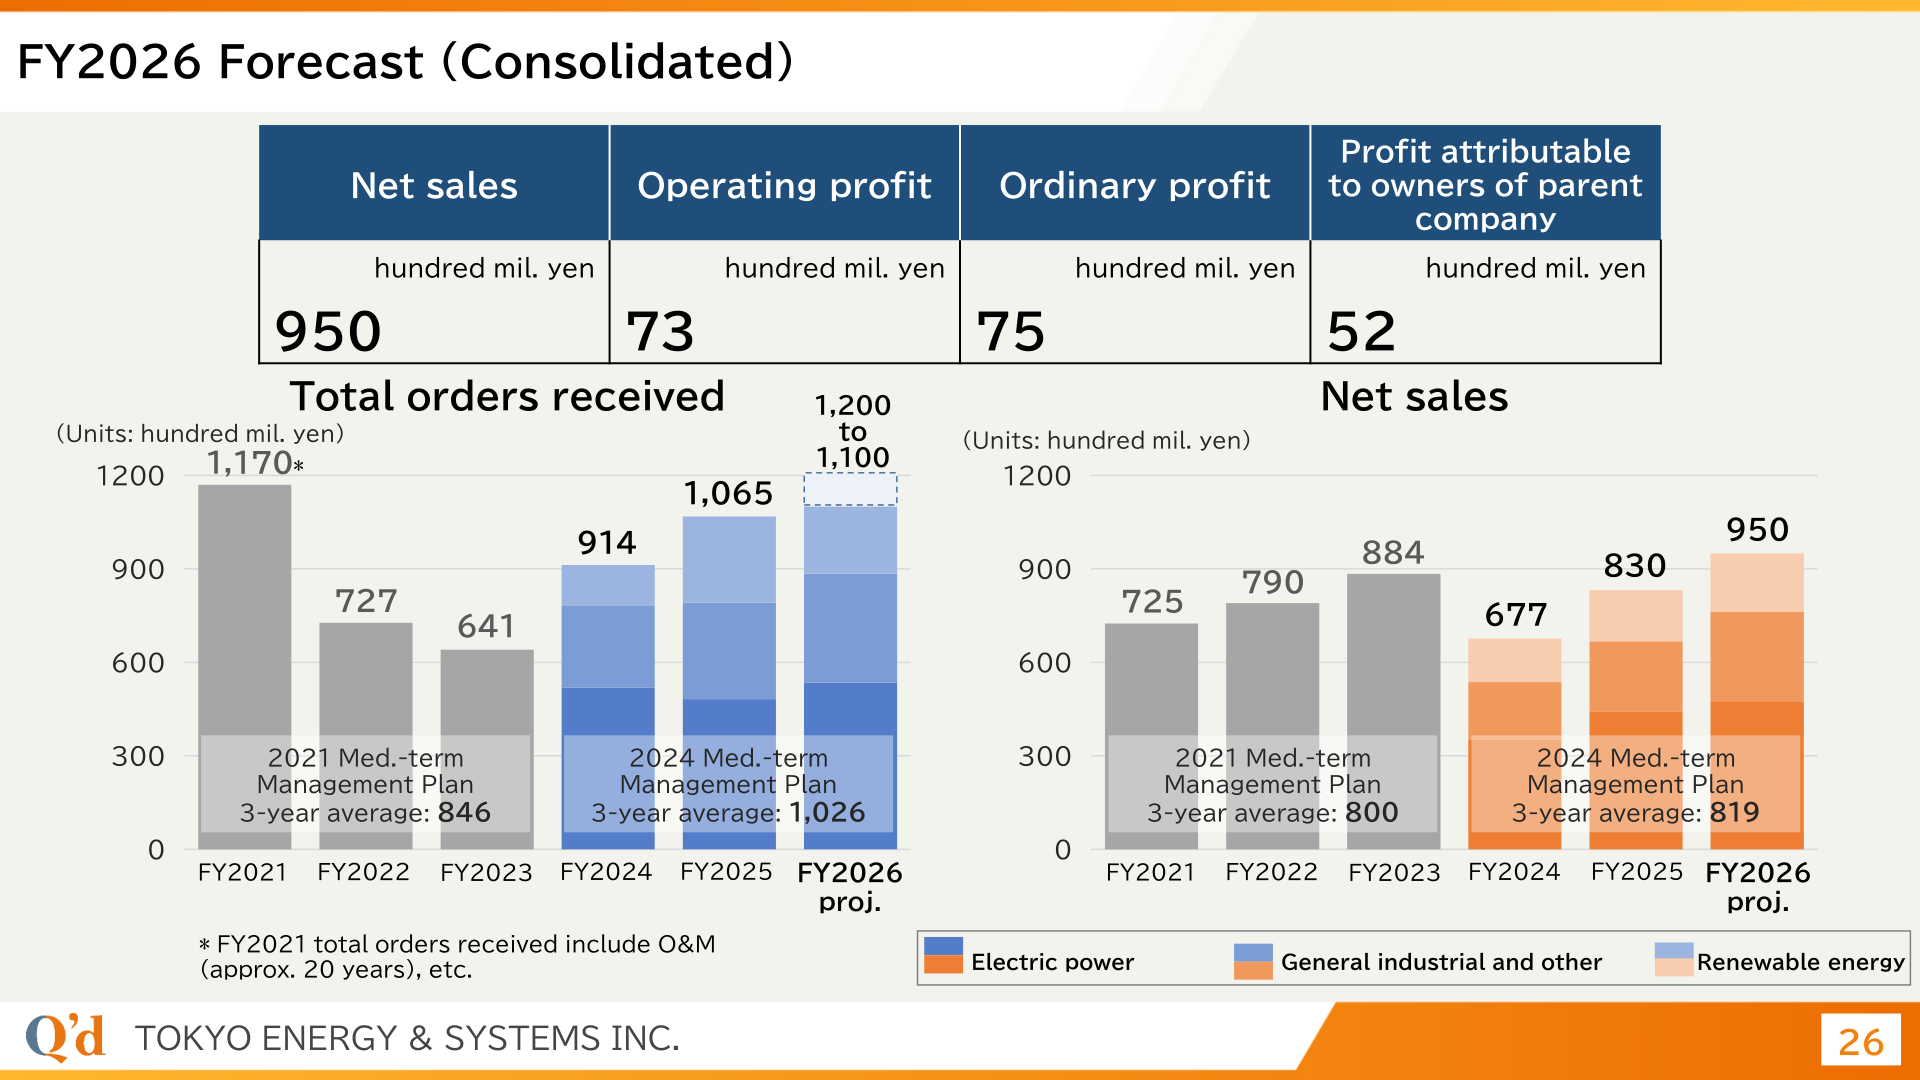
For FY2026 the company forecasts consolidated net sales of 950 hundred million yen, operating profit of 73 hundred million yen, ordinary profit of 75 hundred million yen, and profit attributable to owners of parent company of 52 hundred million yen. Total orders received are projected in a range of 1,100 to 1,200 hundred million yen. Under the 2024 Medium-term Management Plan the company shows a three-year average of 1,026 hundred million yen for total orders received and 819 hundred million yen for net sales.
| Item (hundred mil. yen) | FY2026 Forecast |
|---|---|
| Net sales | 950 |
| Operating profit | 73 |
| Ordinary profit | 75 |
| Profit attributable to owners of parent company | 52 |
| Total orders received | 1,100 to 1,200 |
Shareholder Returns
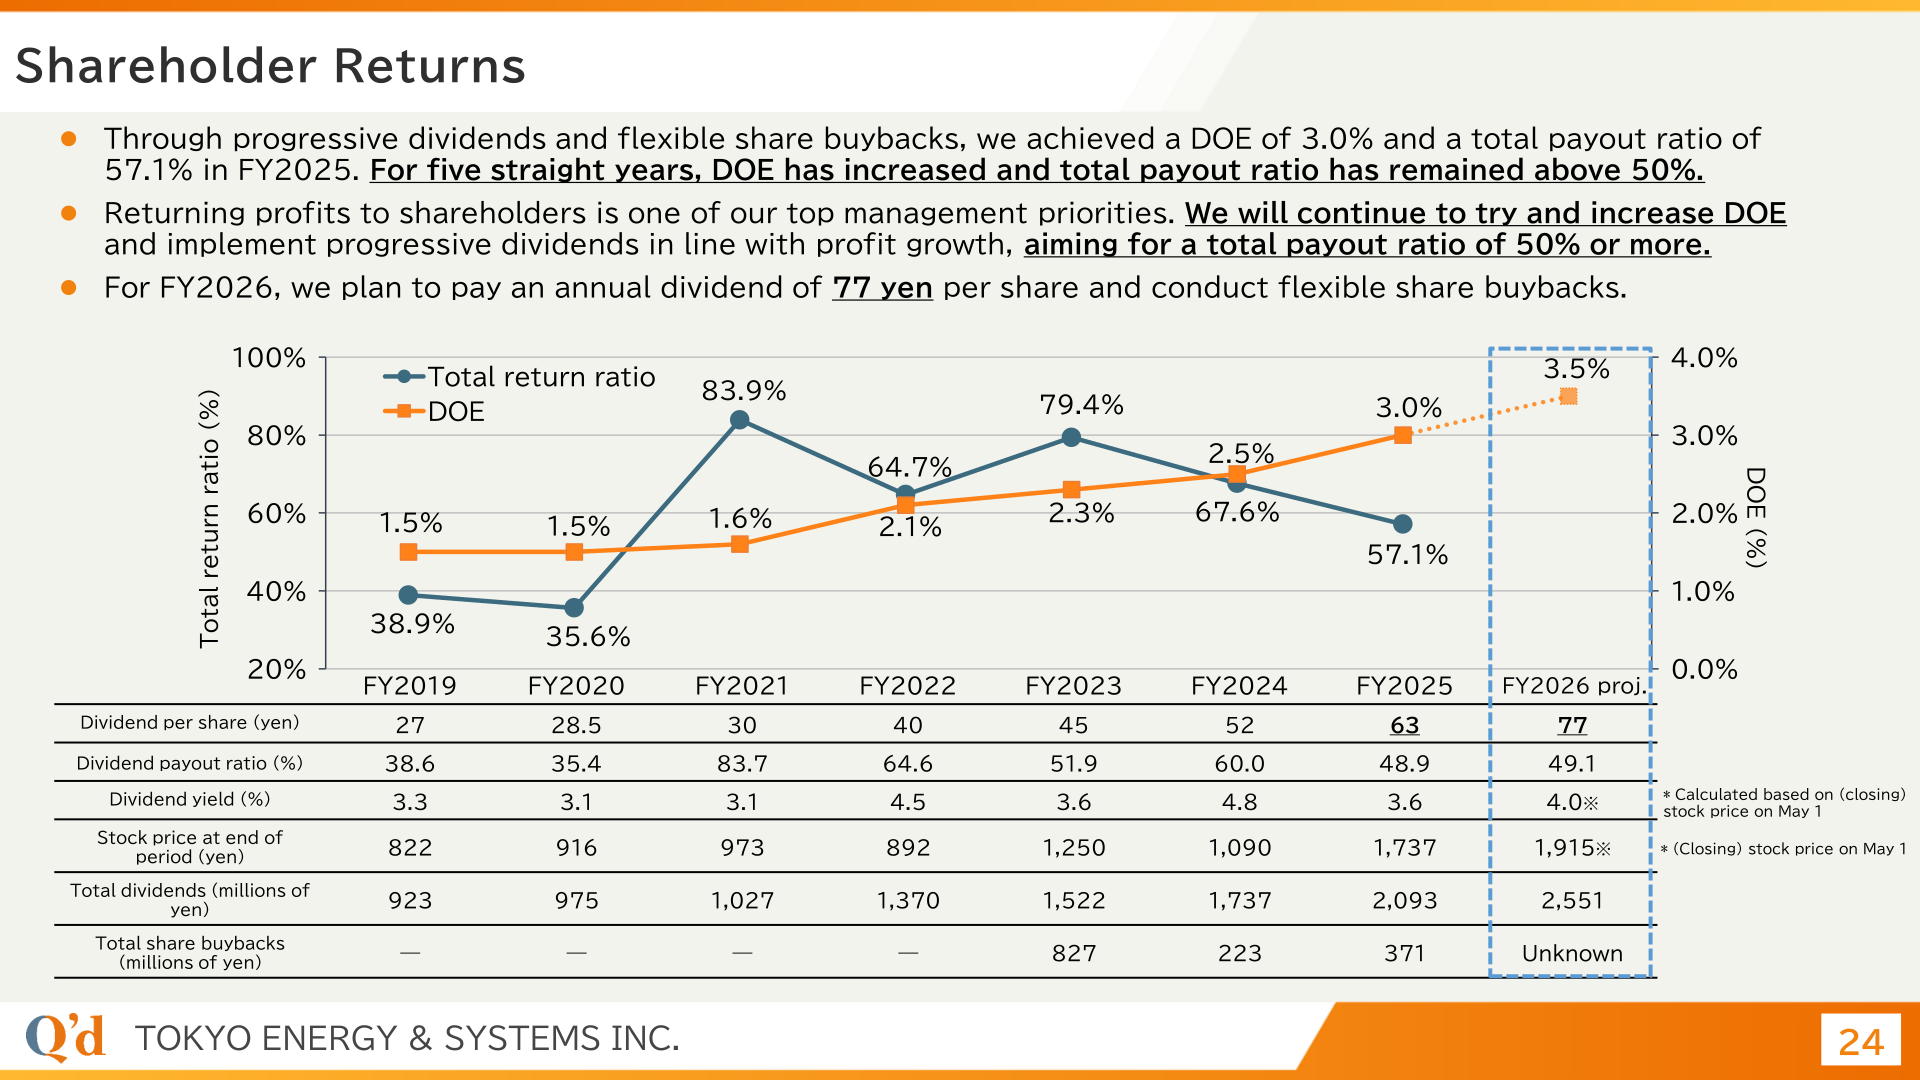
Through progressive dividends and flexible share buybacks, the company achieved a DOE of 3.0% and a total payout ratio of 57.1% in FY2025, and states that DOE has increased and the total payout ratio has remained above 50% for five straight years. It describes returning profits to shareholders as one of its top management priorities and says it will continue to try to increase DOE and implement progressive dividends in line with profit growth, aiming for a total payout ratio of 50% or more. For FY2026 it plans an annual dividend of 77 yen per share together with flexible share buybacks. The FY2026 dividend yield and period-end stock price shown below are calculated based on the closing stock price on May 1.
| Item | FY2023 | FY2024 | FY2025 | FY2026 proj. |
|---|---|---|---|---|
| Dividend per share (yen) | 45 | 52 | 63 | 77 |
| Dividend payout ratio (%) | 51.9 | 60.0 | 48.9 | 49.1 |
| DOE (%) | 2.3 | 2.5 | 3.0 | 3.5 |
| Dividend yield (%) | 3.6 | 4.8 | 3.6 | 4.0 |
| Stock price at end of period (yen) | 1,250 | 1,090 | 1,737 | 1,915 |
| Total dividends (millions of yen) | 1,522 | 1,737 | 2,093 | 2,551 |
| Total share buybacks (millions of yen) | 827 | 223 | 371 | Unknown |
Medium-Term Plan and Capital Strategy
Under the 2024 Medium-term Management Plan the company frames capital allocation around generating cash from business operations and using leverage within the limits needed to maintain financial soundness (an equity ratio of 50% or higher), then directing it to growth investment and shareholder returns. Growth investment in FY2024-FY2025 totalled approximately 51 hundred million yen, of which approximately 26 hundred million yen was carbon-neutral business investment and approximately 25 hundred million yen fundamental investment; the FY2026 plan is approximately 68 hundred million yen, split between approximately 21 hundred million yen of CN business investment and approximately 47 hundred million yen of fundamental investment. Human capital investment was approximately 21 hundred million yen in FY2024-2025 with approximately 38 hundred million yen planned for FY2026. Reported human capital results for FY2025 include an engagement score of 72.9 points (up 2.1 points), 64 new graduate hires in FY2026 against 65 in FY2025, and a 56.6% proportion of employees holding a construction management engineer qualification (up 2.0%). The company targets 70% of net sales from carbon-neutral related business in FY2030.
On capital strategy, the company says that given the high shareholding ratio of its major shareholder it might not be eligible for inclusion in the TOPIX at its current free-float-based market capitalization, and that after dialogue with Tokyo Electric Power Company Holdings, Incorporated (TEPCO) it announced a secondary offering of its shares in February 2026. It states that it will remain an equity method affiliate of TEPCO after the offering. Its shareholder mix shifted between March 2025 and March 2026 as follows: Individual & Other 31% to 43%, Other Institutions 49% to 29%, Overseas Institutions 7% to 13%, Financial Instruments Business Operator 1% to 3%, and Financial Institutions 12% to 12%.
This article is an analysis based on publicly available information and is not a recommendation to buy or sell any specific securities. Investment decisions are your own responsibility.
















