
This article is based on publicly available IR materials and is not a recommendation to buy or sell any specific securities.
Note: Yamaura does not publish an English results presentation; this article is an English translation of the Japanese-language article on our sister site Investalk, which is based on the company’s Japanese-language IR materials, with figures transcribed as reported. The source labels the fiscal year ended March 31, 2026 as FY2025, which matches this site’s classification, and the source labels are retained in the body text and tables. Yen amounts that the source states in units of hundred-million yen are rendered in billions of yen; amounts stated in millions of yen are kept in millions of yen.
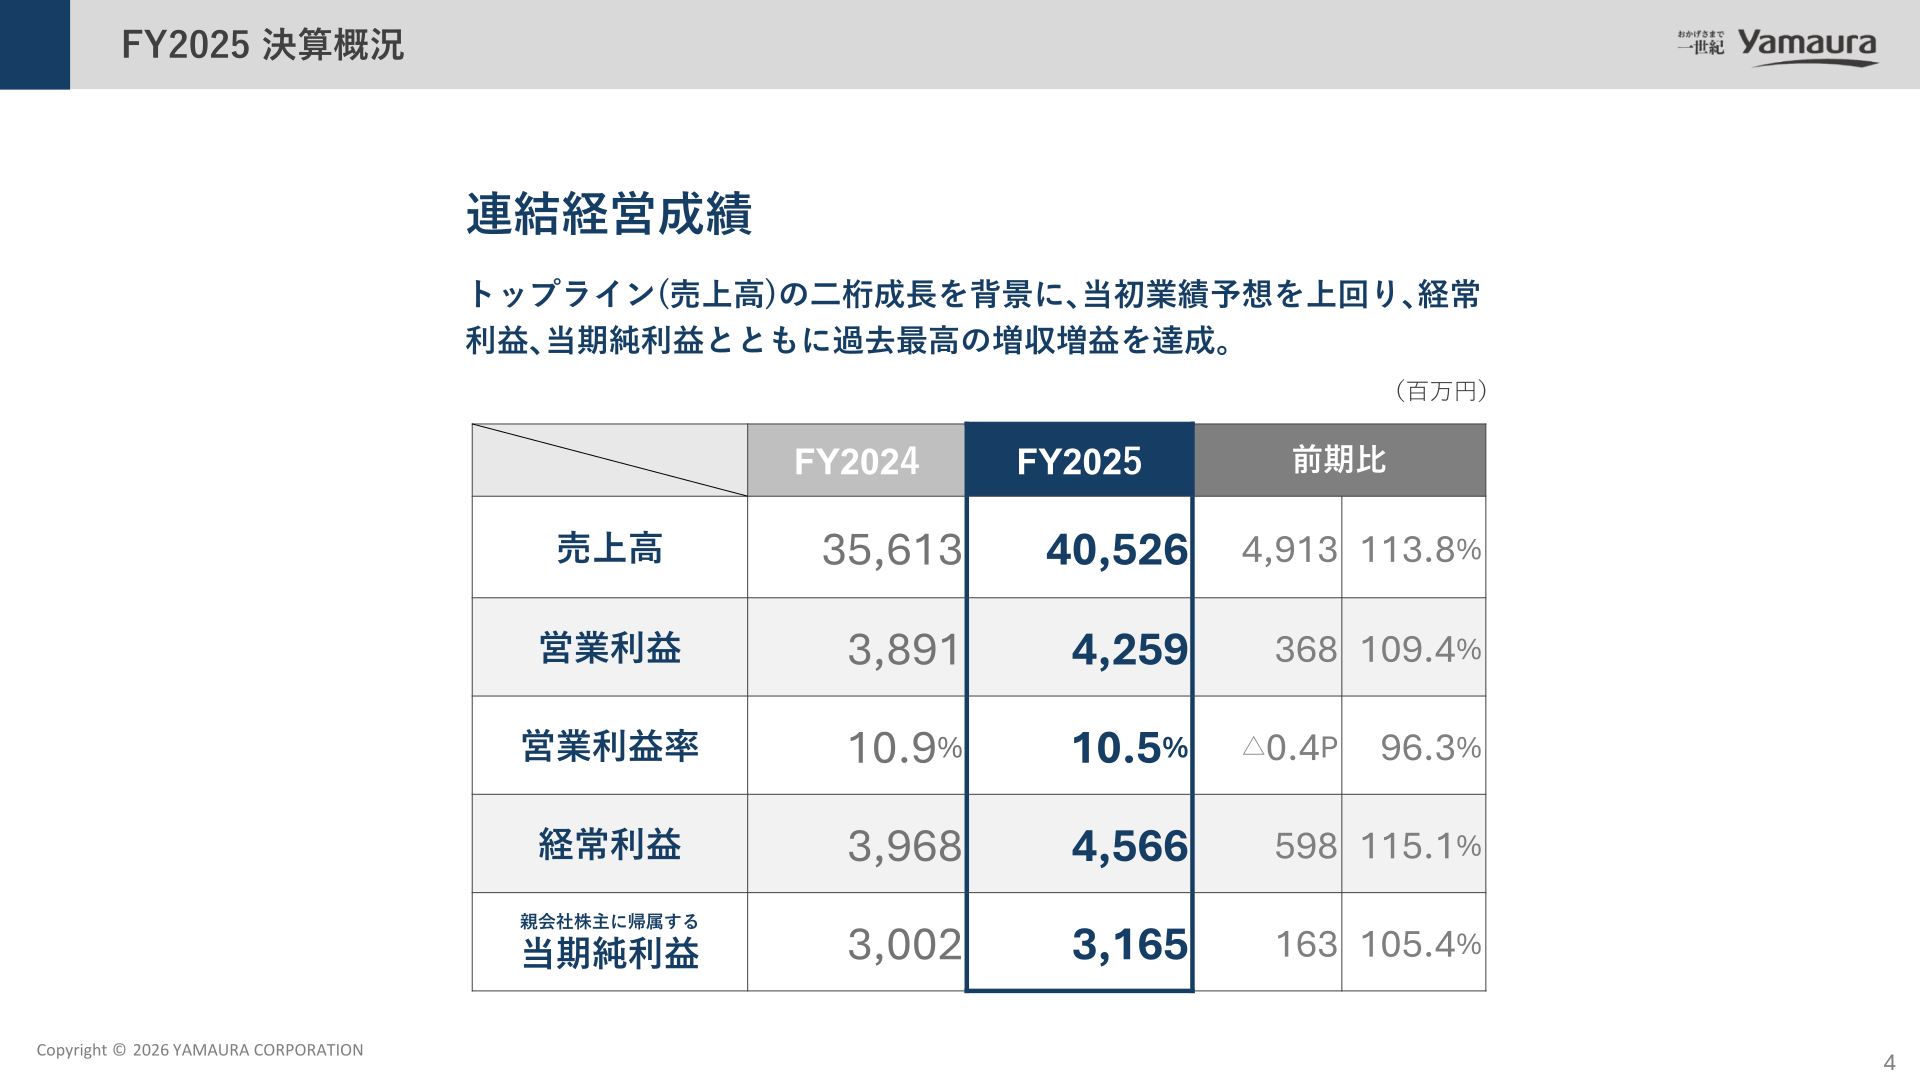
For the fiscal year ended March 31, 2026 (FY2025), Yamaura’s consolidated results came in with both higher revenue and higher profit: net sales of 40.526 billion yen (up 4.913 billion yen, or +13.8%, year on year), operating profit of 4.259 billion yen (up 368 million yen, +9.4%), ordinary profit of 4.566 billion yen (+15.1%), and profit attributable to owners of parent of 3.165 billion yen (up 163 million yen, +5.4%). The materials explain that the branding strategy for corporate buildings such as factories and warehouses worked well and contributed substantially to earnings, and that progress on large-scale construction projects also contributed, so that net sales, ordinary profit and profit attributable to owners of parent all set record highs. For the following year, FY2026, the company expects higher revenue but lower profit, while planning to further strengthen shareholder returns and improve capital efficiency through a share buyback with a total acquisition price of up to 1.6 billion yen and a fourth consecutive annual dividend increase (annual dividend per share from 30 yen to 36 yen).
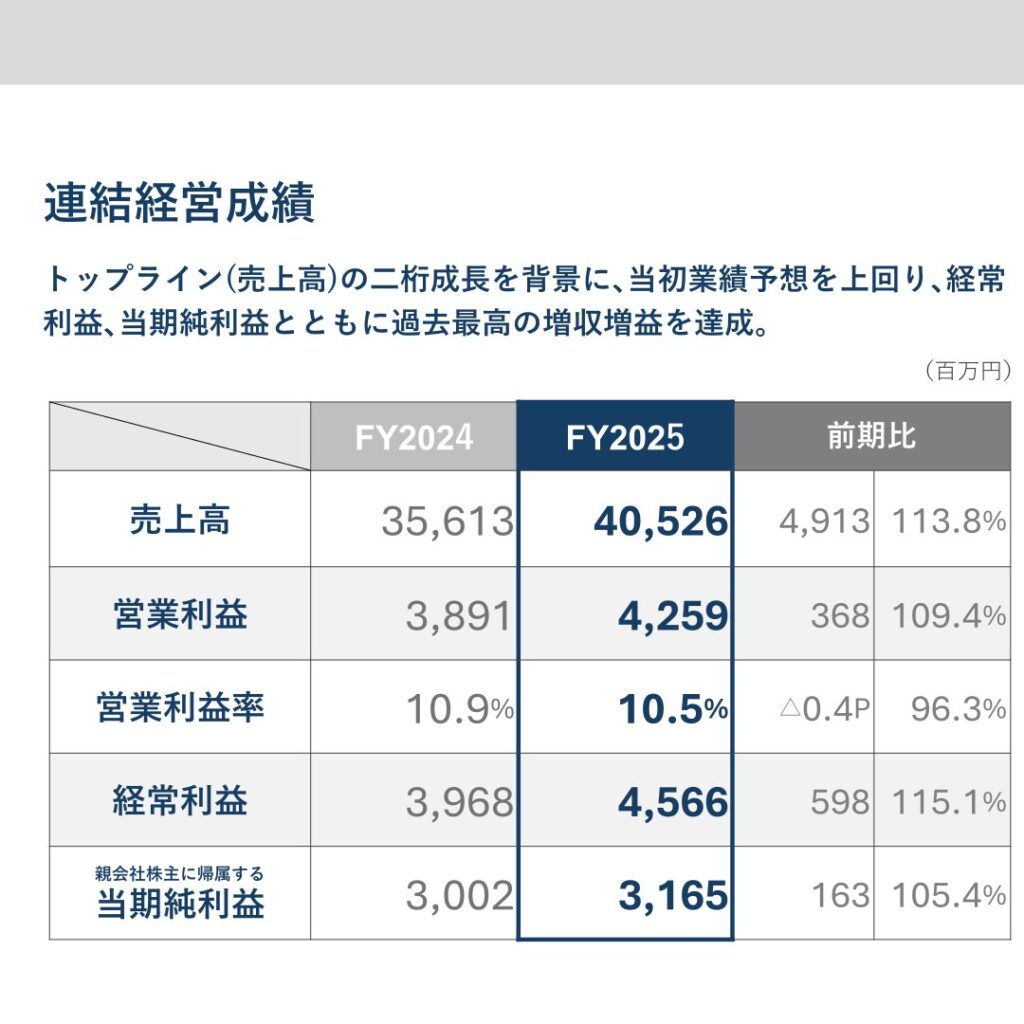
Consolidated Results (FY2025 Actual, Year Ended March 31, 2026)
Backed by double-digit growth in the top line (net sales), results exceeded the initial earnings forecast, and together with ordinary profit and profit attributable to owners of parent the company achieved record-high revenue and profit growth. A higher cost-of-sales ratio pushed the gross profit margin down from 19.8% to 18.4%, and the operating margin declined 0.4 points from 10.9% to 10.5%; however, an increase in non-operating income (from 96 million yen to 321 million yen) lifted ordinary profit by 15.1%.
| Item (millions of yen) | FY2025 (This Period) | FY2024 (Previous Period) | Change |
|---|---|---|---|
| Net sales | 40,526 | 35,613 | 4,913 / 113.8% |
| Cost of sales | 33,030 | 28,535 | 4,495 |
| Gross profit | 7,496 | 7,078 | 418 |
| Selling, general and administrative expenses | 3,237 | 3,187 | 50 |
| Operating profit | 4,259 | 3,891 | 368 / 109.4% |
| Operating margin | 10.5% | 10.9% | △0.4P / 96.3% |
| Ordinary profit | 4,566 | 3,968 | 598 / 115.1% |
| Profit attributable to owners of parent | 3,165 | 3,002 | 163 / 105.4% |
On the financial position, cash and deposits decreased from 12.240 billion yen to 8.839 billion yen as a result of growth investment and shareholder returns such as dividends, while total assets expanded by 5.160 billion yen from the end of the previous fiscal year (from 30,835 million yen to 36,007 million yen) on factors including an increase in accounts receivable from completed construction contracts. The equity ratio fell 2.8 points from 75.5% to 72.7%, and the materials state that the company will continue to aim for the medium-term plan target of 70% through shareholder returns and the use of financial leverage. Per-share and return indicators were EPS of 167.22 yen (previous fiscal year: 158.63 yen), BPS of 1,383.24 yen (1,229.39 yen), ROE of 12.8% (13.7%), a dividend payout ratio of 17.9% (15.1%), DOE of 2.3% (2.1%) and PBR of 1.10 times (0.98 times), and the company explains that it secured profitability above the 9% cost of capital that it recognizes.
Segment Results
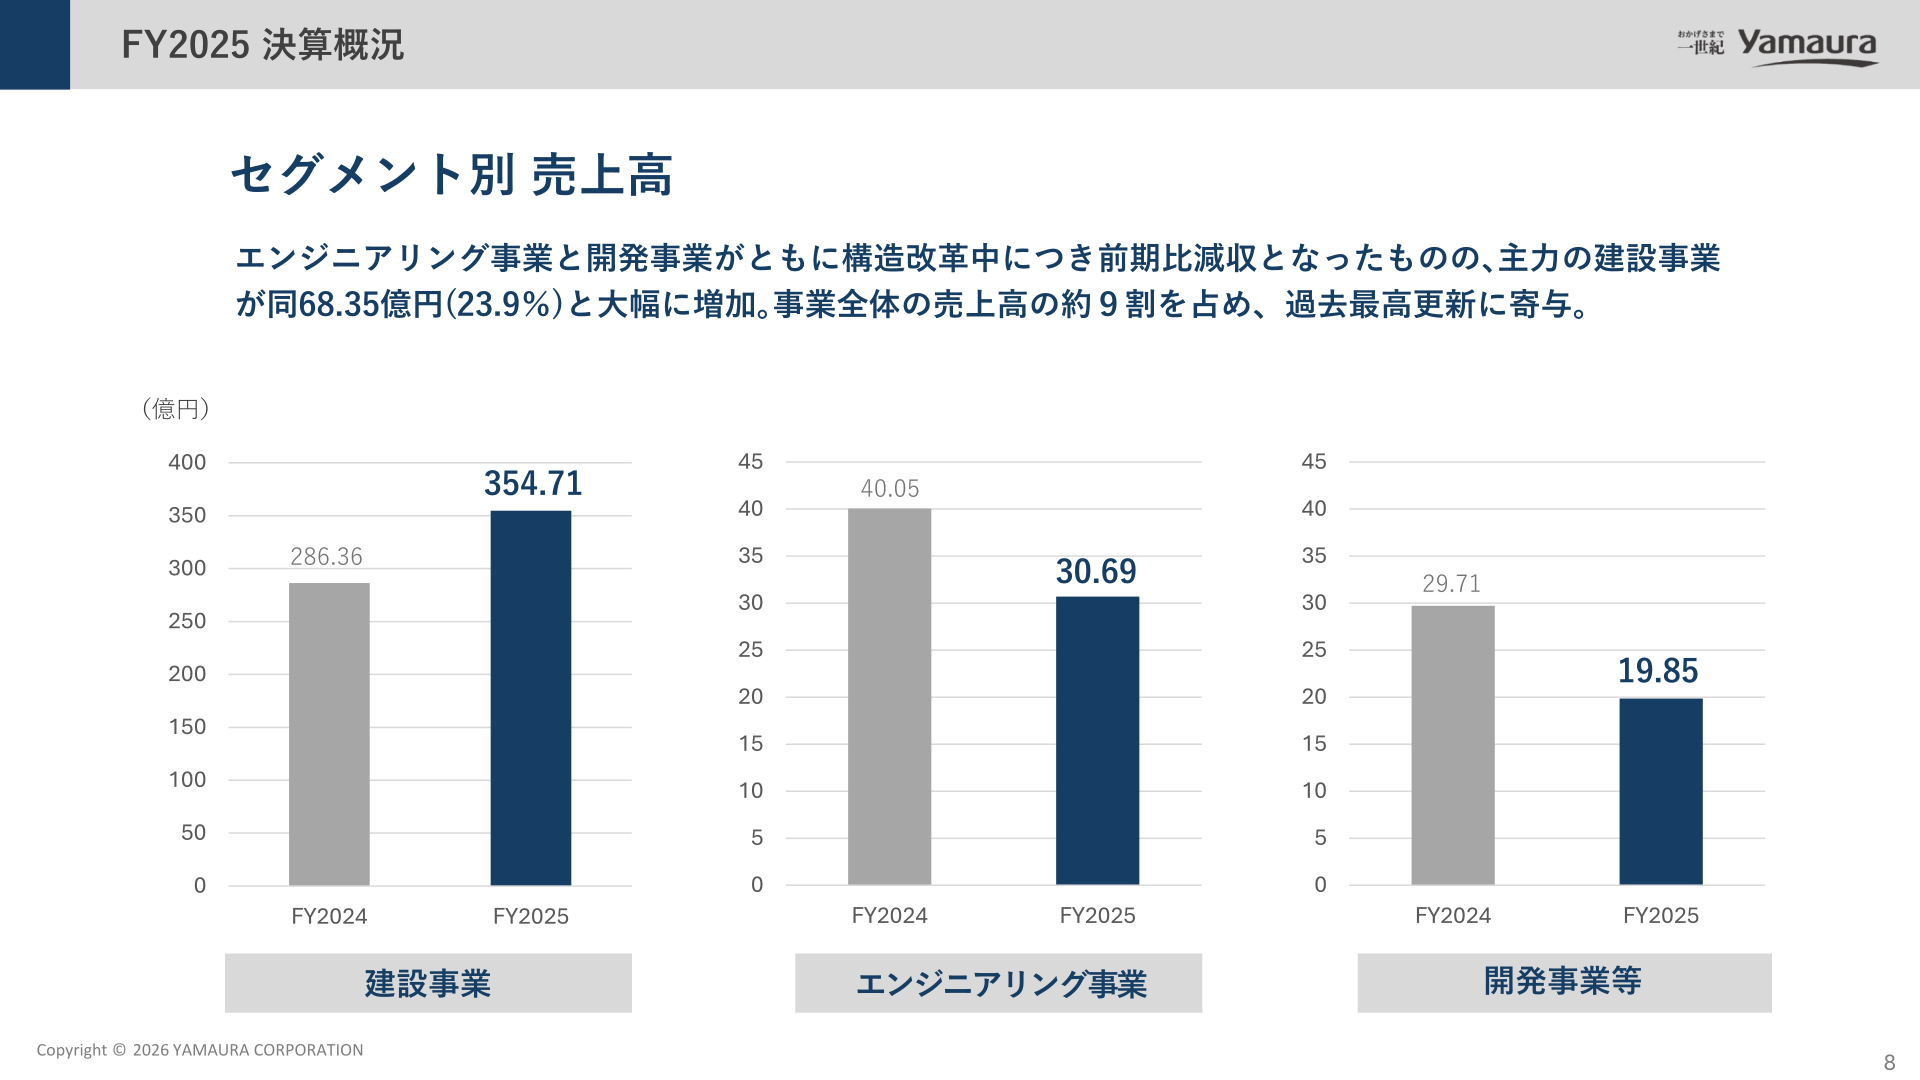
Both the engineering business and the development business posted lower net sales year on year as they are in the middle of structural reform, but the mainstay construction business grew sharply, by 6.835 billion yen (23.9%) year on year. The construction business accounts for roughly nine-tenths of total net sales across the businesses and contributed to the record high.
| Segment | Metric | FY2025 (This Period) | FY2024 (Previous Period) |
|---|---|---|---|
| Construction business | Net sales | 35.471 billion yen | 28.636 billion yen |
| Engineering business | Net sales | 3.069 billion yen | 4.005 billion yen |
| Development business and other | Net sales | 1.985 billion yen | 2.971 billion yen |
Looking at the annual trend in construction-related figures, orders received for construction were 40.8 billion yen (total of 40,820 million yen), up 17.1% year on year, with the building construction segment driving the whole and keeping the level high. Net sales of completed construction contracts were 39.0 billion yen (total of 39,004 million yen), an increase of 6.0 billion yen year on year, as progress on building and civil engineering works lifted revenue. Construction work carried over to the next fiscal year was 36.9 billion yen (total of 36,908 million yen), up 1.8 billion yen year on year and the highest level in the past five years. With the order backlog accumulating mainly in building construction and engineering, the company describes its future revenue base (earnings continuity) as solid.
Full-Year Forecast (FY2026)
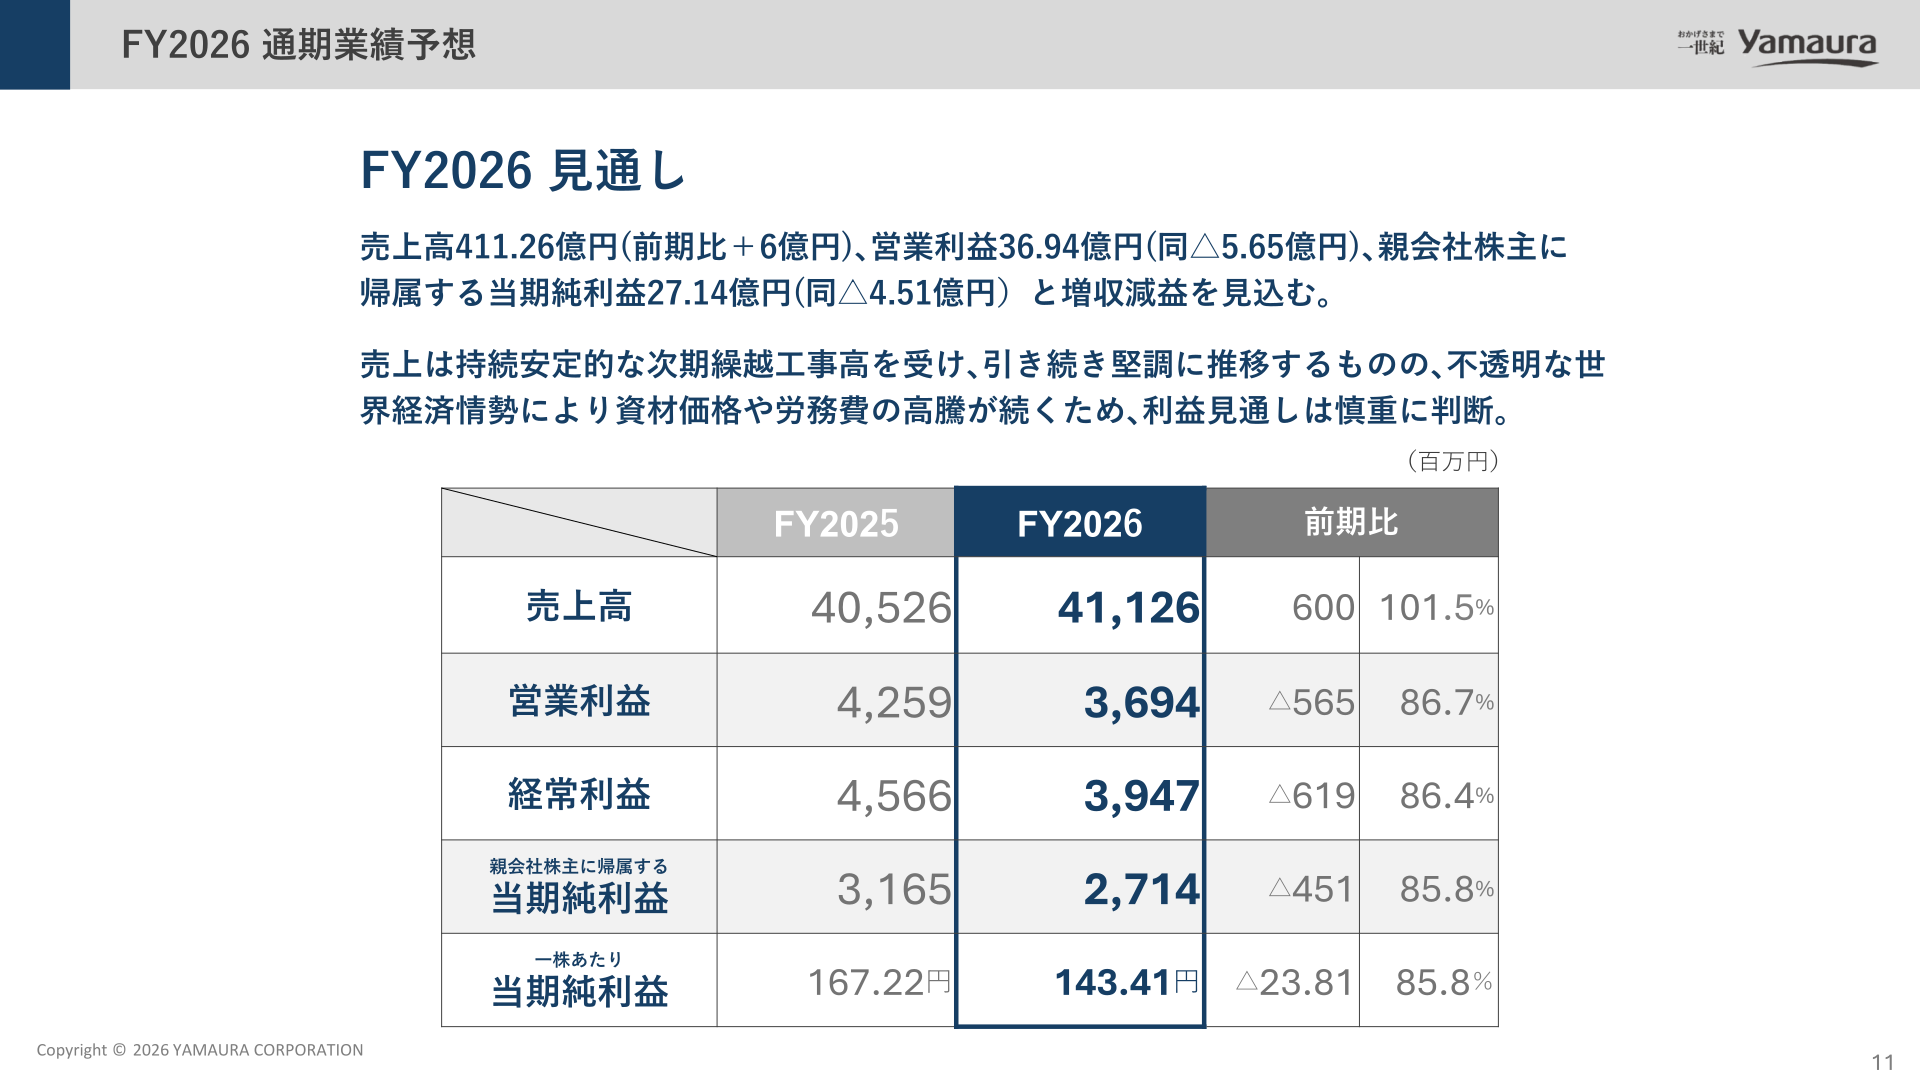
For FY2026 the company expects net sales of 41.126 billion yen (up 600 million yen year on year), operating profit of 3.694 billion yen (down 565 million yen), ordinary profit of 3.947 billion yen (down 619 million yen) and profit attributable to owners of parent of 2.714 billion yen (down 451 million yen), that is, higher revenue and lower profit. It states that while net sales should continue to be firm on the back of a sustained and stable level of construction work carried over, it judged the profit outlook conservatively because materials prices and labor costs keep rising amid an opaque global economic environment.
| Item (millions of yen) | FY2026 (Forecast) | FY2025 (Actual) | Change |
|---|---|---|---|
| Net sales | 41,126 | 40,526 | 600 / 101.5% |
| Operating profit | 3,694 | 4,259 | △565 / 86.7% |
| Ordinary profit | 3,947 | 4,566 | △619 / 86.4% |
| Profit attributable to owners of parent | 2,714 | 3,165 | △451 / 85.8% |
| Earnings per share | 143.41 yen | 167.22 yen | △23.81 / 85.8% |
Shareholder Returns
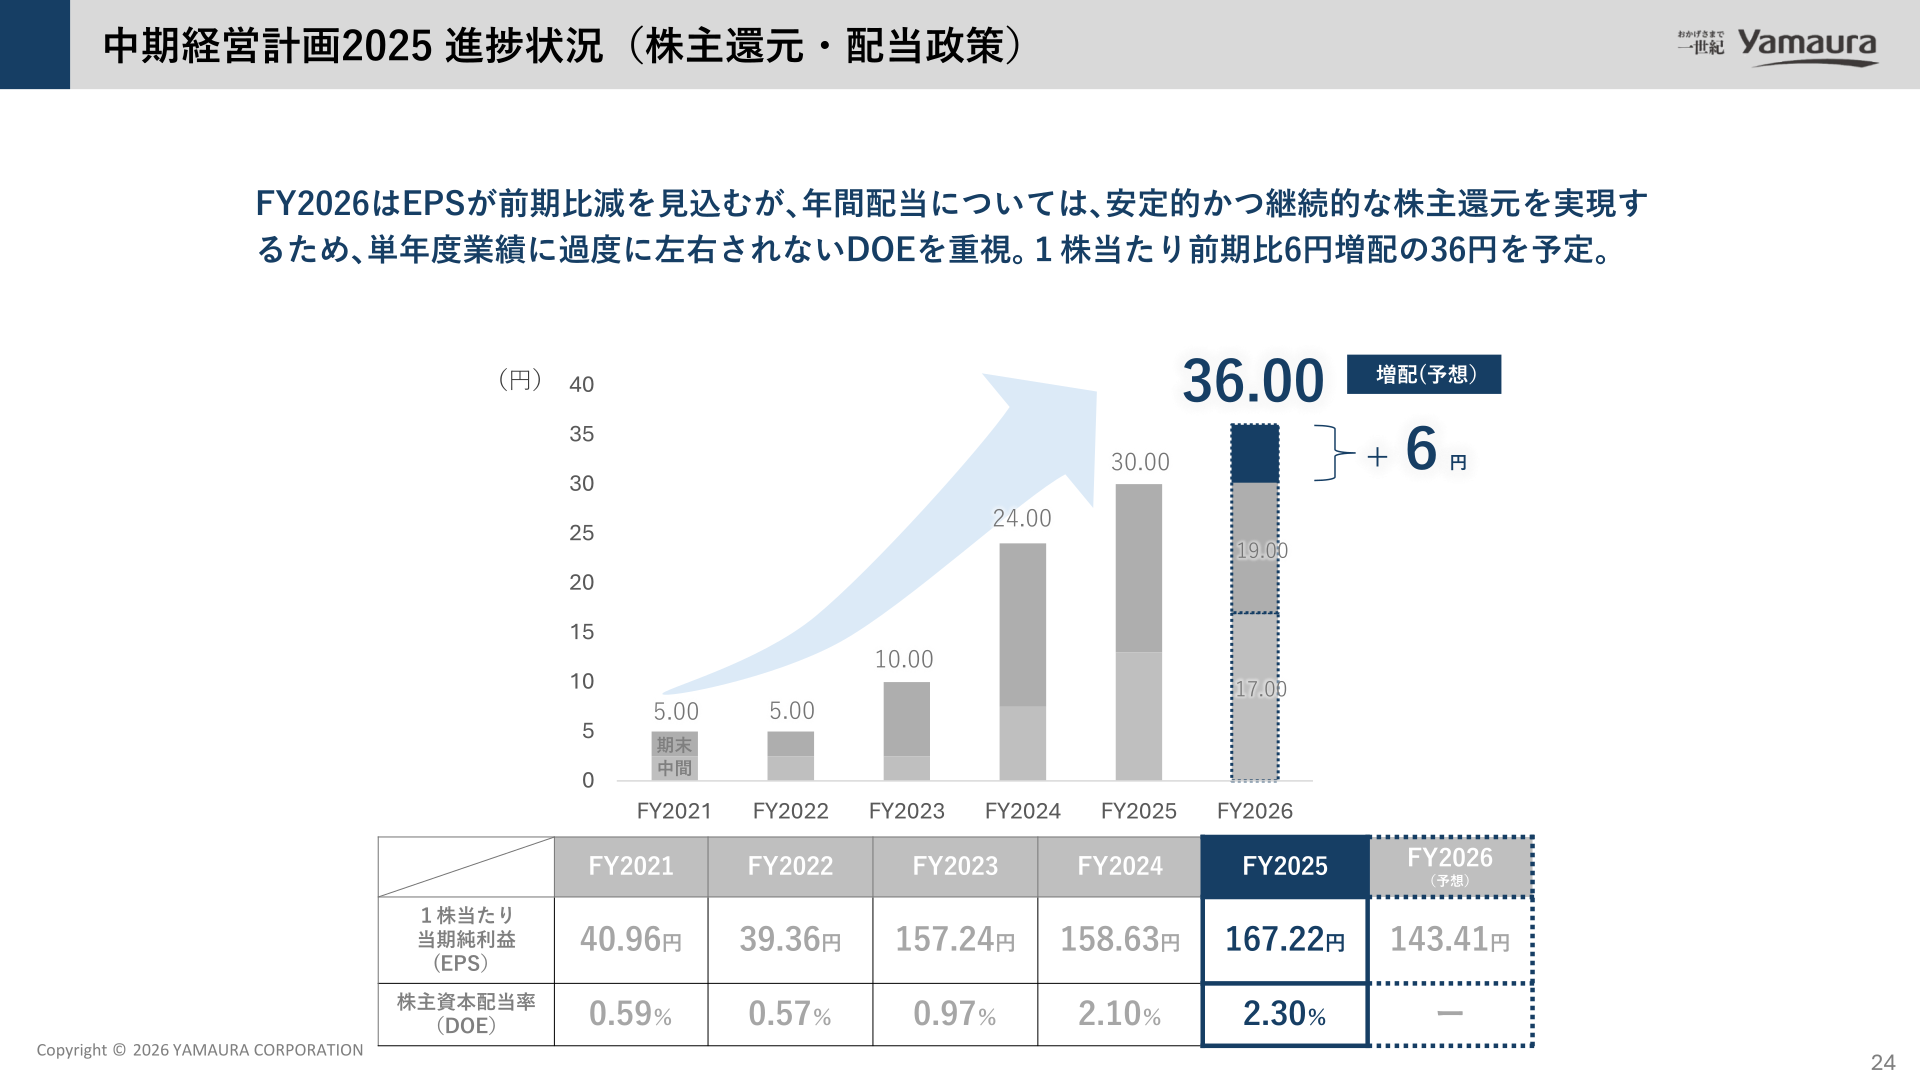
Although EPS is expected to decline year on year in FY2026, for the annual dividend the company places emphasis on DOE, which is not excessively swayed by single-year earnings, in order to deliver stable and continuous shareholder returns, and plans 36 yen per share, an increase of 6 yen from the previous fiscal year. In addition, it plans to carry out a share buyback with a total acquisition price of up to 1.6 billion yen, aiming to further strengthen shareholder returns and improve capital efficiency. In its cash allocation, the FY26 budget sets out a shareholder return framework of 1.5 billion to 1.8 billion yen for dividends (DOE of 2% to 3%), 2.0 billion yen for share buybacks and 200 million yen for the shareholder benefit program.
| Item | FY2025 (Actual) | FY2026 (Forecast) |
|---|---|---|
| Annual dividend per share | 30.00 yen | 36.00 yen |
| Earnings per share (EPS) | 167.22 yen | 143.41 yen |
| Dividend on equity (DOE) | 2.30% | — |
| Dividend payout ratio | 17.9% | Not disclosed |
Progress on Medium-Term Management Plan 2025
On the KPIs of Medium-Term Management Plan 2025, both net sales and profit have already reached levels close to the targets for the final year of the plan (FY2027), but taking geopolitical and other risks into account the company will leave the plan figures unchanged for the time being. On capital policy and indicators, it explains that in FY2025 ROE declined temporarily as shareholders’ equity increased, yet was kept above the cost of shareholders’ equity, and that PBR improved to above 1x. The FY2027 KGIs are net sales of 41.3 billion yen, net profit of 3.50 billion yen, ROE of 14.0%, DOE of 3.0%, an equity ratio of 70.0% and 480 employees, against FY2025 actuals of 40.5 billion yen, 3.16 billion yen, 12.8%, 2.3%, 72.7% and 458 employees respectively.
In its growth strategy, the company launched a Management Strategy Headquarters in April 2026 and placed four departments under it — the Management Strategy Office, the Real Estate Development Department, the IR Promotion Section and the New Business Development Project — and it also newly established a Business Administration Headquarters to strengthen coordination among the three business divisions and maximize synergies. Among individual projects, it concluded a business alliance agreement with TOSYS Co., Ltd. in the data center field and announced a next-generation data center, regionally distributed NAGANO model. In public-private partnership projects, it is advancing the Kitahotaka Industrial Park in Azumino City, Nagano Prefecture (total project cost of approximately 3.0 billion yen, target land area of 15 ha, with a target contract amount of approximately 7.0 billion yen) and the Tomi City lodging and exchange base development and operation project (construction contract amount of 2.0 billion yen (estimate), with expected annual sales of 600 million yen from the third year of operation). In the real estate income business, it set out a policy of working on stock businesses and value-up projects.
This article is an analysis based on publicly available information and is not a recommendation to buy or sell any specific securities. Investment decisions are your own responsibility.
















