
This article is based on publicly available IR materials and is not a recommendation to buy or sell any specific securities.
Shofu Inc., the Kyoto-based maker of dental materials and equipment, reported net sales of ¥39,994 million for the fiscal year ended March 31, 2026, up 3.3% year on year and a record high, as growth in restorative materials and CAD/CAM-related materials offset weakness in some products, including artificial teeth. Operating profit declined 3.1% to ¥5,226 million as the company continued upfront investment in workforce expansion, R&D, and production and supply system enhancement, but ordinary profit rose 6.1% to ¥5,859 million and profit attributable to owners of parent rose 13.2% to ¥4,887 million, both record highs. For the following fiscal year, Shofu forecasts net sales of ¥42,958 million and a rebound in operating profit to ¥6,003 million, while profit is expected to decline slightly to ¥4,756 million.
Note: Shofu Inc.’s own presentation materials label the fiscal year ended March 31, 2026 as “FY2026” (using the fiscal year-end calendar year) and the following fiscal year as “FY27”; this article’s title and slug follow japan-equity.com’s site convention of referring to the most recently completed fiscal year as FY2025, while all figures, table headers, and segment labels below retain the company’s original FY2026/FY27 labeling as presented in the source material.
Consolidated Results (FY2026 Actual)
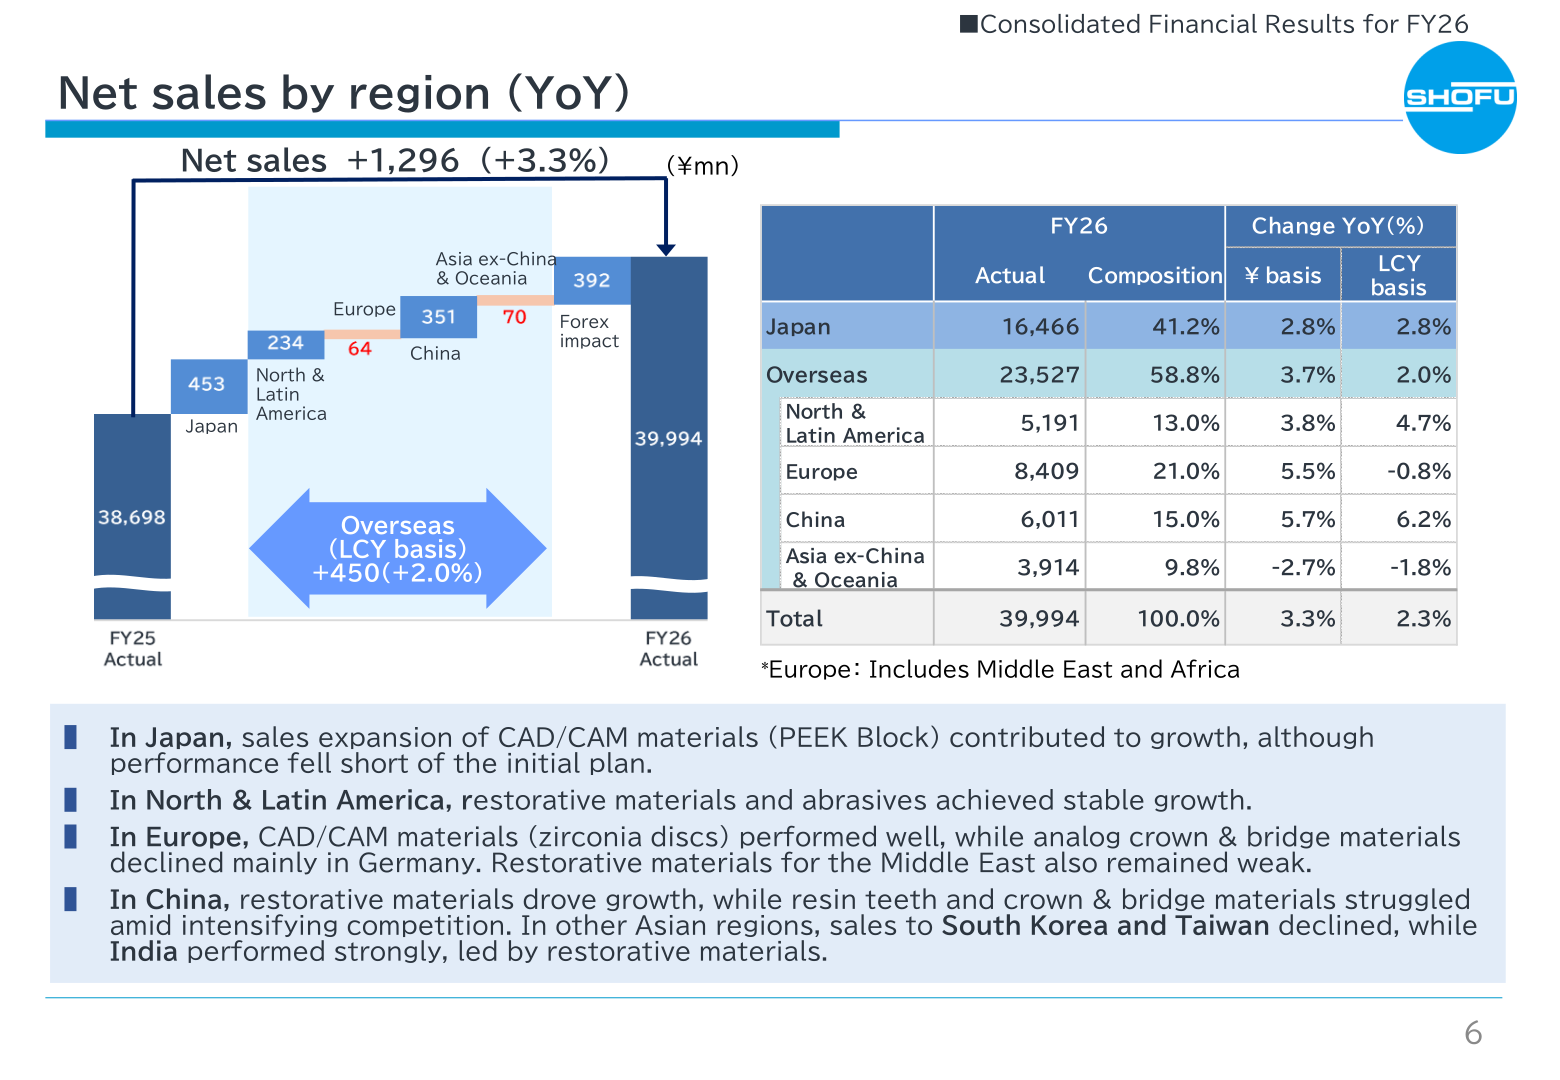
Despite some products, including artificial teeth, being affected by intensified competition, sales increased mainly on growth in restorative materials and CAD/CAM-related materials. Overseas sales varied by region, with North America and India supporting overall performance; foreign exchange effects also contributed to sales growth (translation effect on net sales: +¥392 million vs. FY25). Operating profit of ¥5,226 million was achieved while the company continued upfront investments in workforce expansion, R&D, and production/supply system enhancement.
| Item | FY25 (Actual) | FY26 (Actual) | Change YoY | FY26 (Forecast, as of prior guidance) |
|---|---|---|---|---|
| Net sales | 38,698 (100.0%) | 39,994 (100.0%) | +1,296 (+3.3%) | 40,876 (achieved 97.8%) |
| (Domestic sales) | 16,012 (41.4%) | 16,466 (41.2%) | +454 (+2.8%) | 16,931 (achieved 97.3%) |
| (Overseas sales) | 22,685 (58.6%) | 23,527 (58.8%) | +841 (+3.7%) | 23,945 (achieved 98.3%) |
| Gross profit | 22,991 (59.4%) | 23,740 (59.4%) | +749 (+3.3%) | 24,253 (achieved 97.9%) |
| (SG&A) | 17,599 (45.5%) | 18,513 (46.3%) | +914 (+5.2%) | 19,016 (achieved 97.4%) |
| Operating profit | 5,392 (13.9%) | 5,226 (13.1%) | -165 (-3.1%) | 5,236 (achieved 99.8%) |
| Ordinary profit | 5,523 (14.3%) | 5,859 (14.7%) | +336 (+6.1%) | 5,363 (achieved 109.3%) |
| Profit | 4,317 (11.2%) | 4,887 (12.2%) | +570 (+13.2%) | 4,701 (achieved 104.0%) |
| EPS (¥) | 121.52 | 137.38 | +15.86 | |
| ROE | 10.3% | 10.7% | +0.5% |
Segment Results
By product category, Chemical Products (restorative materials and CAD/CAM-related materials) led growth, while Artificial Teeth Products declined as a fall in core products exceeded growth in new products, and Machinery, Equipment & Other Products decreased on a reactionary decline following strong CAD/CAM equipment demand in the prior year. By region, Japan grew on expanded CAD/CAM materials (PEEK Block) sales though it fell short of the initial plan; North & Latin America achieved stable growth in restorative materials and abrasives; Europe saw CAD/CAM materials (zirconia discs) perform well while analog crown & bridge materials declined, mainly in Germany; and in China, restorative materials drove growth while resin teeth and crown & bridge materials struggled amid competition, with India performing strongly in other parts of Asia.
| Product Category | FY26 Actual (¥mn) | Composition | Change YoY (¥ basis) | Change YoY (LCY basis) |
|---|---|---|---|---|
| Artificial Teeth Products | 7,176 | 17.9% | +1.9% | -0.2% |
| Abrasive Products | 5,803 | 14.5% | +3.8% | +3.2% |
| Metal Products | 189 | 0.5% | +27.9% | +27.9% |
| Chemical Products | 14,270 | 35.7% | +11.2% | +10.2% |
| Cement Products | 3,350 | 8.4% | -3.9% | -4.2% |
| Machinery, Equipment & Other Products | 6,880 | 17.2% | -5.1% | -5.9% |
| Dental Business total | 37,669 | 94.2% | +3.6% | +2.6% |
| Nail Care & Other Business | 2,324 | 5.8% | -0.7% | -1.8% |
| Total | 39,994 | 100.0% | +3.3% | +2.3% |
| Region | FY26 Actual (¥mn) | Composition | Change YoY (¥ basis) | Change YoY (LCY basis) |
|---|---|---|---|---|
| Japan | 16,466 | 41.2% | +2.8% | +2.8% |
| Overseas | 23,527 | 58.8% | +3.7% | +2.0% |
| North & Latin America | 5,191 | 13.0% | +3.8% | +4.7% |
| Europe | 8,409 | 21.0% | +5.5% | -0.8% |
| China | 6,011 | 15.0% | +5.7% | +6.2% |
| Asia ex-China & Oceania | 3,914 | 9.8% | -2.7% | -1.8% |
| Total | 39,994 | 100.0% | +3.3% | +2.3% |
Financial Forecasts for FY27
Shofu expects net sales to reach a further record high in FY27, with operating profit growing steadily while profit is expected to decline, mainly because a one-off gain from the sale of metal inventory (product portfolio restructuring) recorded in FY26 will not recur and tax expenses are expected to increase by approximately ¥300 million year on year. The impact of U.S. tariffs has already been incorporated into the forecast on assumptions consistent with FY26, while growing uncertainty in the Middle East has not been incorporated at this stage.
| Item | FY26 (Actual) | FY27 (Forecast) | Change YoY |
|---|---|---|---|
| Net sales | 39,994 (100.0%) | 42,958 (100.0%) | +2,964 (+7.4%) |
| (Domestic sales) | 16,466 (41.2%) | 17,628 (41.0%) | +1,161 (+7.1%) |
| (Overseas sales) | 23,527 (58.8%) | 25,330 (59.0%) | +1,802 (+7.7%) |
| Gross profit | 23,740 (59.4%) | 26,072 (60.7%) | +2,331 (+9.8%) |
| (SG&A) | 18,513 (46.3%) | 20,069 (46.7%) | +1,555 (+8.4%) |
| Operating profit | 5,226 (13.1%) | 6,003 (14.0%) | +776 (+14.9%) |
| Ordinary profit | 5,859 (14.7%) | 5,890 (13.7%) | +31 (+0.5%) |
| Profit | 4,887 (12.2%) | 4,756 (11.1%) | -130 (-2.7%) |
| EPS (¥) | 137.38 | 133.66 | -3.72 |
| ROE | 10.7% | 9.6% | 1.1pt |
Shareholder Returns
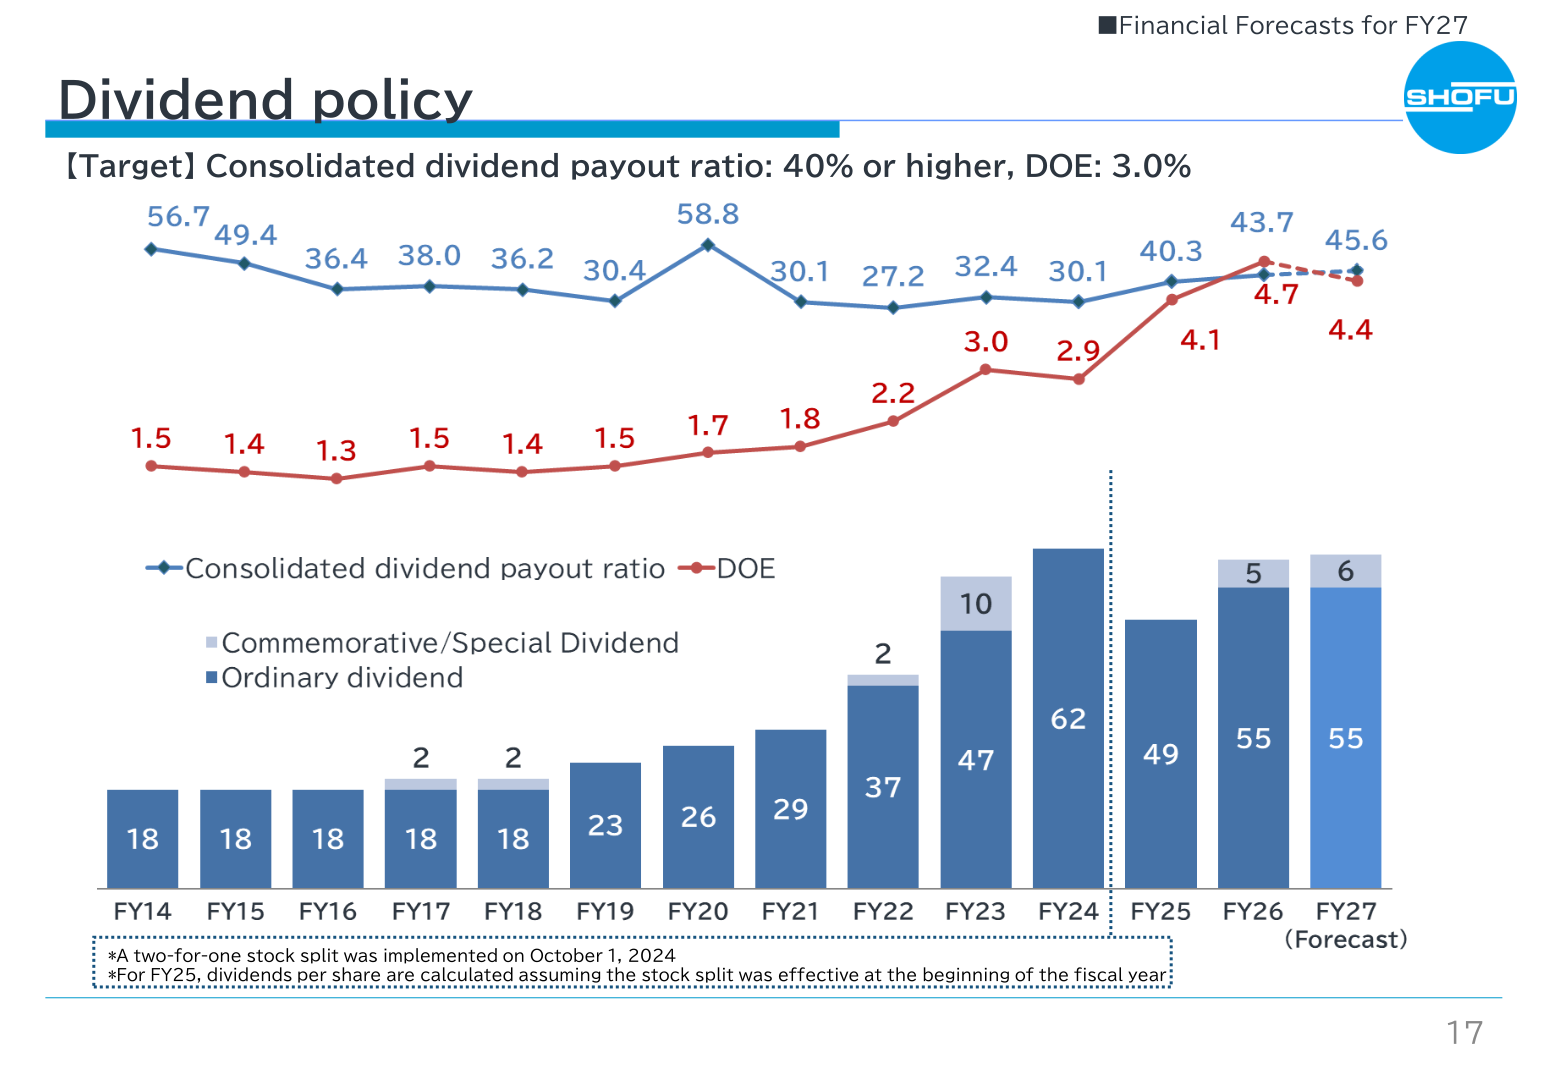
Shofu’s dividend policy targets a consolidated dividend payout ratio of 40% or higher and DOE of 3.0% or higher. For FY26, the company’s ordinary dividend was ¥55 per share plus a commemorative/special dividend of ¥5 per share, with a consolidated dividend payout ratio of 43.7% and DOE of 4.7%. For FY27, Shofu forecasts a total dividend of ¥61 per share (H1: ¥33, H2: ¥28), comprising an ordinary dividend of ¥55 per share plus a commemorative/special dividend of ¥6 per share, with a forecast payout ratio of 45.6% and DOE of 4.4%. A two-for-one stock split was implemented on October 1, 2024; for FY25, dividends per share are calculated assuming the split was effective at the beginning of that fiscal year.
Medium-Term Plan / Topics
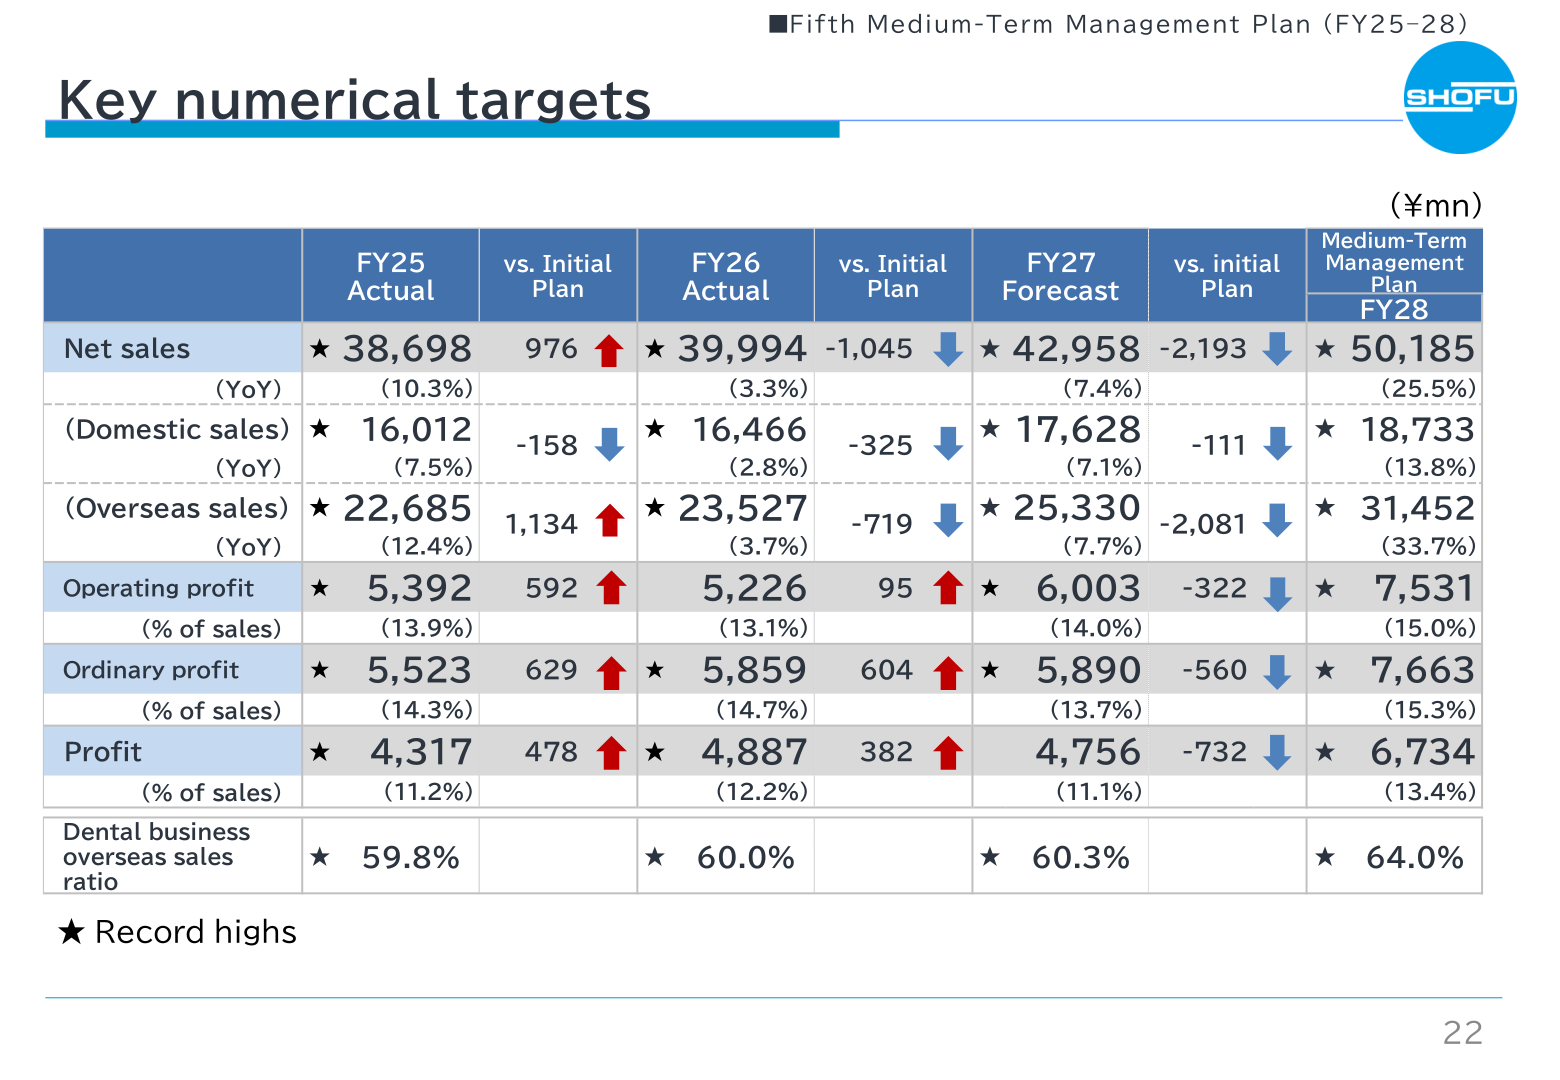
Under its Fifth Medium-Term Management Plan (FY25-28), Shofu targets group net sales of ¥50 billion and operating profit of ¥7.5 billion (operating margin of 15%), a goal first formulated in 2012. The company plans capital expenditure and investment of ¥15.3 billion over the four years of the plan, funded from operating cash flow, sales of strategic shareholdings, and debt financing, to strengthen its production system ahead of its next stage of business expansion, including reconstruction of the Kyoto headquarters plant (Phase 1 operation start scheduled for 2026, Phase 2 for 2028) and a new plant No.6 at Shiga Shofu Inc. (completion scheduled for April 2027). The plan also calls for enhanced shareholder returns, raising the dividend payout ratio to 40% or higher and DOE to 3.0% or higher.
| Item | FY25 Actual | FY26 Actual | FY27 Forecast | FY28 (Medium-Term Plan Target) |
|---|---|---|---|---|
| Net sales (¥mn) | ★ 38,698 (10.3%) | ★ 39,994 (3.3%) | ★ 42,958 (7.4%) | ★ 50,185 (25.5%) |
| (Domestic sales) | 16,012 (7.5%) | 16,466 (2.8%) | 17,628 (7.1%) | 18,733 (13.8%) |
| (Overseas sales) | ★ 22,685 (12.4%) | ★ 23,527 (3.7%) | ★ 25,330 (7.7%) | ★ 31,452 (33.7%) |
| Operating profit (¥mn, % of sales) | ★ 5,392 (13.9%) | 5,226 (13.1%) | ★ 6,003 (14.0%) | ★ 7,531 (15.0%) |
| Ordinary profit (¥mn, % of sales) | ★ 5,523 (14.3%) | ★ 5,859 (14.7%) | ★ 5,890 (13.7%) | ★ 7,663 (15.3%) |
| Profit (¥mn, % of sales) | ★ 4,317 (11.2%) | ★ 4,887 (12.2%) | 4,756 (11.1%) | ★ 6,734 (13.4%) |
| Dental business overseas sales ratio | ★ 59.8% | ★ 60.0% | ★ 60.3% | ★ 64.0% |
This article is an analysis based on publicly available information and is not a recommendation to buy or sell any specific securities. Investment decisions are your own responsibility.
















