
This article is based on publicly available IR materials and is not a recommendation to buy or sell any specific securities.
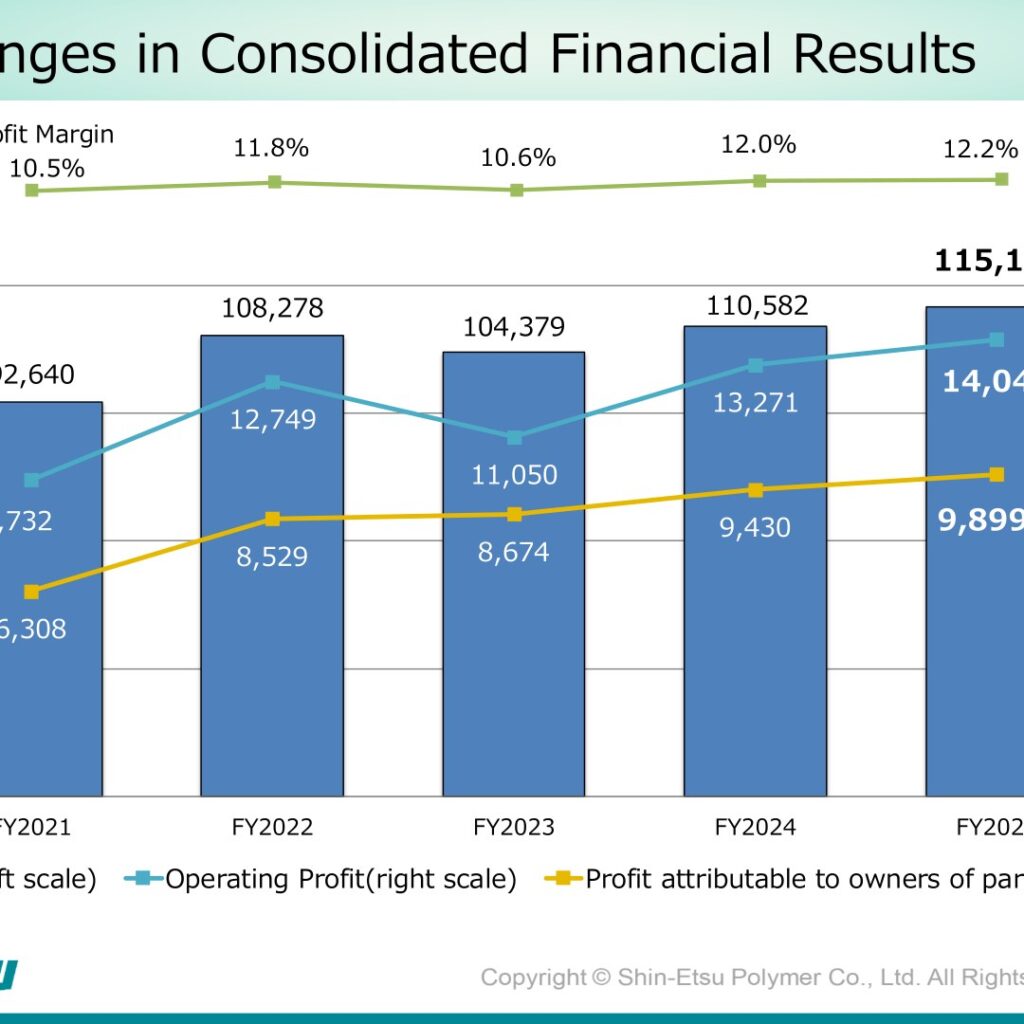
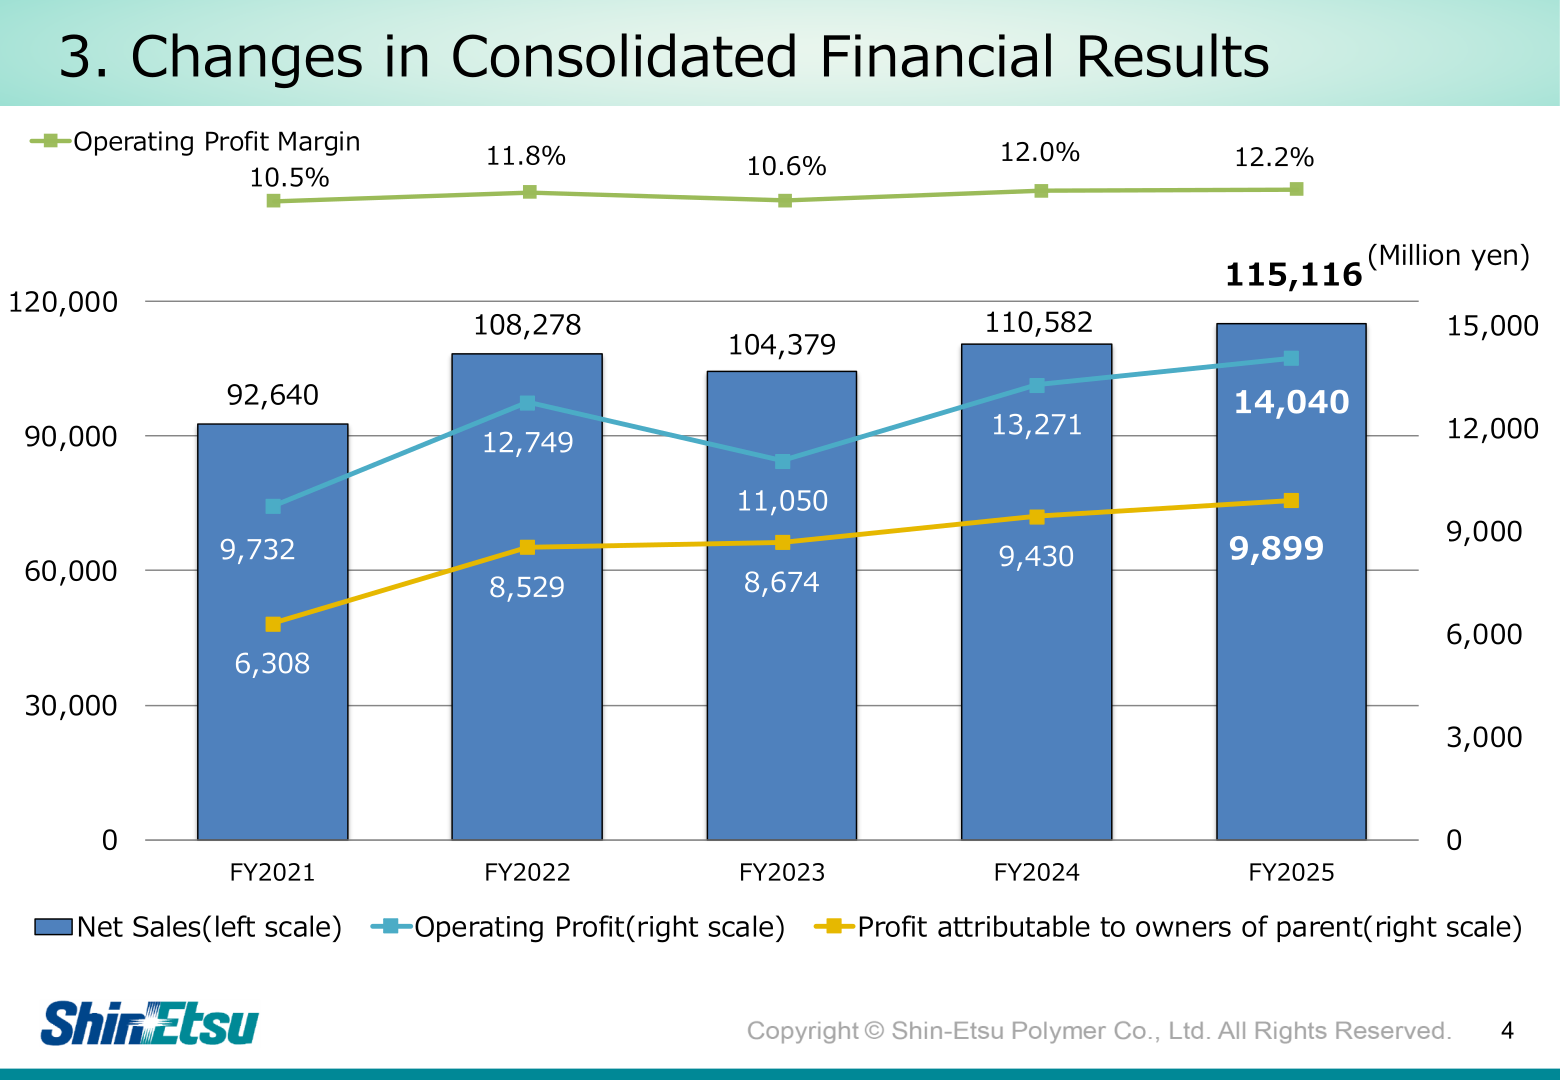
Shin-Etsu Polymer Co., Ltd. reported consolidated financial results for the fiscal year ended March 31, 2026 (FY2025). Net sales rose 4.1% year on year to 115,116 million yen, supported by a recovery in automotive input devices on solid hybrid vehicle sales and continued strong demand for semiconductor-related containers. Operating profit increased 5.8% to 14,040 million yen, and profit attributable to owners of parent rose 5.0% to 9,899 million yen. The annual dividend per share was raised to 62.0 yen, up from 52.0 yen in the prior fiscal year.
Consolidated Results (Full-Year Actual)
For FY2025, net sales increased 4.1% year on year to 115,116 million yen, operating profit rose 5.8% to 14,040 million yen, and ordinary profit increased 6.0% to 14,008 million yen. Profit attributable to owners of parent grew 5.0% to 9,899 million yen. Basic earnings per share rose to 123.2 yen from 117.0 yen. ROE (return on equity) was 7.9%, down from 8.0% in FY2024, while ROA (return on assets) was 9.2%, up from 9.0%. The average USD/JPY exchange rate used to consolidate the profit and loss of overseas subsidiaries (January-December average) was 149.7 yen, compared with 151.6 yen in the prior year.
| Item | FY2025 | FY2024 | YoY Change (Amount / Rate) |
|---|---|---|---|
| Net sales | 115,116 | 110,582 | +4,533 / +4.1% |
| Operating profit | 14,040 | 13,271 | +768 / +5.8% |
| Ordinary profit | 14,008 | 13,218 | +790 / +6.0% |
| Profit attributable to owners of parent | 9,899 | 9,430 | +468 / +5.0% |
| Basic earnings per share (yen) | 123.2 | 117.0 | +6.16 / +5.3% |
| Dividend per share (yen) | 62.0 | 52.0 | +10.0 / +19.2% |
| ROE, Return on equity (%) | 7.9 | 8.0 | – |
| ROA, Return on assets (%) | 9.2 | 9.0 | – |
Segment Results
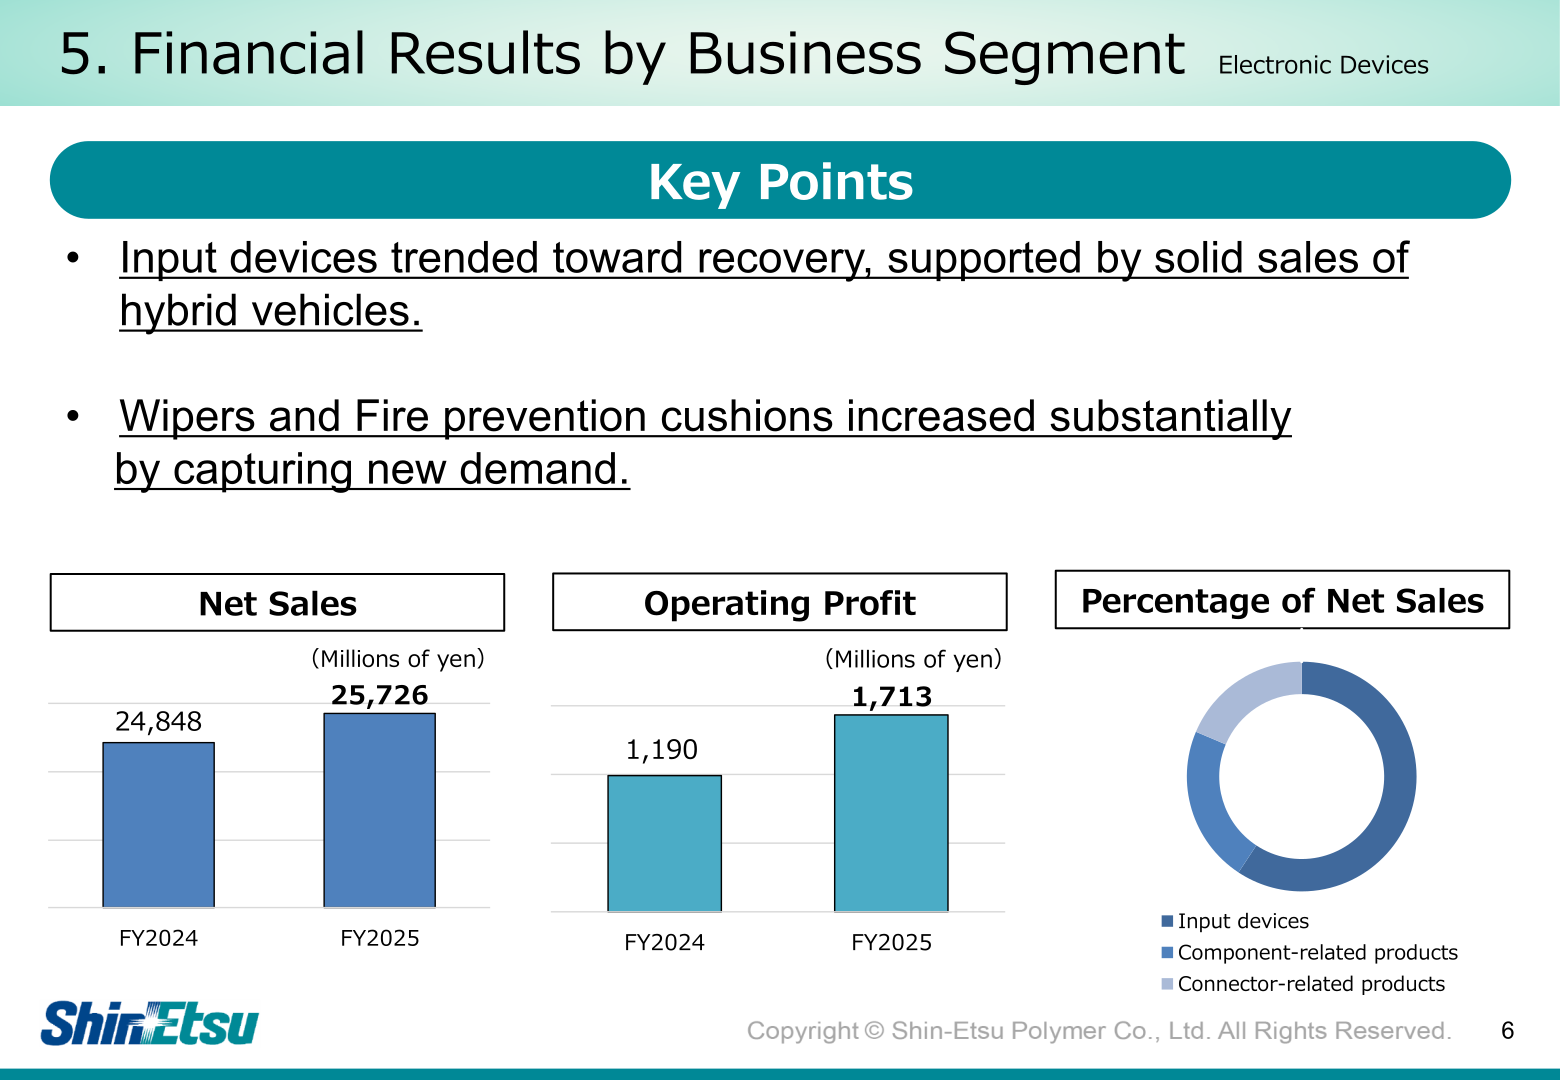
By segment, net sales increased in Electronic Devices and Precision Molding Products, while Housing & Living Materials net sales declined. In Electronic Devices, input devices trended toward recovery, supported by solid sales of hybrid vehicles, and wipers and fire prevention cushions increased substantially by capturing new demand; segment net sales rose 3.5% to 25,726 million yen and operating profit rose 43.9% to 1,713 million yen. In Precision Molding Products, semiconductor-related containers remained strong, led by solid demand for both 300mm wafer shipping and in-process containers, while OA device components were impacted by slow printer demand; carrier tape-related products remained strong for large-sized electronic components while small-sized components recovered moderately, and silicone rubber molded products remained firm, used in medical devices; segment net sales rose 6.7% to 59,773 million yen, while operating profit was down 0.2% to 10,218 million yen. In Housing & Living Materials, wrapping films remained firm due to sales expansion in high-value-added color wraps in the food industry, and functional compounds saw a demand recovery in wire coating applications for FA equipment and in the ASEAN market; segment net sales decreased 2.6% to 21,513 million yen, while operating profit rose 19.7% to 1,631 million yen. Effective April 1, 2025, the Company absorbed and merged KitcheNista Co., Ltd., its subsidiary engaged in the manufacture and sale of commercial-use PVC wrapping films. In the Others segment, net sales rose 6.2% to 8,103 million yen and operating profit rose 0.6% to 476 million yen.
| Segment | Net Sales (FY2025) | Net Sales (FY2024) | Operating Profit (FY2025) | Operating Profit (FY2024) |
|---|---|---|---|---|
| Electronic Devices | 25,726 | 24,848 | 1,713 | 1,190 |
| Precision Molding Products | 59,773 | 56,024 | 10,218 | 10,244 |
| Housing & Living Materials | 21,513 | 22,080 | 1,631 | 1,363 |
| Others | 8,103 | 7,628 | 476 | 473 |
| Total | 115,116 | 110,582 | 14,040 | 13,271 |
Financial Position and Cash Flows
Total assets as of March 31, 2026 stood at 153,003 million yen, up 15 million yen from March 31, 2025. Total liabilities decreased to 23,450 million yen, and total net assets increased to 129,553 million yen, lifting the equity ratio to 84.4% from 80.2%. Net cash provided by operating activities was 14,450 million yen, net cash used in investing activities was 4,749 million yen, and free cash flow was 9,701 million yen. Cash and cash equivalents at the end of the period stood at 47,013 million yen.
| Item | FY2025 (Mar. 2026) | FY2024 (Mar. 2025) | Change |
|---|---|---|---|
| Total assets | 153,003 | 152,988 | +15 |
| Total liabilities | 23,450 | 29,834 | (6,383) |
| Total net assets | 129,553 | 123,154 | +6,398 |
| Equity ratio (%) | 84.4 | 80.2 | – |
| Cash flows from operating activities | 14,450 | 16,013 | – |
| Cash flows from investing activities | (4,749) | (10,979) | – |
| Free cash flow | 9,701 | 5,034 | – |
| Cash and cash equivalents at end of period | 47,013 | 42,736 | – |
FY2026 Forecast
The FY2025 results presentation materials do not include a numerical financial forecast for the following fiscal year. This cannot be confirmed from the materials.
Shareholder Returns
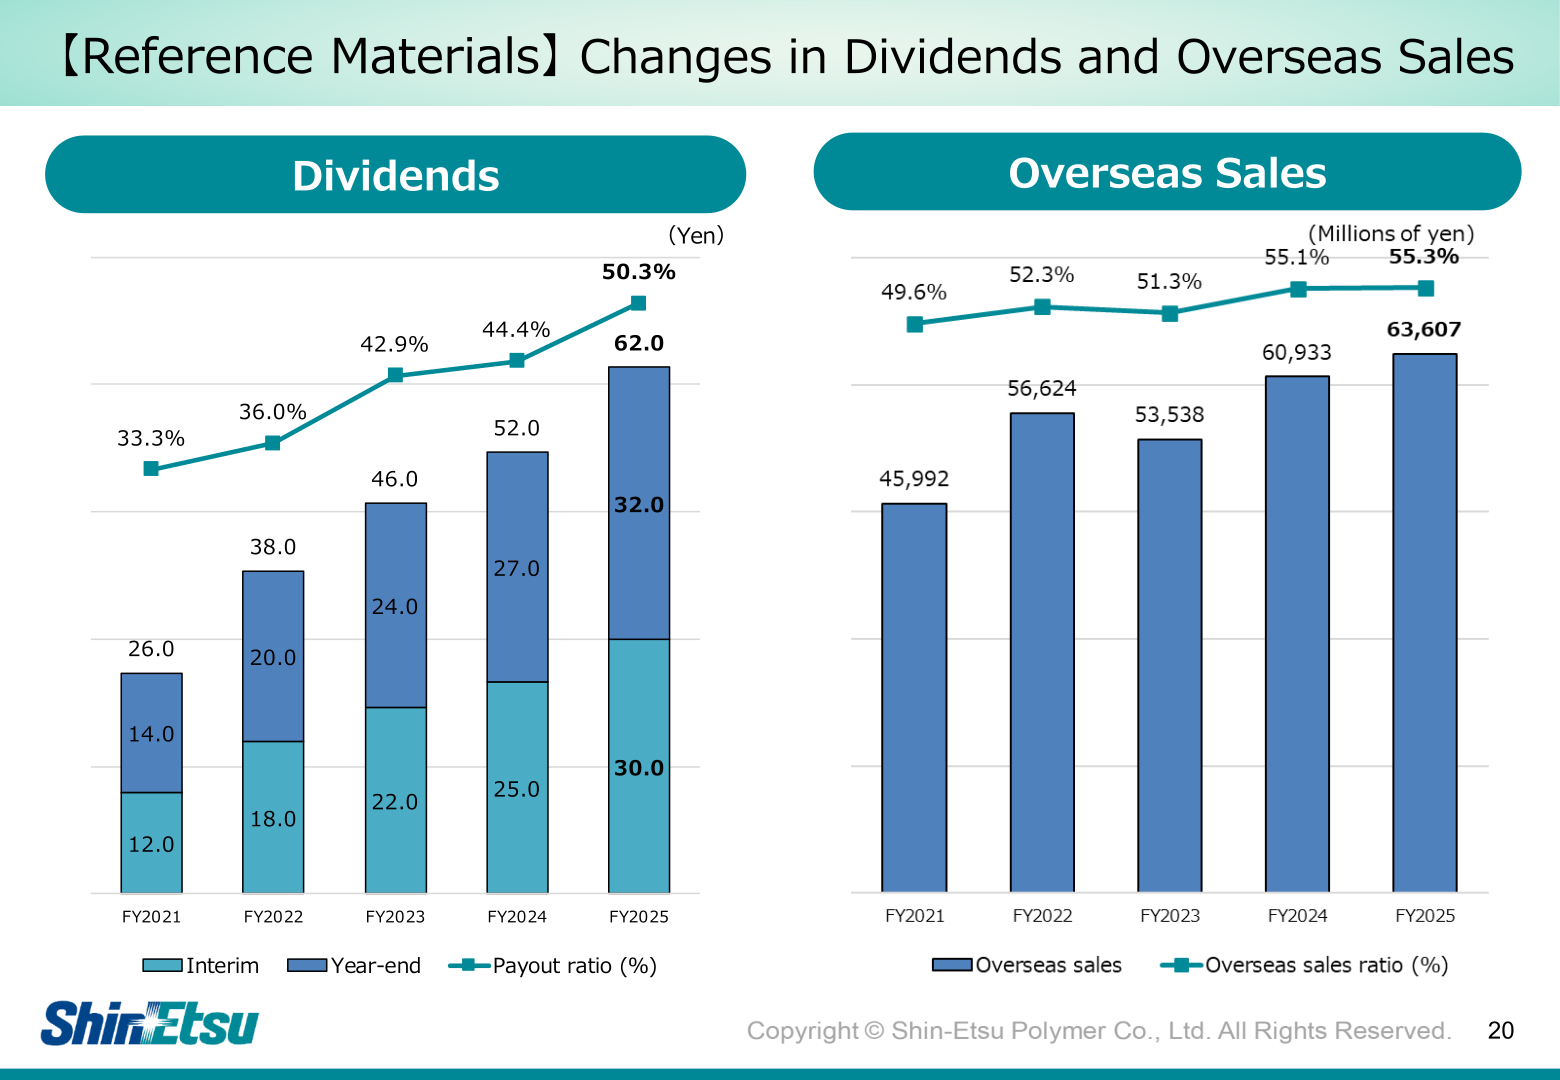
The annual dividend per share for FY2025 was 62.0 yen (interim 30.0 yen, year-end 32.0 yen), up from 52.0 yen (interim 25.0 yen, year-end 27.0 yen) in FY2024. The consolidated payout ratio for FY2025 was 50.3%, compared with 44.4% in the prior year.
| Item | FY2025 | FY2024 | Change |
|---|---|---|---|
| Interim dividend per share (yen) | 30.0 | 25.0 | +5.0 |
| Year-end dividend per share (yen) | 32.0 | 27.0 | +5.0 |
| Annual dividend per share (yen) | 62.0 | 52.0 | +10.0 / +19.2% |
| Payout ratio, consolidated (%) | 50.3 | 44.4 | – |
This article is an analysis based on publicly available information and is not a recommendation to buy or sell any specific securities. Investment decisions are your own responsibility.
















