
This article is based on publicly available IR materials and is not a recommendation to buy or sell any specific securities.
Note: Lintec’s results presentation labels the fiscal year ended March 2026 as “FY2026” and the following forecast year (ending March 2027) as “FY2027”; this article classifies the completed year as FY2025 in line with our site convention, while all tables and figures below retain the labels used in the source presentation.
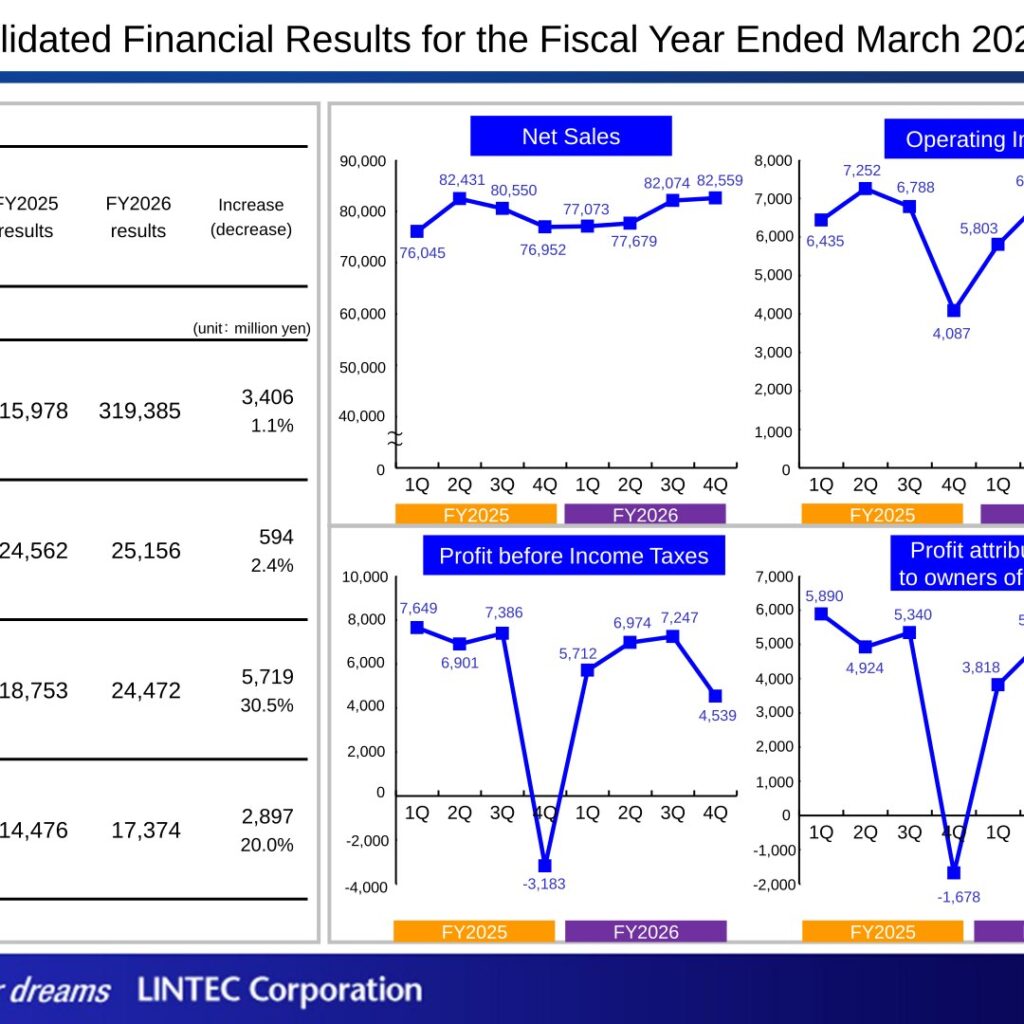
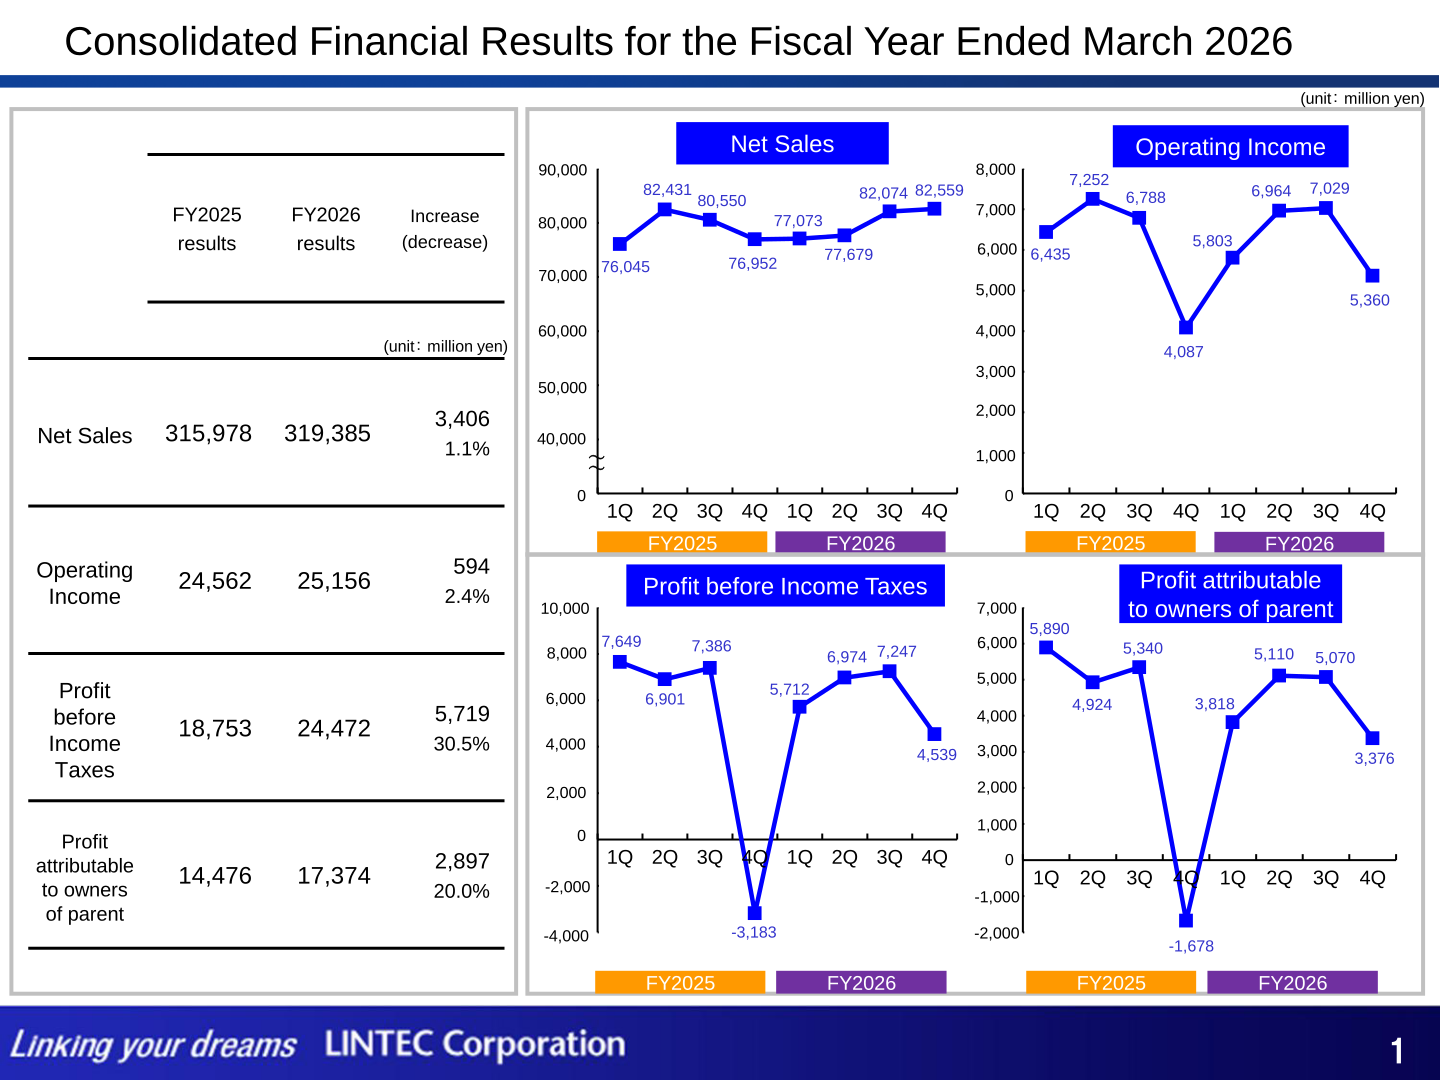
Lintec Corporation reported consolidated net sales of 319,385 million yen for the fiscal year ended March 2026, up 1.1% year on year, with operating income of 25,156 million yen (+2.4%), profit before income taxes of 24,472 million yen (+30.5%) and profit attributable to owners of parent of 17,374 million yen (+20.0%). Growth was led by the Electronic and Optical Products segment, particularly semiconductor-related adhesive tapes on higher AI-related demand, while the Printing and Industrial Materials Products segment’s operating income fell sharply. For the fiscal year ending March 2027, the company forecasts further increases in net sales and all profit lines, and plans to raise the annual dividend to 120 yen per share.
Consolidated Results (Full-Year Actual)
By company, non-consolidated LINTEC net sales rose 5.1% to 181,048 million yen and non-consolidated operating income rose 30.2% to 15,149 million yen, while consolidated subsidiaries’ net sales edged up 0.2% to 201,104 million yen but their operating income fell 20.3% to 10,139 million yen. The presentation attributes the operating income increase to factors of +2.9 billion yen from sales volume, +1.0 billion yen from sales price revision, +0.9 billion yen from sales mix and -0.2 billion yen from sales commission and valuation loss on inventory, etc. within LINTEC (non-consolidated) (net +3.5 billion yen), partly offset by -2.4 billion yen from cost of pulp, raw materials and fuels, -3.5 billion yen from fixed cost, -2.6 billion yen from consolidated subsidiaries and -0.3 billion yen from consolidation adjustments, with a -0.2 billion yen impact from foreign exchange rates (JPY/USD moving from 152.24 to 149.78).
| Item (million yen) | FY2025 Results | FY2026 Results | Increase (Decrease) | Change |
|---|---|---|---|---|
| Net Sales | 315,978 | 319,385 | 3,406 | 1.1% |
| Operating Income | 24,562 | 25,156 | 594 | 2.4% |
| Profit before Income Taxes | 18,753 | 24,472 | 5,719 | 30.5% |
| Profit attributable to owners of parent | 14,476 | 17,374 | 2,897 | 20.0% |
Segment Results
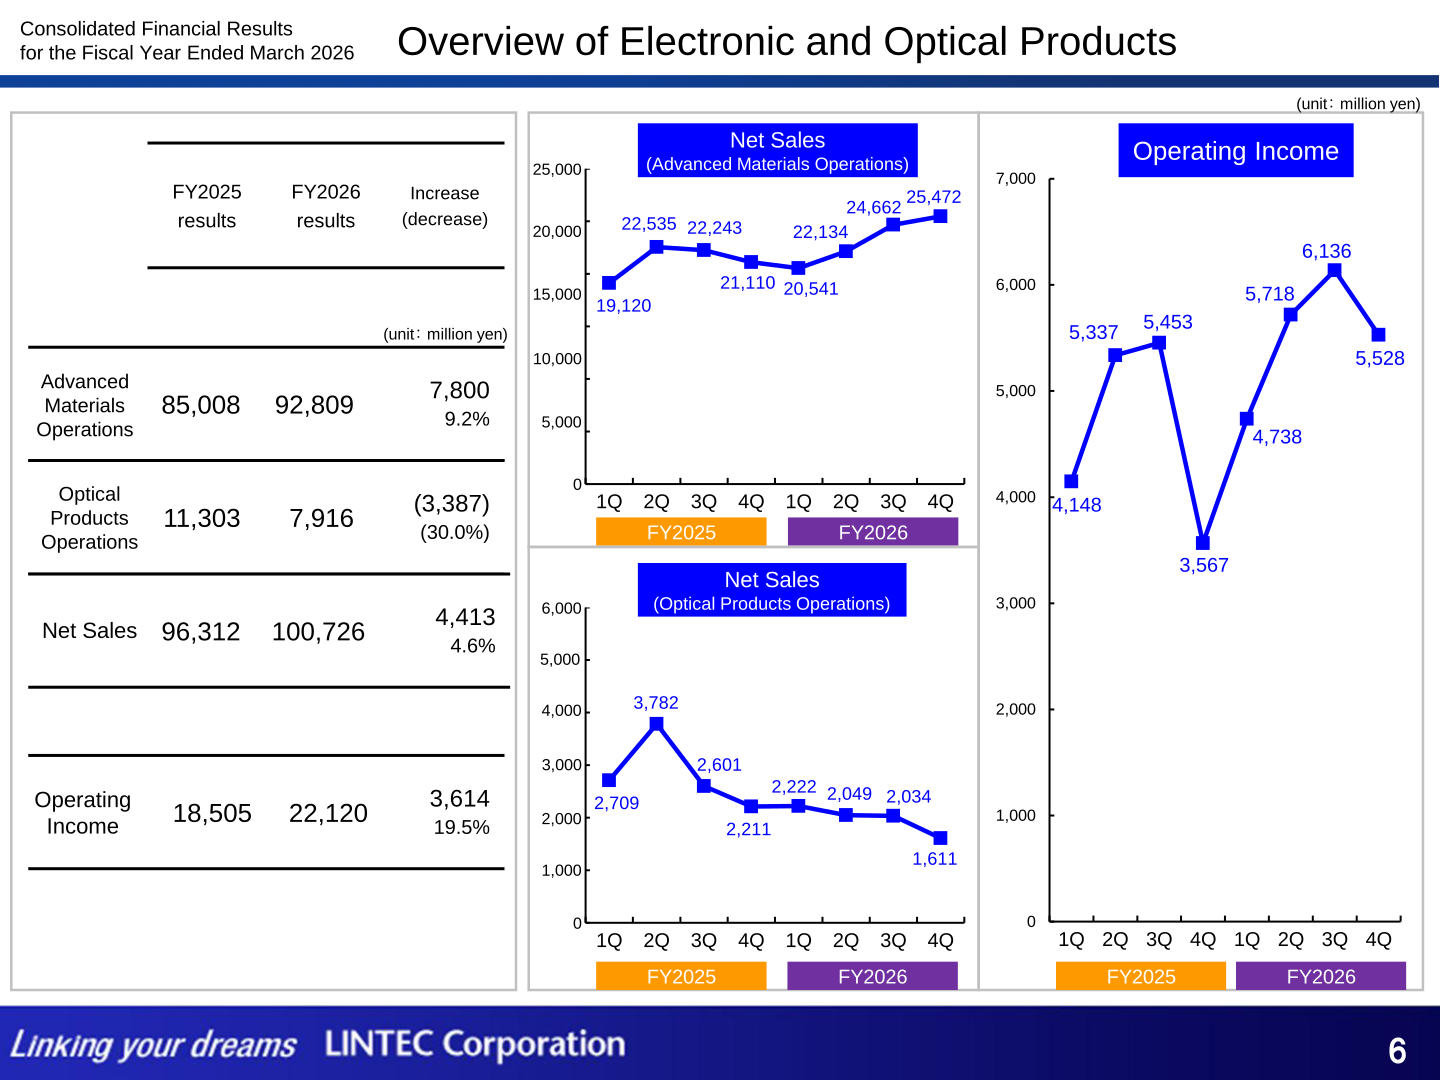
In Printing and Industrial Materials Products, net sales fell 1.1% to 182,644 million yen and operating income fell 63.8% to 1,979 million yen. Within Printing & Variable Information Products Operations, demand related to food products and beverage campaigns was sluggish in Japan while medical and logistics applications remained solid and demand for eye-catching labels recovered; overseas, sales volumes at MACTAC AMERICAS, LLC increased but overall sales declined on sales mix changes and foreign exchange impact, and demand remained sluggish in the ASEAN region. Within Industrial & Material Operations, sales of window films for building-use were sluggish in Japan while automobile-use window films and adhesive products remained solid; overseas, demand for security window films at MADICO, INC. declined and automobile-use adhesive product sales decreased in the ASEAN region. In Electronic and Optical Products, net sales rose 4.6% to 100,726 million yen and operating income rose 19.5% to 22,120 million yen: semiconductor-related adhesive tapes performed well on increased AI-related demand and multilayer ceramic capacitor-related tapes were strong on demand for data centers and smartphones, while semiconductor-related equipment sales were down year on year despite a recovery in HBM-related orders and deliveries in the latter half, and Optical Products Operations sales declined overall due to the closure of subsidiaries in South Korea and Taiwan even as OLED display adhesive tape sales were almost on par with the previous period. In Paper and Converted Products, net sales rose 2.8% to 36,014 million yen and operating income rose 82.6% to 977 million yen, as release papers for electronic materials remained solid and demand recovered for release films for optical-related products and casting papers for carbon fiber composite materials, while color papers for envelopes, oil-resistant papers and casting papers for synthetic leather were sluggish.
| Segment | Metric | FY2025 Results | FY2026 Results | Increase (Decrease) | Change |
|---|---|---|---|---|---|
| Printing & Variable Information Products Operations | Net Sales (million yen) | 146,665 | 145,517 | (1,147) | (0.8%) |
| Industrial & Material Operations | Net Sales (million yen) | 37,981 | 37,126 | (855) | (2.3%) |
| Printing and Industrial Materials Products | Net Sales Total (million yen) | 184,647 | 182,644 | (2,002) | (1.1%) |
| Printing and Industrial Materials Products | Operating Income (million yen) | 5,462 | 1,979 | (3,482) | (63.8%) |
| Advanced Materials Operations | Net Sales (million yen) | 85,008 | 92,809 | 7,800 | 9.2% |
| Optical Products Operations | Net Sales (million yen) | 11,303 | 7,916 | (3,387) | (30.0%) |
| Electronic and Optical Products | Net Sales Total (million yen) | 96,312 | 100,726 | 4,413 | 4.6% |
| Electronic and Optical Products | Operating Income (million yen) | 18,505 | 22,120 | 3,614 | 19.5% |
| Fine & Specialty Paper Products Operations | Net Sales (million yen) | 14,876 | 14,677 | (198) | (1.3%) |
| Converted Products Operations | Net Sales (million yen) | 20,142 | 21,336 | 1,194 | 5.9% |
| Paper and Converted Products | Net Sales Total (million yen) | 35,019 | 36,014 | 995 | 2.8% |
| Paper and Converted Products | Operating Income (million yen) | 535 | 977 | 441 | 82.6% |
FY2027 Forecast
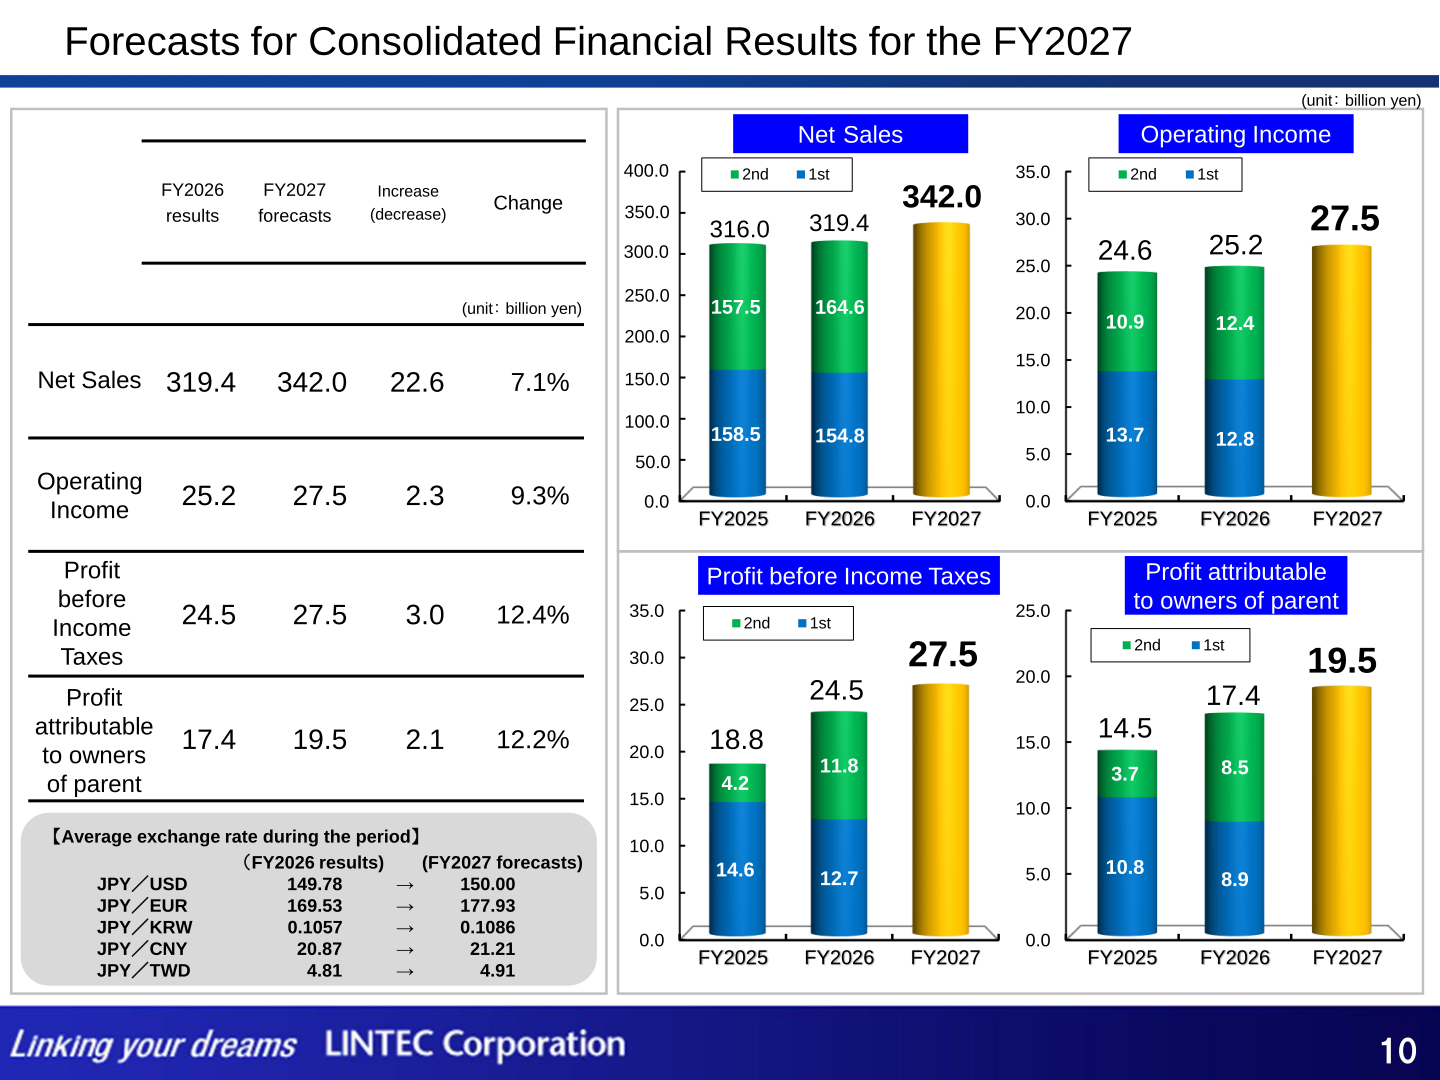
For the fiscal year ending March 2027, Lintec forecasts consolidated net sales of 342.0 billion yen (+7.1%), operating income of 27.5 billion yen (+9.3%), profit before income taxes of 27.5 billion yen (+12.4%) and profit attributable to owners of parent of 19.5 billion yen (+12.2%). By segment, forecast net sales are 194.3 billion yen for Printing and Industrial Materials Products (+6.4%) with operating income of 4.1 billion yen (+107.2%); 110.2 billion yen for Electronic and Optical Products (+9.4%) with operating income of 22.7 billion yen (+2.6%); and 37.5 billion yen for Paper and Converted Products (+4.1%) with operating income of 0.7 billion yen (-28.4%). The operating income forecast reflects LINTEC (non-consolidated) factors of +4.8 billion yen from sales volume and +6.7 billion yen from sales price revision, offset by -4.7 billion yen from raw materials and fuels and -4.2 billion yen from fixed cost (net +2.6 billion yen), together with -0.5 billion yen from consolidated subsidiaries and +0.2 billion yen from consolidation adjustments. The average exchange rate assumption for FY2027 is JPY/USD 150.00 (FY2026: 149.78), JPY/EUR 177.93 (169.53), JPY/KRW 0.1086 (0.1057), JPY/CNY 21.21 (20.87) and JPY/TWD 4.91 (4.81).
| Item (billion yen) | FY2026 Results | FY2027 Forecasts | Increase (Decrease) | Change |
|---|---|---|---|---|
| Net Sales | 319.4 | 342.0 | 22.6 | 7.1% |
| Operating Income | 25.2 | 27.5 | 2.3 | 9.3% |
| Profit before Income Taxes | 24.5 | 27.5 | 3.0 | 12.4% |
| Profit attributable to owners of parent | 17.4 | 19.5 | 2.1 | 12.2% |
Shareholder Returns
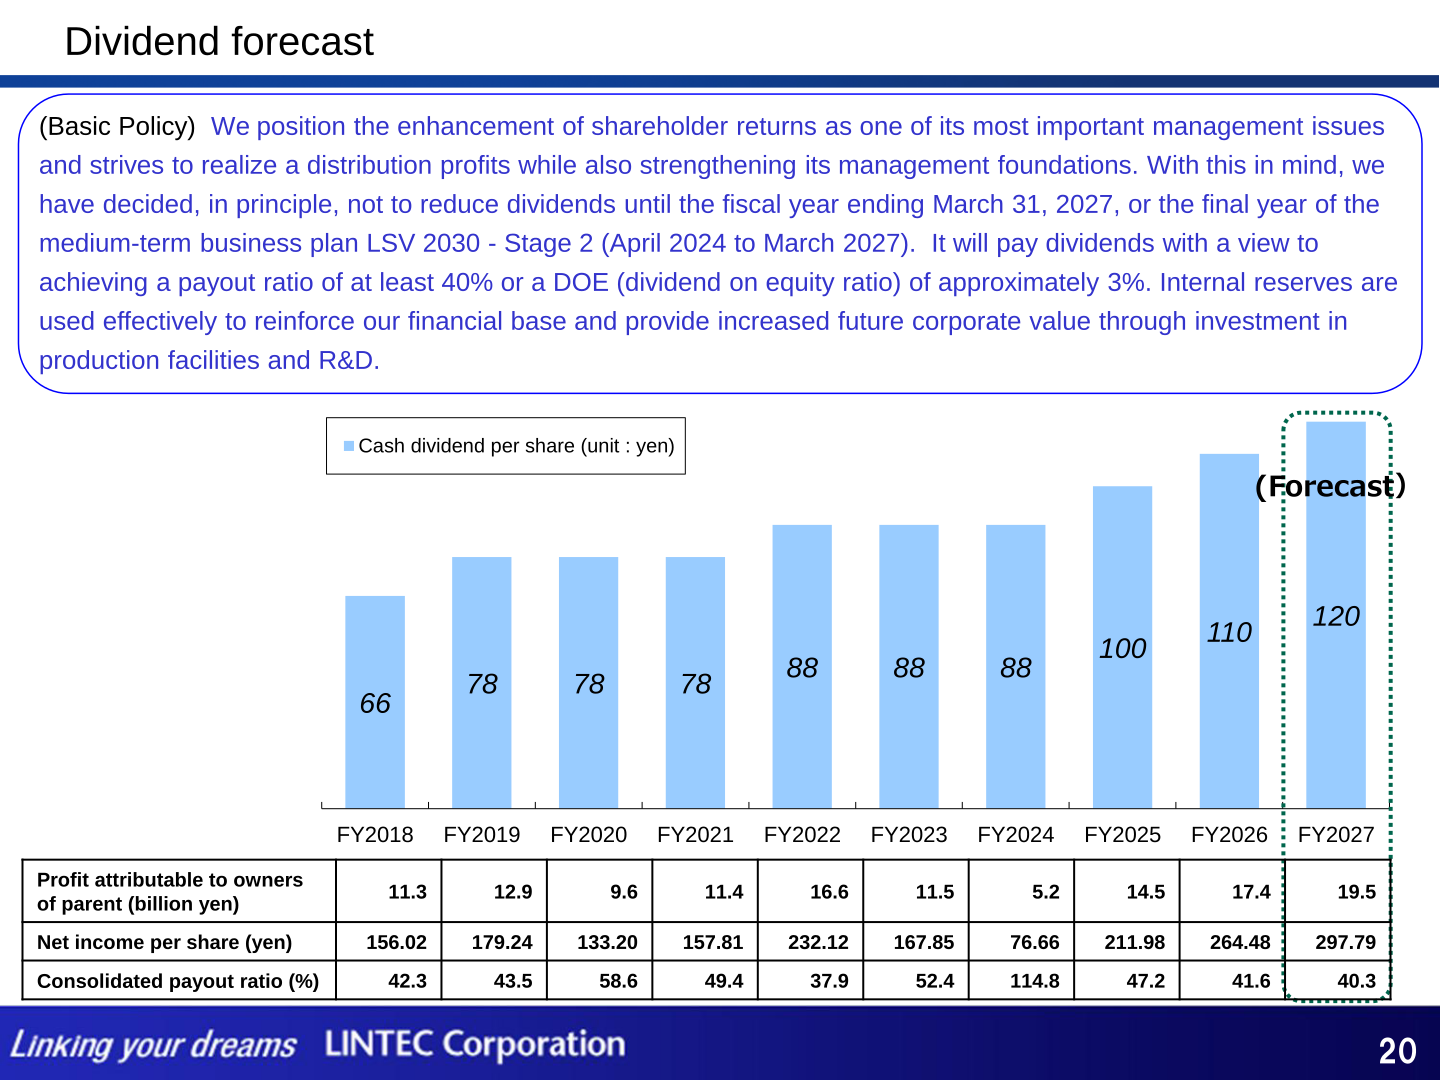
Lintec’s basic policy positions the enhancement of shareholder returns as one of its most important management issues, aiming to realize a distribution of profits while strengthening its management foundations. The company has decided, in principle, not to reduce dividends until the fiscal year ending March 31, 2027, the final year of the medium-term business plan LSV 2030 – Stage 2 (April 2024 to March 2027), and intends to pay dividends with a view to achieving a payout ratio of at least 40% or a DOE (dividend on equity ratio) of approximately 3%, while using internal reserves to reinforce its financial base and increase future corporate value through investment in production facilities and R&D. The annual dividend per share was 110 yen for FY2026 (payout ratio 41.6%), and the company forecasts an annual dividend of 120 yen for FY2027 (payout ratio 40.3%).
| Fiscal Year | Cash Dividend per Share (yen) | Profit Attributable to Owners (billion yen) | Net Income per Share (yen) | Consolidated Payout Ratio (%) |
|---|---|---|---|---|
| FY2023 | 88 | 11.5 | 167.85 | 52.4 |
| FY2024 | 88 | 5.2 | 76.66 | 114.8 |
| FY2025 | 100 | 14.5 | 211.98 | 47.2 |
| FY2026 | 110 | 17.4 | 264.48 | 41.6 |
| FY2027 (Forecast) | 120 | 19.5 | 297.79 | 40.3 |
This article is an analysis based on publicly available information and is not a recommendation to buy or sell any specific securities. Investment decisions are your own responsibility.
















