
This article is based on publicly available IR materials and is not a recommendation to buy or sell any specific securities.
Note on fiscal-year labels: Kawai Musical Instruments Manufacturing labels the fiscal year ended March 31, 2026 as “FY2026.3” (its 99th term) and the fiscal year ending March 31, 2027 as “FY2027.3” throughout its results presentation. Following this site’s convention, this article refers to the most recently completed fiscal year (ended March 31, 2026) as “FY2025” in the title and slug, while the tables and body text below retain the source material’s own notation (FY2025.3 = year ended March 2025, FY2026.3 = year ended March 2026, FY2027.3 = year ending March 2027). All figures are stated in millions of yen unless otherwise noted, as presented in the source material.
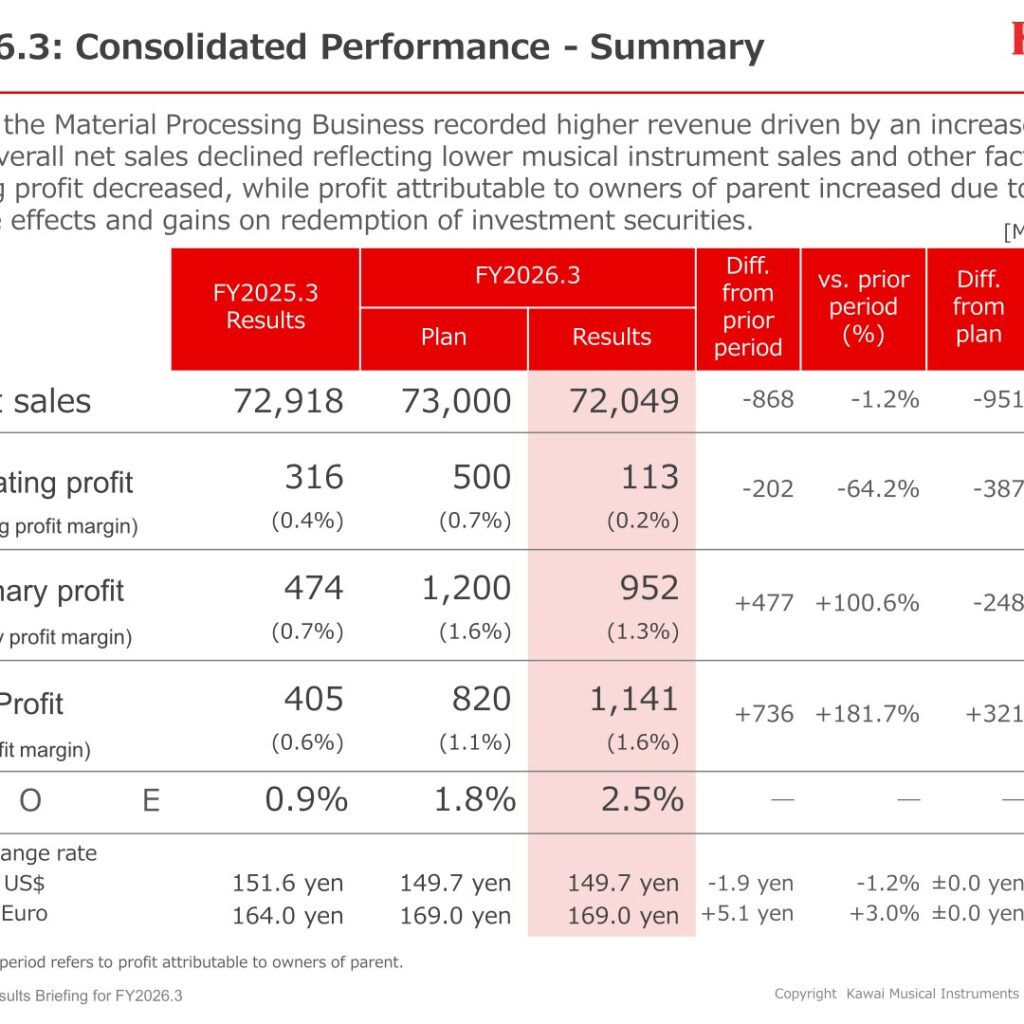
Kawai Musical Instruments Manufacturing reported net sales of 72,049 million yen for the fiscal year ended March 31, 2026 (FY2026.3), down 1.2% year on year and 1.3% below the company’s own plan, as lower sales of both acoustic and digital pianos offset higher revenue at the Material Processing segment. Operating profit fell 64.2% year on year to 113 million yen, missing plan by 77.4%, while profit attributable to owners of parent rose 181.7% year on year to 1,141 million yen, beating plan by 39.1%, helped by foreign exchange effects and gains on redemption of investment securities. For FY2027.3, the company forecasts a return to revenue and profit growth as musical instrument sales recover.
Consolidated Results (Full-Year Actual)
Although the Material Processing Business recorded higher revenue driven by an increase in orders, overall net sales declined reflecting lower musical instrument sales and other factors. Operating profit decreased, while profit attributable to owners of parent increased due to foreign exchange effects and gains on redemption of investment securities.
| Item | FY2025.3 (Actual) | FY2026.3 (Plan) | FY2026.3 (Actual) | YoY (%) | vs. Plan (%) |
|---|---|---|---|---|---|
| Net sales | 72,918 | 73,000 | 72,049 | -1.2% | -1.3% |
| Operating profit | 316 | 500 | 113 | -64.2% | -77.4% |
| (Operating profit margin) | (0.4%) | (0.7%) | (0.2%) | – | – |
| Ordinary profit | 474 | 1,200 | 952 | +100.6% | -20.7% |
| (Ordinary profit margin) | (0.7%) | (1.6%) | (1.3%) | – | – |
| Profit attributable to owners of parent | 405 | 820 | 1,141 | +181.7% | +39.1% |
| (Profit margin) | (0.6%) | (1.1%) | (1.6%) | – | – |
| ROE | 0.9% | 1.8% | 2.5% | – | – |
Total assets increased to 78,879 million yen (up 4,888 million yen from the end of FY2025.3), mainly due to an increase in investment securities. Total liabilities rose to 32,134 million yen mainly due to higher borrowings, while net assets increased to 46,745 million yen mainly due to valuation differences on investment securities. The shareholders’ equity ratio was 59.3%, down 0.9 points from the end of FY2025.3.
Segment Results
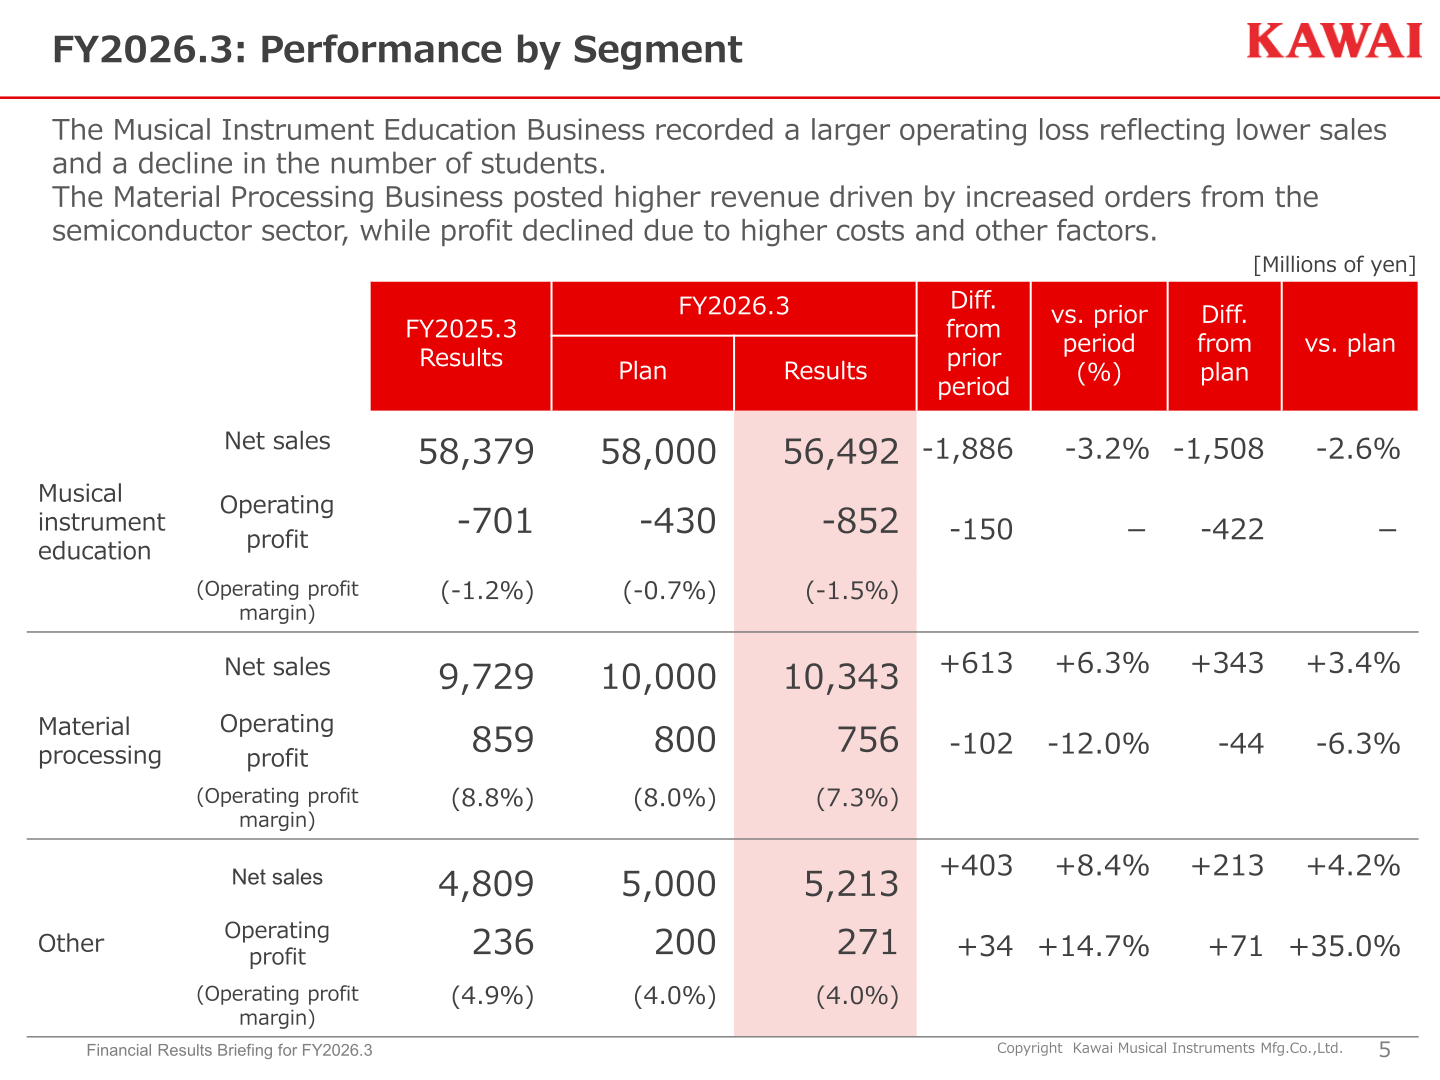
The Musical Instrument Education Business recorded a larger operating loss, reflecting lower sales and a decline in the number of students. The Material Processing Business posted higher revenue, driven by increased orders from the semiconductor sector, while profit declined due to higher costs and other factors.
| Segment | Metric | FY2025.3 (Actual) | FY2026.3 (Plan) | FY2026.3 (Actual) | YoY (%) | vs. Plan (%) |
|---|---|---|---|---|---|---|
| Musical Instrument Education | Net sales | 58,379 | 58,000 | 56,492 | -3.2% | -2.6% |
| Musical Instrument Education | Operating profit | -701 | -430 | -852 | – | – |
| Musical Instrument Education | (Operating profit margin) | (-1.2%) | (-0.7%) | (-1.5%) | – | – |
| Material Processing | Net sales | 9,729 | 10,000 | 10,343 | +6.3% | +3.4% |
| Material Processing | Operating profit | 859 | 800 | 756 | -12.0% | -6.3% |
| Material Processing | (Operating profit margin) | (8.8%) | (8.0%) | (7.3%) | – | – |
| Other | Net sales | 4,809 | 5,000 | 5,213 | +8.4% | +4.2% |
| Other | Operating profit | 236 | 200 | 271 | +14.7% | +35.0% |
| Other | (Operating profit margin) | (4.9%) | (4.0%) | (4.0%) | – | – |
Keyboard Musical Instruments Sales by Region
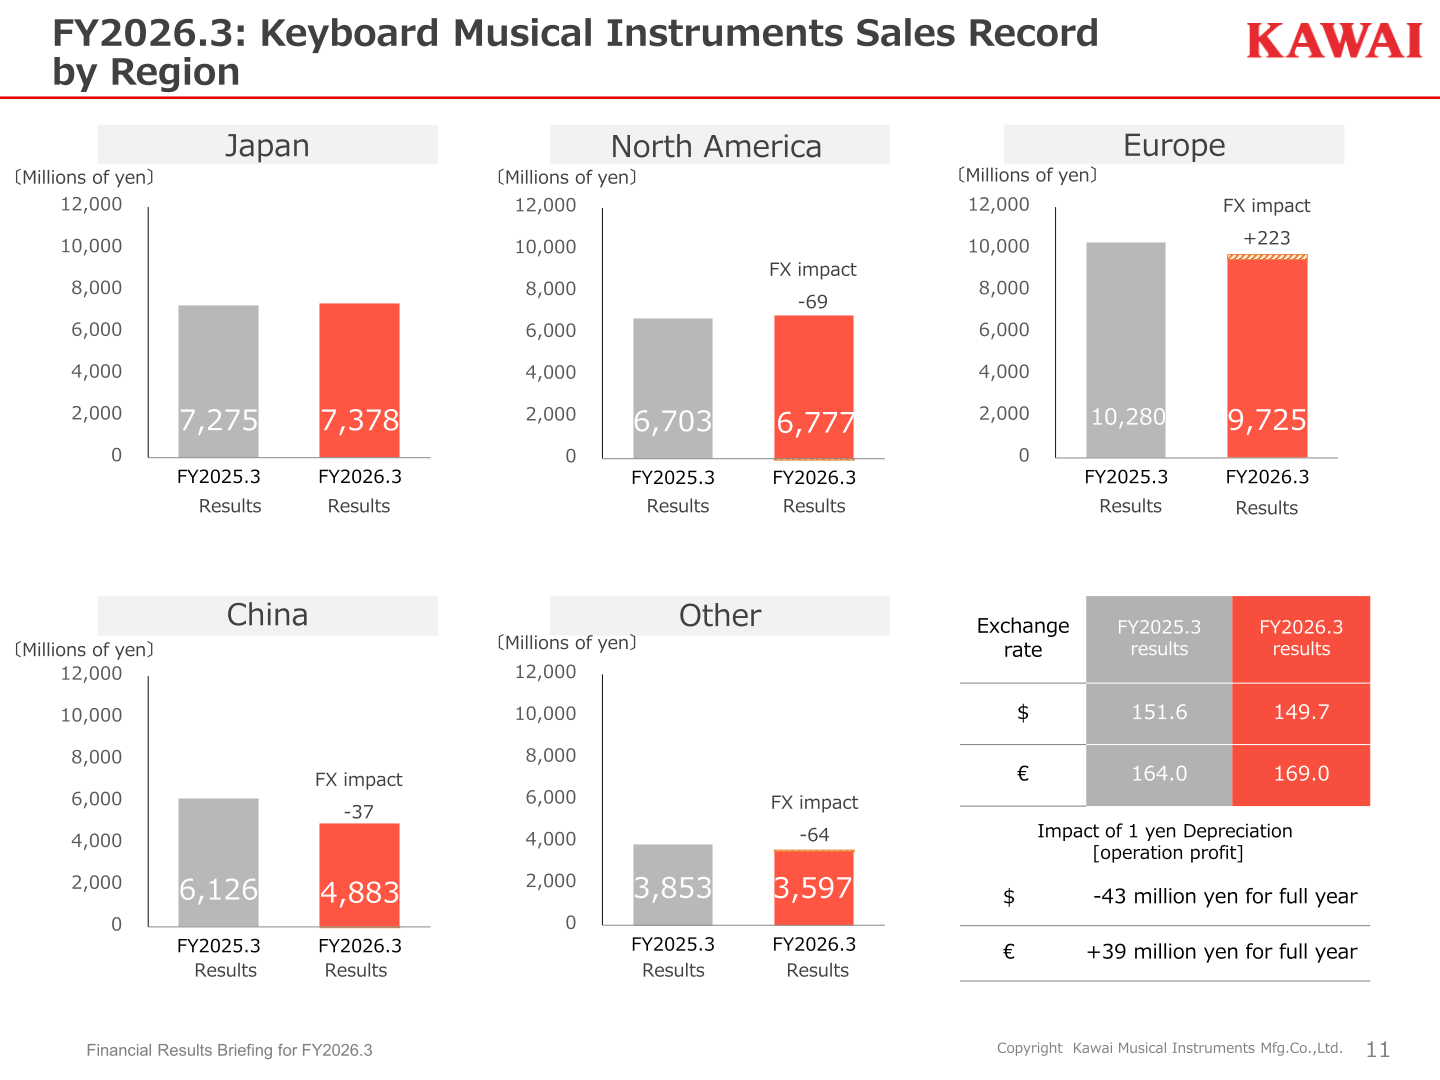
By region, Japan sales rose 1.4% year on year, supported by strong sales of GX series grand pianos following a successful rebranding and higher sales of Shigeru Kawai pianos linked to major piano competitions; the company states its domestic acoustic piano market share exceeded 50% for the first time, based on its own research. North America sales rose 1.1% year on year, supported by enhanced promotional efforts and strengthened store operations. Europe sales fell 5.4% year on year as weakened consumer sentiment amid prolonged inflation lowered sales of both acoustic and digital pianos, although profitability improved through pricing optimization. China sales fell 20.3% year on year amid continued economic stagnation, excessive market-wide inventories, and intensified price competition, though the company notes both acoustic and digital piano sales in China exceeded the prior year’s level in the second half. Sales in other regions fell 6.7% year on year, as growth in Indonesia and Central and South America was offset by declines in Taiwan, South Korea, and the Middle East.
| Region | FY2025.3 (Actual) | FY2026.3 (Actual) | YoY (%) |
|---|---|---|---|
| Japan | 7,275 | 7,378 | +1.4% |
| North America | 6,703 | 6,777 | +1.1% |
| Europe | 10,280 | 9,725 | -5.4% |
| China | 6,126 | 4,883 | -20.3% |
| Other | 3,853 | 3,597 | -6.7% |
FY2027.3 Forecast
The company expects increased revenue and profit driven by a recovery in sales in its key markets. By segment, the Musical Instrument Education Business is expected to post higher revenue and profit as production and sales recover, while the Material Processing Business is projected to record lower revenue and profit due to a decline in automotive-related orders.
| Item | FY2026.3 (Actual) | FY2027.3 (Plan) | YoY (%) |
|---|---|---|---|
| Net sales | 72,049 | 80,000 | +11.0% |
| Operating profit | 113 | 1,800 | – |
| (Operating profit margin) | (0.2%) | (2.3%) | – |
| Ordinary profit | 952 | 1,900 | +99.4% |
| (Ordinary profit margin) | (1.3%) | (2.4%) | – |
| Profit attributable to owners of parent | 1,141 | 1,600 | +40.1% |
| (Profit margin) | (1.6%) | (2.0%) | – |
| ROE | 2.5% | 3.4% | – |
| Segment | Metric | FY2026.3 (Actual) | FY2027.3 (Plan) | YoY (%) |
|---|---|---|---|---|
| Musical Instrument Education | Net sales | 56,492 | 65,800 | +16.5% |
| Musical Instrument Education | Operating profit | -852 | 1,200 | – |
| Material Processing | Net sales | 10,343 | 8,900 | -13.9% |
| Material Processing | Operating profit | 756 | 400 | -47.1% |
| Other | Net sales | 5,213 | 5,300 | +1.7% |
| Other | Operating profit | 271 | 250 | -7.7% |
Shareholder Returns
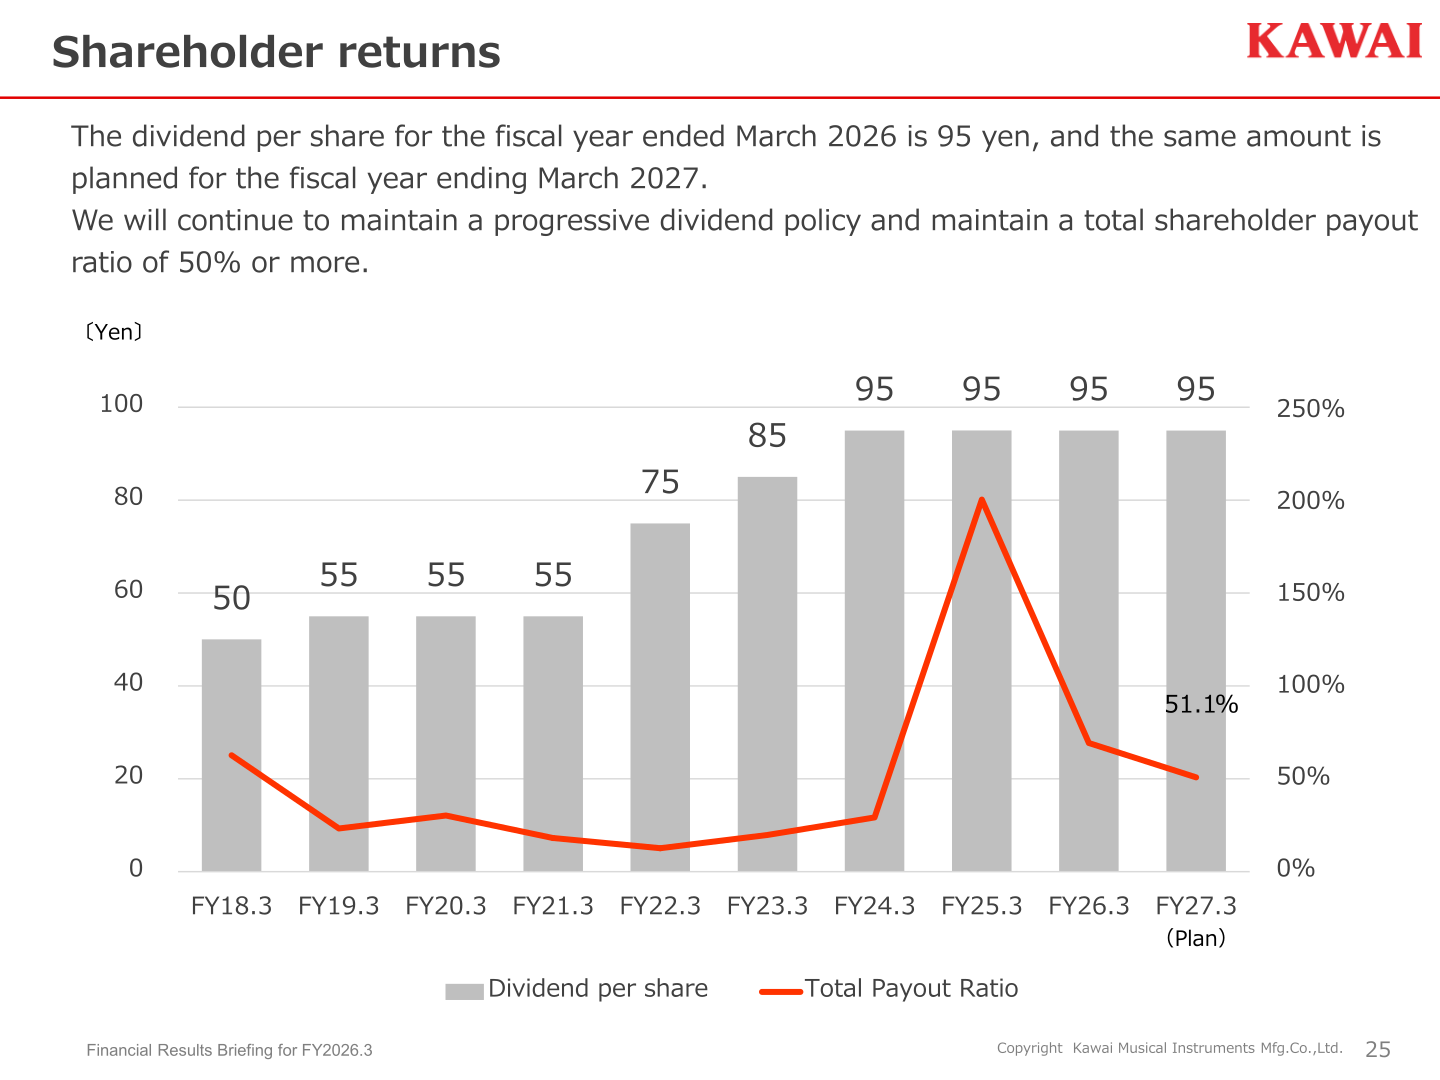
The dividend per share for FY2026.3 was maintained at 95 yen, with the same amount planned for FY2027.3. The company states it will continue to maintain a progressive dividend policy and a total shareholder payout ratio of 50% or more.
| Item | FY2026.3 (Actual) | FY2027.3 (Plan) |
|---|---|---|
| Dividend per share (yen) | 95 | 95 |
| Total payout ratio | 71.6% | 51.1% |
Medium-Term Plan / Topics
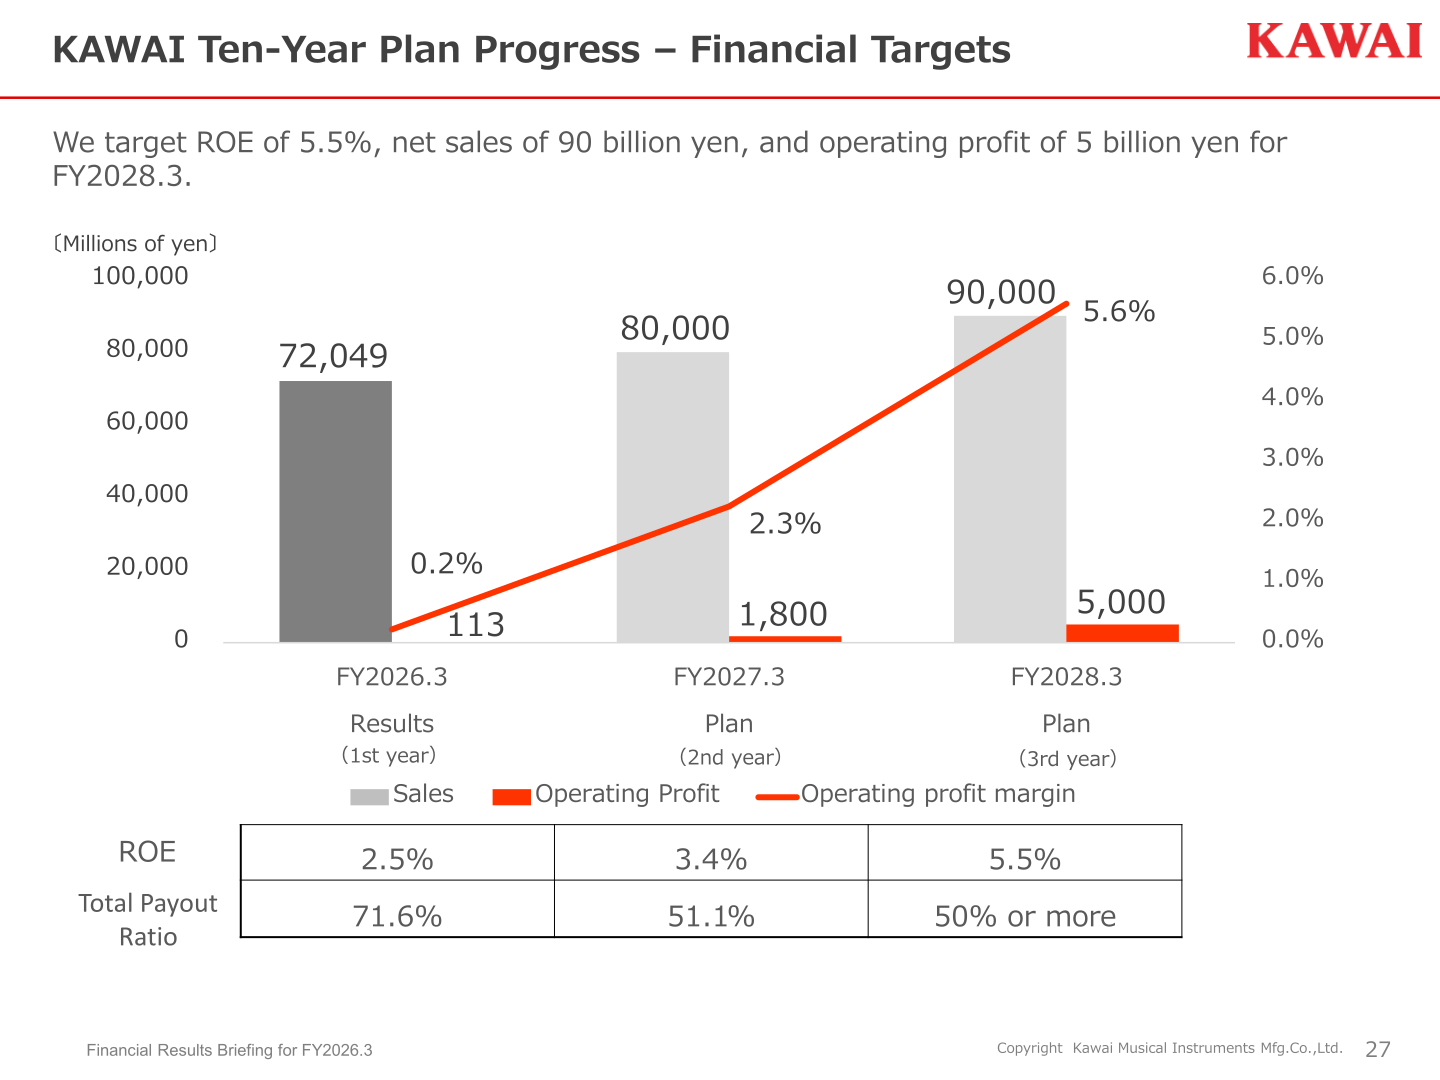
The company is in the second year of its 8th Medium-Term Management Plan, the “KAWAI Ten-Year Plan,” launched in March 2025. Under the plan, it targets net sales of 90,000 million yen, operating profit of 5,000 million yen, and ROE of 5.5% for FY2028.3. Key initiatives cited include enhancing digital piano development and profitability through a U.S. development base and a new digital piano factory under construction in Indonesia, scheduled to begin operations in July 2026; launching the higher value-added “Master Series” upright pianos for overseas markets; and developing next-generation piano action models. The company also states that, over the past 10 fiscal years, it has generally generated returns on capital above its cost of equity, but that a significant decline in returns on capital over the past two fiscal years has left the market’s assessment of its profitability and growth potential low, and that it aims to achieve a price-to-book ratio of 1.0 or more at an early stage by increasing operating profit, strengthening IR activities, and clarifying its mid-to-long-term growth plan.
| Item | FY2026.3 (Actual, 1st Year) | FY2027.3 (Plan, 2nd Year) | FY2028.3 (Plan, 3rd Year) |
|---|---|---|---|
| Net sales | 72,049 | 80,000 | 90,000 |
| Operating profit | 113 | 1,800 | 5,000 |
| Operating profit margin | 0.2% | 2.3% | 5.6% |
| ROE | 2.5% | 3.4% | 5.5% |
| Total payout ratio | 71.6% | 51.1% | 50% or more |
This article is an analysis based on publicly available information and is not a recommendation to buy or sell any specific securities. Investment decisions are your own responsibility.
















