
This article is based on publicly available IR materials and is not a recommendation to buy or sell any specific securities.
Note: Sanko Gosei does not publish an English results presentation; this article is an English translation of the Japanese-language article on our sister site Investalk, which is based on the company’s Japanese-language IR materials, with figures transcribed as reported. Sanko Gosei labels its fiscal year ended May 31, 2026 as “FY2026” in its own results materials; this article follows japan-equity.com’s convention of designating the most recently completed fiscal year as “FY2025.” Figures, tables, and segment labels below follow the source materials’ own fiscal-year numbering (FY2026 = fiscal year ended May 31, 2026; FY2025 = fiscal year ended May 31, 2025).
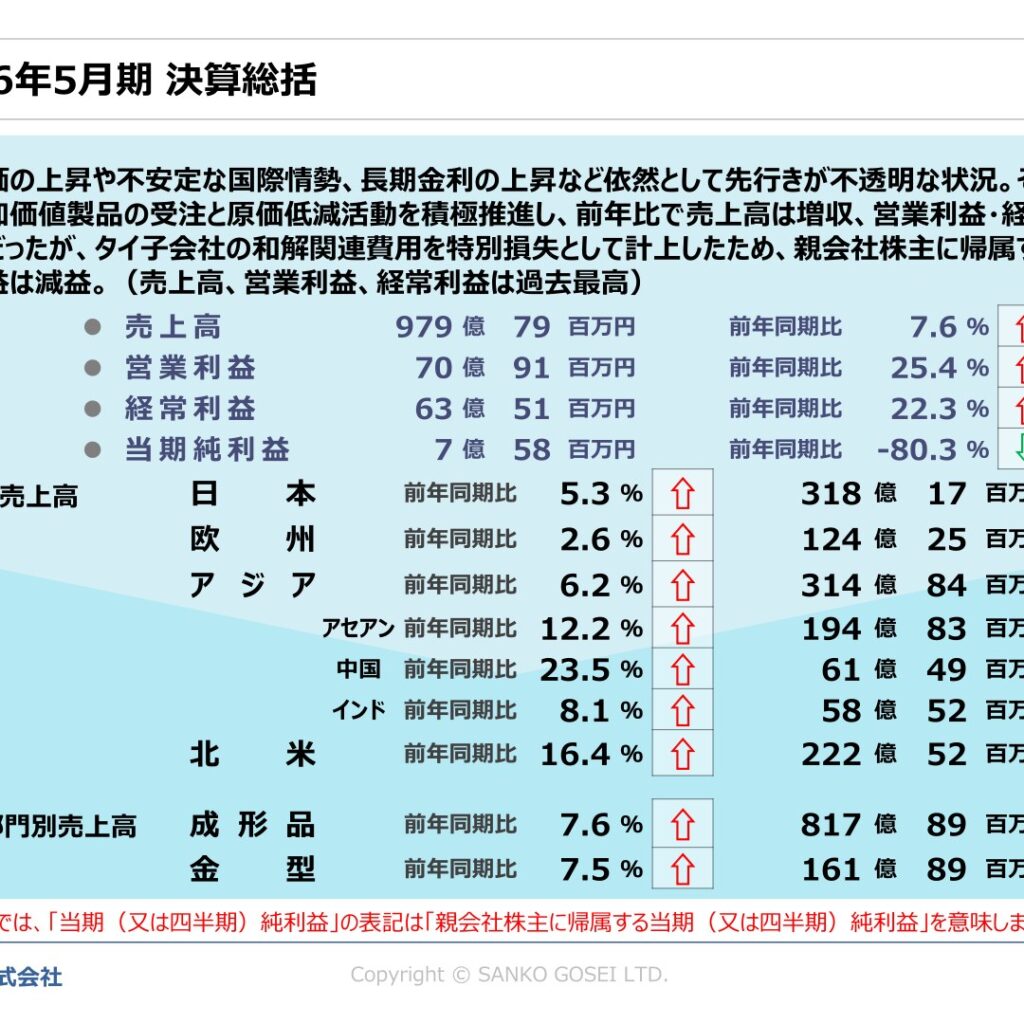
Sanko Gosei Ltd. announced results for the fiscal year ended May 31, 2026 (June 1, 2025 – May 31, 2026). Amid an uncertain outlook marked by rising prices across the board, an unstable international situation, and rising long-term interest rates, the company aggressively pursued orders for high-value-added products and cost-reduction activities. As a result, net sales reached 97,979 million yen (up 7.6% year on year), operating profit reached 7,091 million yen (up 25.4%), and ordinary profit reached 6,351 million yen (up 22.3%), with all three renewing record highs on higher revenue and higher profit. On the other hand, having recorded settlement-related expenses at its Thai subsidiary as an extraordinary loss, profit attributable to owners of parent fell sharply to 758 million yen (down 80.3%).
Consolidated Results (FY2026 Actual)
(Figures in millions of yen.) Net sales were 97,979 (versus 91,101 in FY2025, up 6,878, or +7.6%), gross profit was 16,986 (up 1,966, or +13.1%), SG&A expenses were 9,894 (up 530, or +5.7%), operating profit was 7,091 (up 1,435, or +25.4%), ordinary profit was 6,351 (up 1,157, or +22.3%), and profit attributable to owners of parent was 758 (versus 3,857 in FY2025, down 3,099, or -80.3%). ROE was 2.3% (versus 12.4% in FY2025, down 10.1 points). Progress against the initial plan (net sales of 94,000, operating profit of 6,100, ordinary profit of 5,500, and profit of 4,000) was 104.2%, 116.3%, 115.5%, and 19.0%, respectively. The materials attribute the decline in profit to the recording of settlement-related expenses at the Thai subsidiary as an extraordinary loss.
| Item | FY2026 (Actual) | FY2025 (Actual) | YoY Change |
|---|---|---|---|
| Net sales | 97,979 million yen | 91,101 million yen | +6,878 million yen (+7.6%) |
| Cost of sales | 80,993 million yen | 76,080 million yen | +4,913 million yen (+6.5%) |
| Gross profit | 16,986 million yen | 15,020 million yen | +1,966 million yen (+13.1%) |
| SG&A expenses | 9,894 million yen | 9,364 million yen | +530 million yen (+5.7%) |
| Operating profit | 7,091 million yen | 5,656 million yen | +1,435 million yen (+25.4%) |
| Ordinary profit | 6,351 million yen | 5,194 million yen | +1,157 million yen (+22.3%) |
| Profit attributable to owners of parent | 758 million yen | 3,857 million yen | -3,099 million yen (-80.3%) |
| ROE | 2.3% | 12.4% | -10.1pt |
Regional and Business Segment Performance
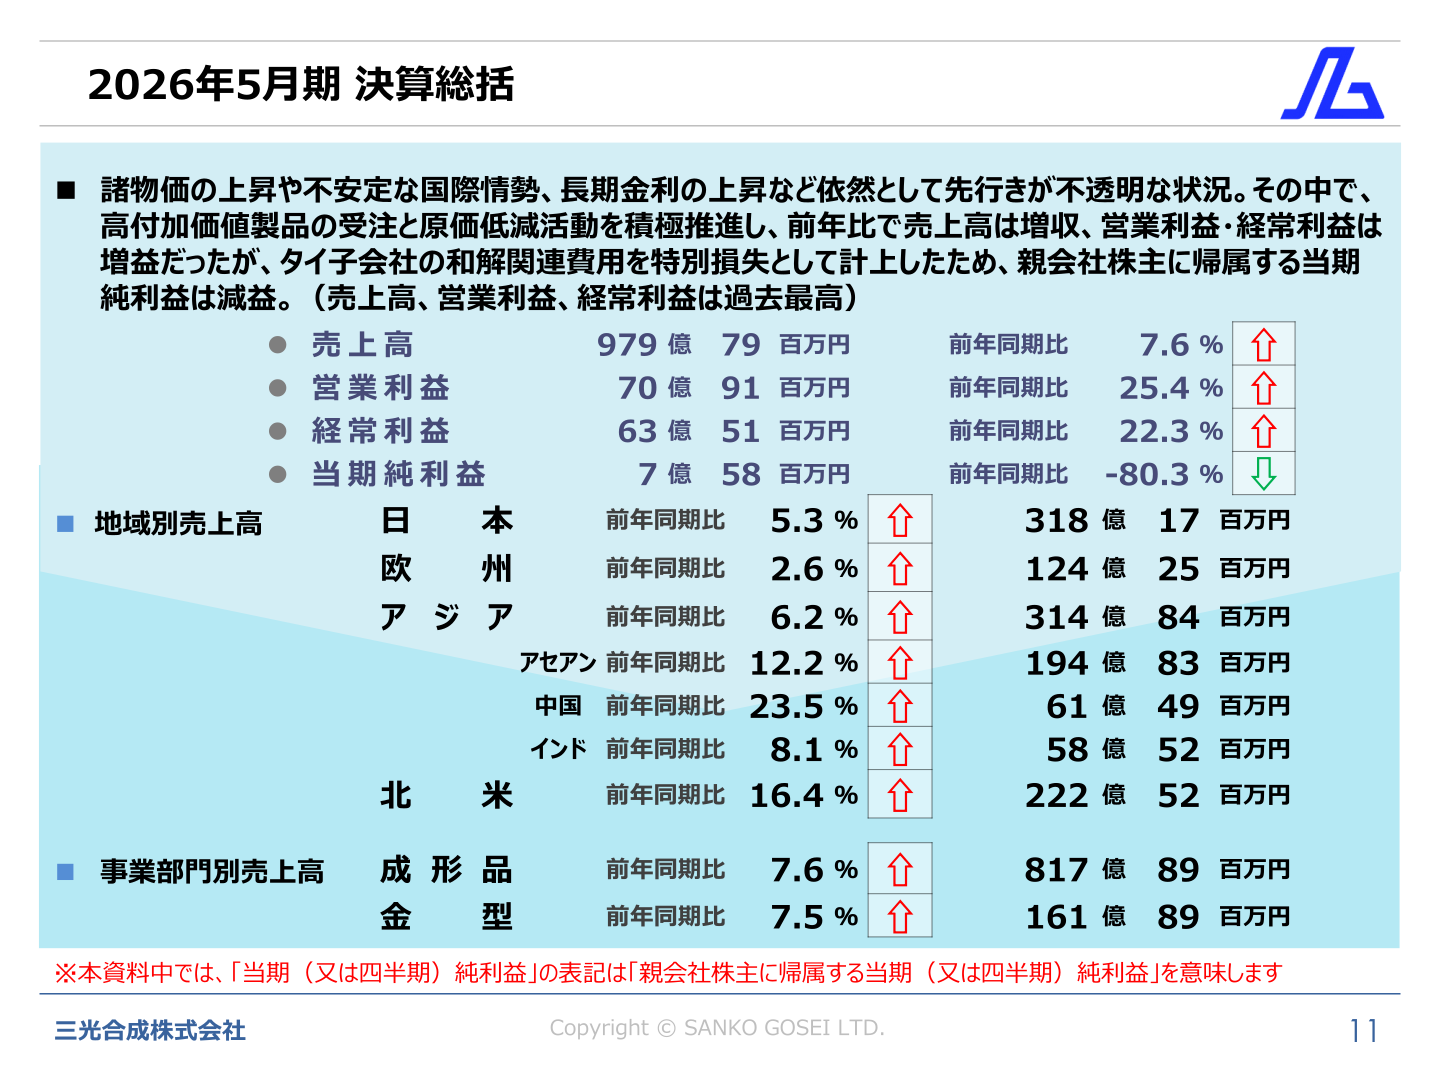
By region, net sales (in millions of yen) were Japan 31,817 (up 5.3% year on year), North America 22,252 (up 16.4%), Asia 31,484 (up 6.2%), and Europe 12,425 (up 2.6%). Within Asia, ASEAN was 19,483 (up 12.2%), China was 6,149 (up 23.5%), and India was 5,852 (up 8.1%). The materials state that Japan, North America, and Thailand led growth and that sales in India were strong, while ASEAN (excluding Thailand) struggled somewhat, Europe struggled, and China struggled significantly, though operating profit was positive at every site. By business segment, net sales (in millions of yen) were Molded Products 81,789 (up 7.6%; of which Vehicles was 70,627, up 11.5%, and Information Equipment/Home Appliances was 11,161, down 12.0%) and Molds 16,189 (up 7.5%). Within Vehicles, Auto Interior and Exterior Parts was 57,250 (up 11.5%) and Auto Functional Parts was 13,377 (up 11.1%).
| Region | FY2024 | FY2025 | FY2026 |
|---|---|---|---|
| Japan | 28,037 million yen | 30,210 million yen | 31,817 million yen |
| North America | 17,747 million yen | 19,125 million yen | 22,252 million yen |
| Asia | 33,662 million yen | 29,654 million yen | 31,484 million yen |
| Europe | 14,336 million yen | 12,110 million yen | 12,425 million yen |
| Total | 93,784 million yen | 91,101 million yen | 97,979 million yen |
Balance Sheet and Cash Flow
At the end of FY2026 (May 31, 2026), total assets were 88,363 million yen (versus 76,052 million yen at the end of FY2025, up 12,311 million yen), total liabilities were 52,971 million yen (up 9,699 million yen), and total net assets were 35,391 million yen (up 2,612 million yen). The equity ratio was 39.3% (versus 42.3% at the end of FY2025). Key factors behind the changes cited include cash and deposits +2,925 million yen, accounts receivable +2,582 million yen, property, plant and equipment +4,897 million yen, provision for settlement-related expenses +3,599 million yen, and long-term borrowings +4,152 million yen. Cash flow from operating activities was +8,414 million yen (FY2025: +8,566 million yen), cash flow from investing activities was -6,481 million yen (FY2025: -5,313 million yen), free cash flow was +1,933 million yen (FY2025: +3,253 million yen), and cash flow from financing activities was +240 million yen (FY2025: -984 million yen).
FY2027 Forecast
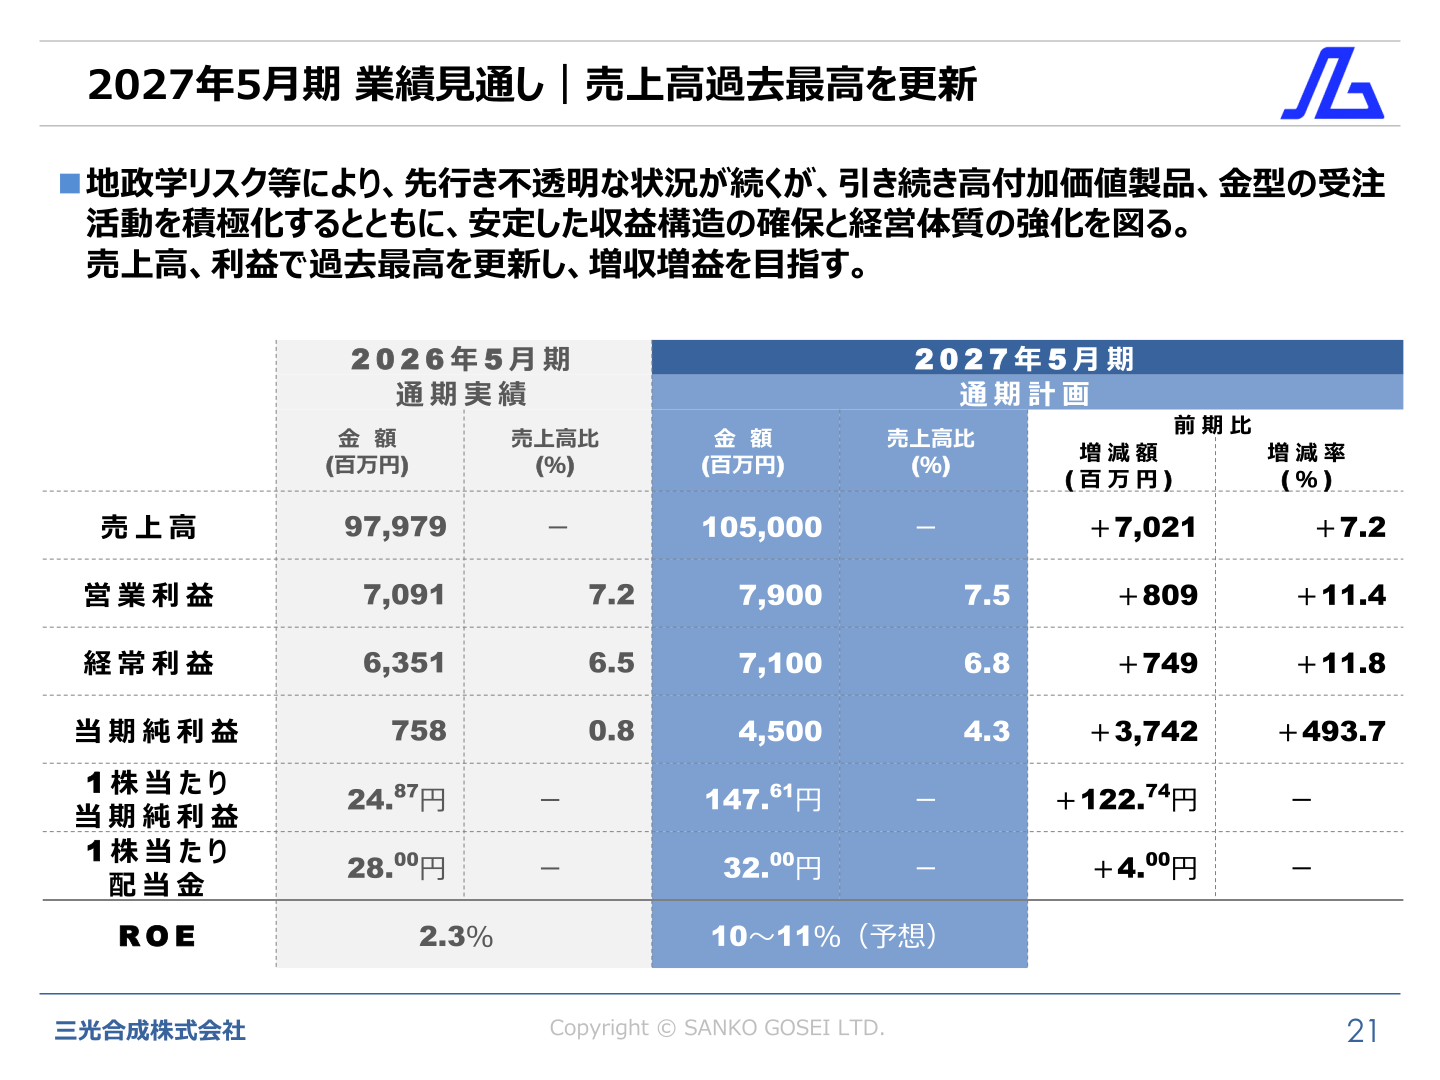
For the fiscal year ending May 31, 2027, the company expects the uncertain outlook stemming from geopolitical and other risks to continue, and plans to actively pursue orders for high-value-added products and molds while working to secure a stable earnings structure and strengthen its management foundation. It forecasts net sales of 105.0 billion yen (up 7,021 million yen, or +7.2%, year on year), operating profit of 7,900 million yen (up 809 million yen, or +11.4%), ordinary profit of 7,100 million yen (up 749 million yen, or +11.8%), and profit attributable to owners of parent of 4,500 million yen (up 3,742 million yen, or +493.7%), aiming to renew record highs in both net sales and profit alongside higher revenue and higher profit. Earnings per share is forecast at 147.61 yen (versus 24.87 yen in FY2026, up 122.74 yen), and ROE is expected to be in the 10-11% range.
| Item | FY2027 (Forecast) | FY2026 (Actual) | YoY Change |
|---|---|---|---|
| Net sales | 105,000 million yen | 97,979 million yen | +7,021 million yen (+7.2%) |
| Operating profit | 7,900 million yen | 7,091 million yen | +809 million yen (+11.4%) |
| Ordinary profit | 7,100 million yen | 6,351 million yen | +749 million yen (+11.8%) |
| Profit attributable to owners of parent | 4,500 million yen | 758 million yen | +3,742 million yen (+493.7%) |
| Earnings per share | 147.61 yen | 24.87 yen | +122.74 yen |
| ROE | 10-11% (Forecast) | 2.3% | Not disclosed |
Medium-Term Quantitative Targets
As a medium-to-long-term initiative, the company’s target operating profit margin was 6.2% in the actual results for FY2025, 7.2% in the actual results for FY2026, is forecast at 7.5% for FY2027, and is targeted at 10% as a medium-to-long-term goal for FY2028. As its medium-to-long-term target for FY2028, the company has set out a “Triple 10” goal: net sales of 100.0 billion yen, operating profit of 10.0 billion yen, and an operating profit margin of 10%.
Shareholder Returns
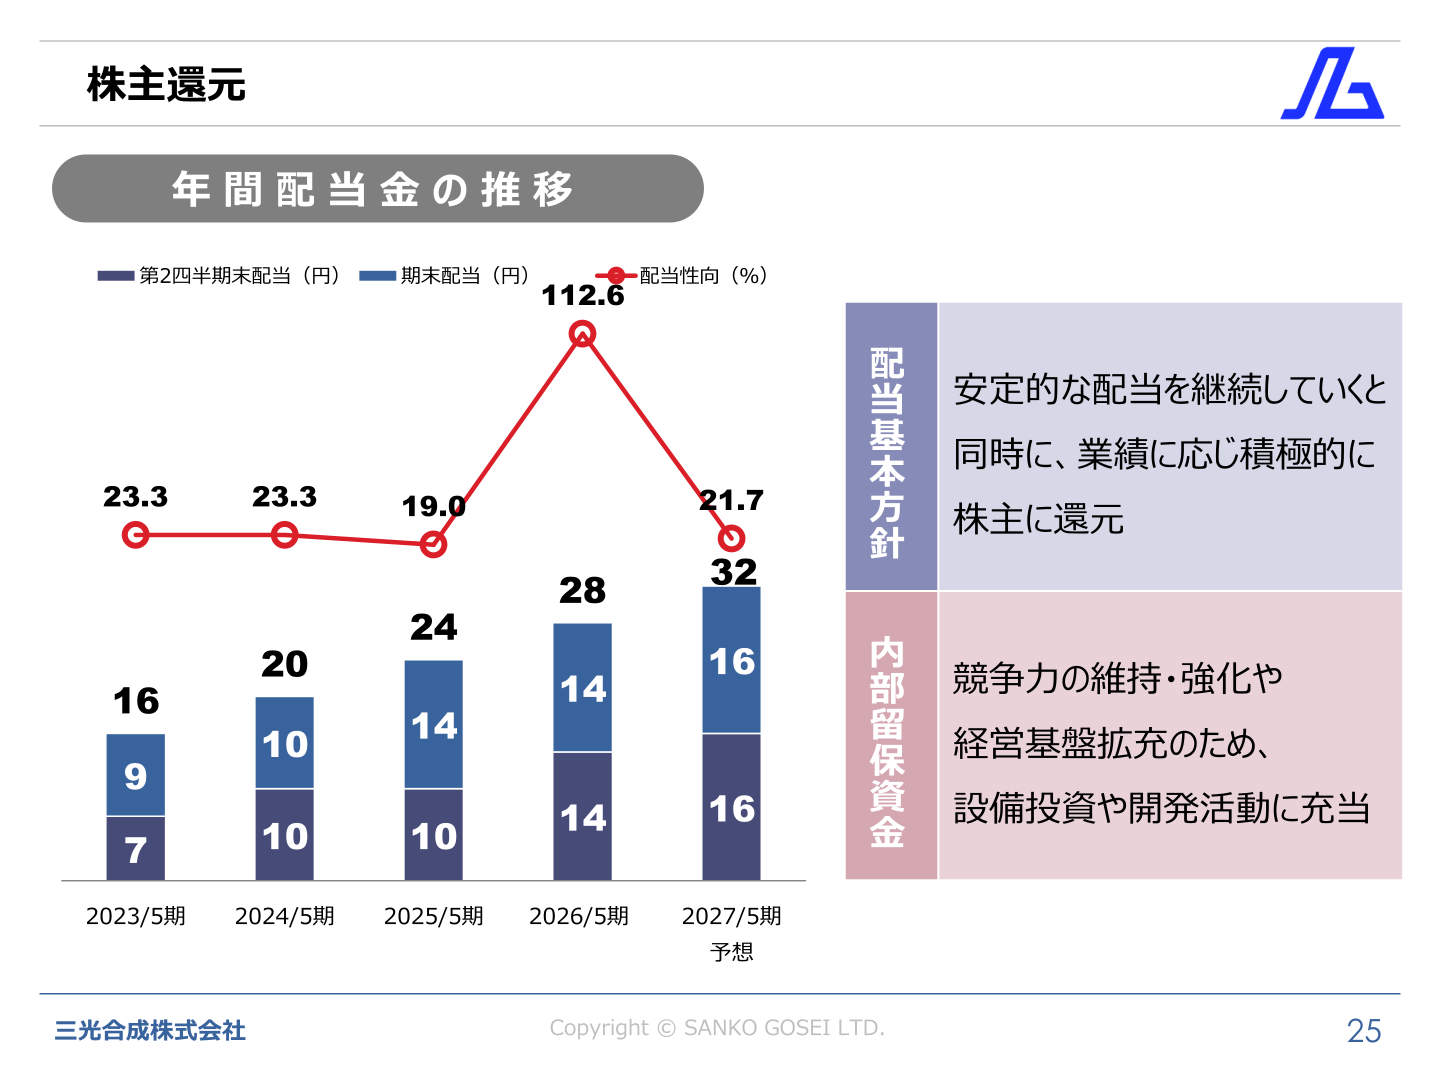
Dividend per share has continued to increase: 16 yen for FY2023, 20 yen for FY2024, 24 yen for FY2025, and 28 yen for FY2026 (interim dividend of 14 yen, year-end dividend of 14 yen), with 32 yen forecast for FY2027 (interim dividend of 16 yen, year-end dividend of 16 yen). The payout ratio was 19.0% for FY2025, rose to 112.6% for FY2026 due to the sharp decline in profit, and is expected to be 21.7% for FY2027. The company’s basic dividend policy is to continue paying stable dividends while actively returning profits to shareholders in line with business performance.
| Fiscal Year | Interim Dividend | Year-End Dividend | Annual Dividend | Payout Ratio |
|---|---|---|---|---|
| FY2023 | 7 yen | 9 yen | 16 yen | 23.3% |
| FY2024 | 10 yen | 10 yen | 20 yen | 23.3% |
| FY2025 | 10 yen | 14 yen | 24 yen | 19.0% |
| FY2026 | 14 yen | 14 yen | 28 yen | 112.6% |
| FY2027 (Forecast) | 16 yen | 16 yen | 32 yen | 21.7% |
This article is an analysis based on publicly available information and is not a recommendation to buy or sell any specific securities. Investment decisions are your own responsibility.
















