
This article is based on publicly available IR materials and is not a recommendation to buy or sell any specific securities.
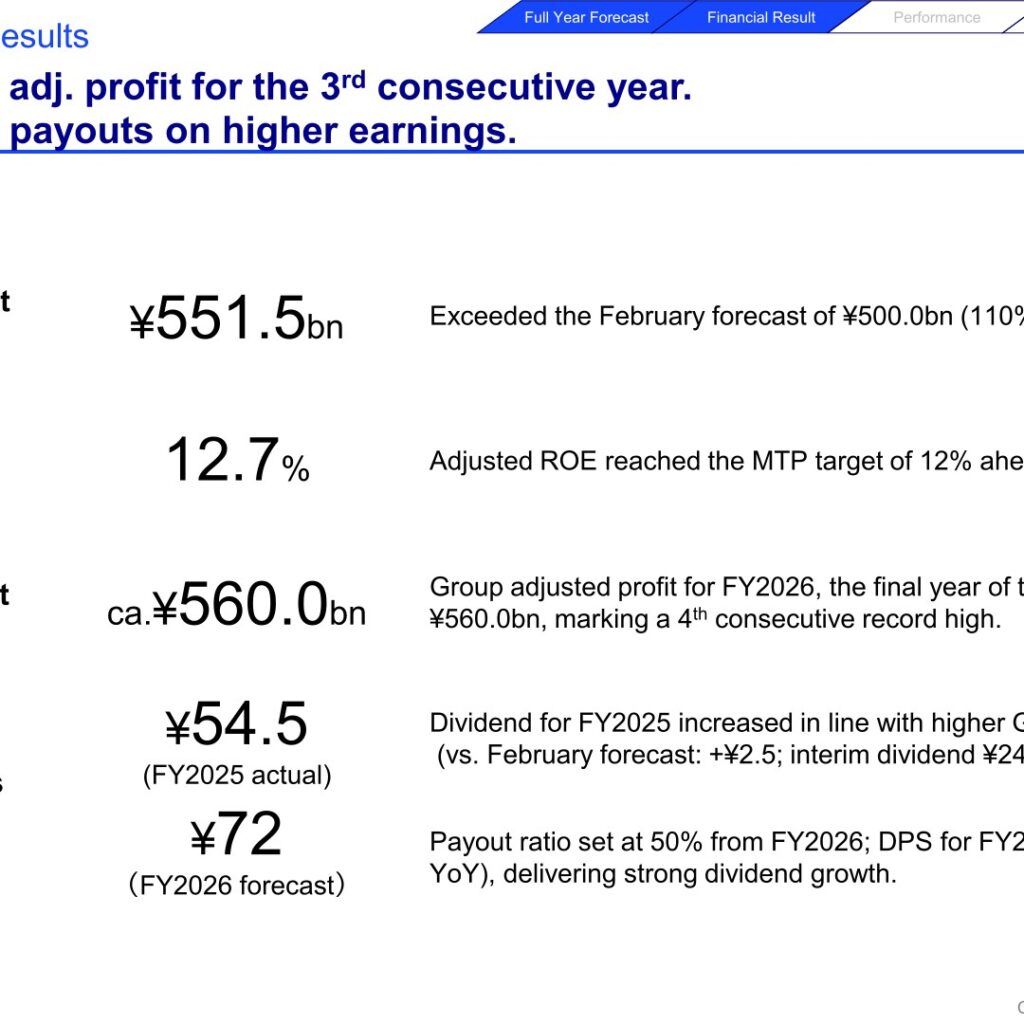
Daiichi Life Group, Inc. reported Group Adjusted Profit of ¥551.5bn for FY2025, up 25% year-on-year and a record high for the third consecutive year, exceeding the February revised forecast of ca. ¥500.0bn (110% achievement). Group Adjusted ROE rose to 12.7%, reaching the medium-term plan (MTP) target of 12% ahead of schedule. Net income attributable to shareholders of parent company was ¥436.6bn, down 5% YoY, reflecting a one-off accounting impact from Protective Life Corporation’s (PLC) adoption of the Long-Duration Targeted Improvements (LDTI) accounting standard rather than a change in underlying earnings trends. FY2025 dividend per share (DPS) was set at ¥54.5, and FY2026 DPS is forecast at ¥72, up 32% YoY, under a new payout ratio policy of 50% or higher effective from FY2026.
Consolidated Results (Full-Year Actual)
All business segments exceeded the February revised forecast. Group Adjusted Profit progressed to ¥551.5bn against the Feb. revised forecast of ca. ¥500.0bn (a 105-108% progress rate by segment). Group Embedded Value (EV) increased by ca. 18% from the end of the previous fiscal year to around ¥9.7tn, mainly due to gains in domestic equities held by Daiichi Life (DL), while Group Value of New Business (VNB) rose 1% YoY to ca. ¥173.8bn. Group ESR (economic solvency ratio, calculated using an internal model) increased to ca. 220%, up ca. 10%pt from the FY2024 year-end, as an increase in eligible capital driven by rising domestic equities more than offset higher required capital from mass lapse risk and equity risk.
| Item | FY2025 | FY2024 | Change |
|---|---|---|---|
| Group Adjusted Profit | ¥551.5bn | ¥439.5bn | +¥112.1bn (+25%) |
| Ordinary revenues | ¥11,308.3bn | ¥9,876.6bn | +¥1,431.7bn (+14%) |
| Ordinary profit | ¥753.7bn | ¥755.7bn | (¥2.0bn) (0%) |
| Net income (attributable to shareholders of parent company) | ¥436.6bn | ¥458.4bn | (¥21.8bn) (-5%) |
| Group Adjusted ROE | 12.7% | 10.7% | +2.0%pt |
| Group ESR (approximate, end of period) | ca. 220% | 210% | ca. +10%pt |
| Dividend per share | ¥54.5 | ¥34.25 | +¥20.25 |
Segment Results
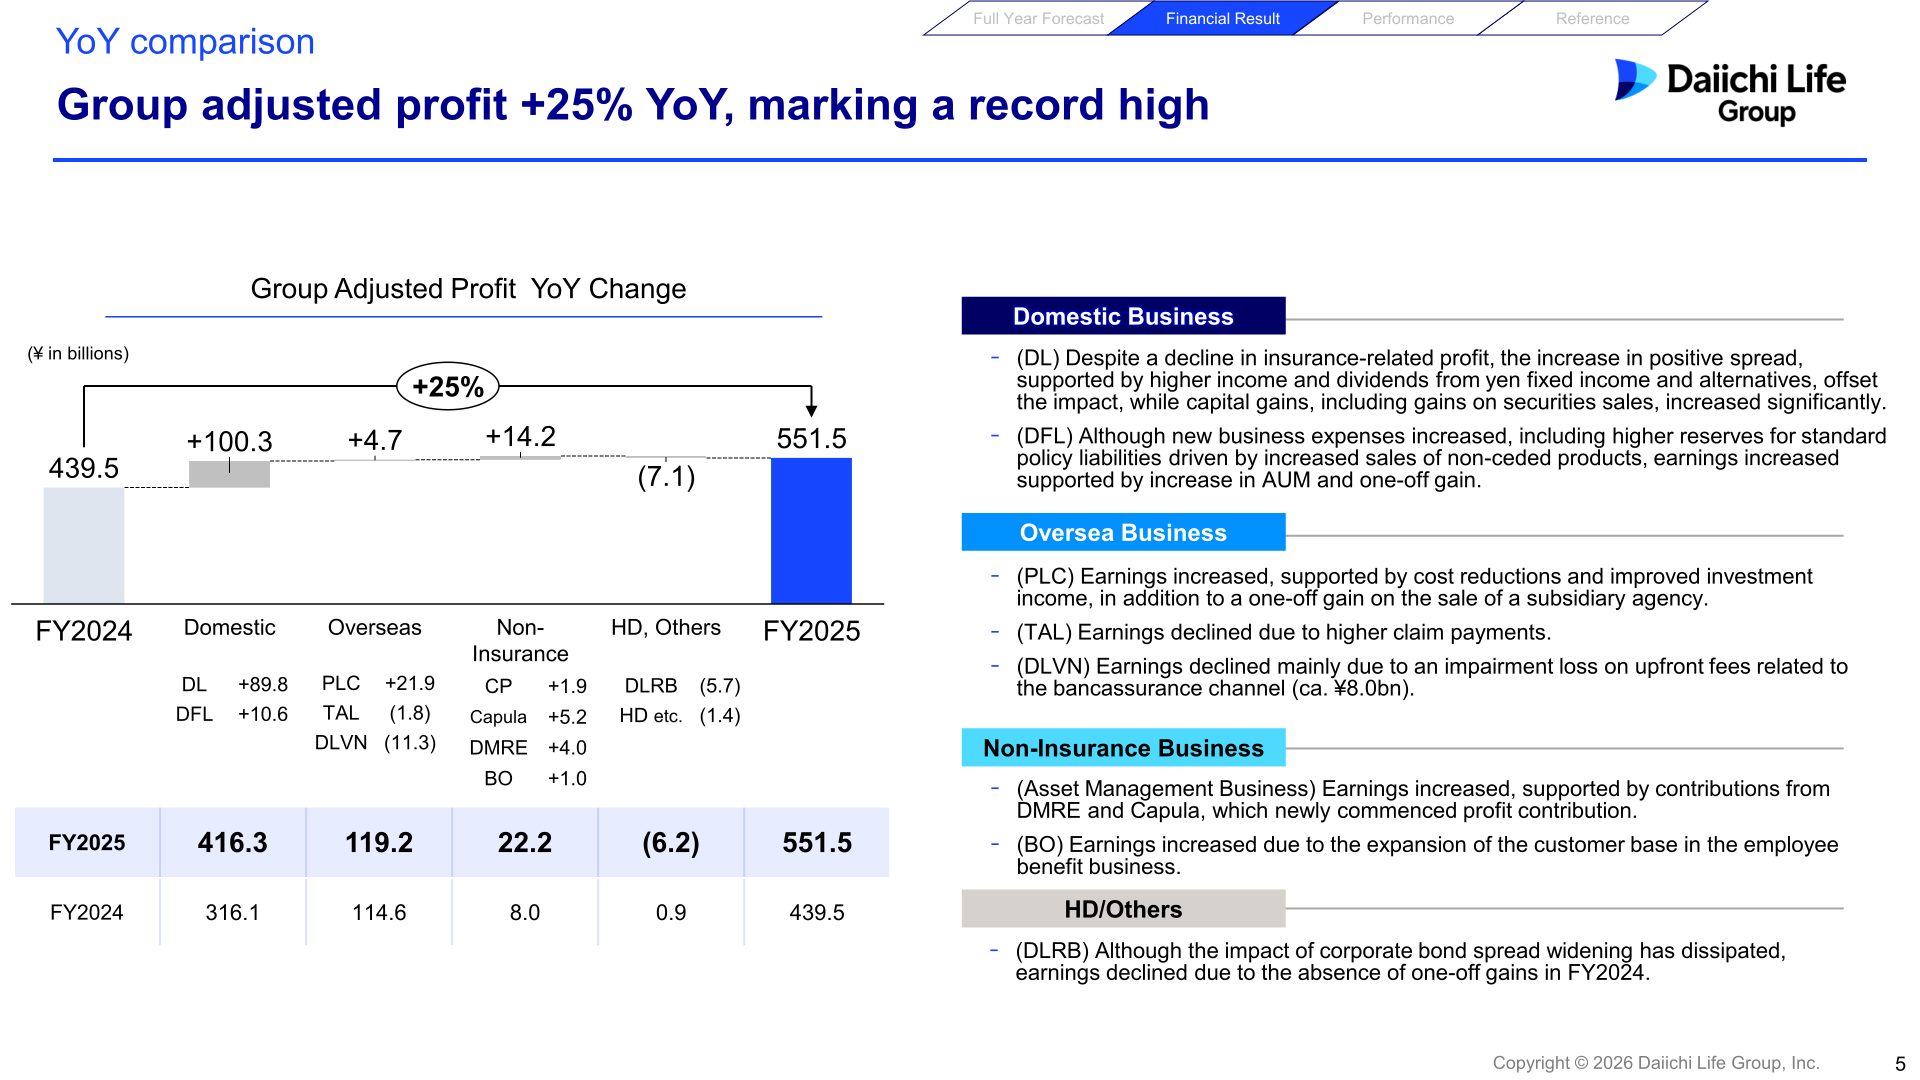
By business category, Domestic Business contributed Group Adjusted Profit of ¥416.3bn (up ¥100.3bn YoY), led by Daiichi Life (DL), where higher positive spread — supported by increased income and dividend as well as higher-than-expected gains from core insurance activities — drove the increase, and by Daiichi Frontier Life (DFL), supported by AUM growth and a one-off gain from the cancellation of reinsurance contracts. Overseas Business contributed ¥119.2bn (up ¥4.7bn YoY): Protective (PLC) earnings increased on cost reductions, improved investment income and a one-off gain on the sale of a subsidiary agency; TAL’s earnings declined due to higher claim payments; and Dai-ichi Life Vietnam’s (DLVN) earnings declined mainly due to an impairment loss on upfront fees related to the bancassurance channel (ca. ¥8.0bn). Non-Insurance Business contributed ¥22.2bn (up ¥14.2bn YoY), supported by new profit contributions from DMRE and Capula and by expansion of Benefit One’s (BO) customer base. By major subsidiary, YoY changes in Group Adjusted Profit were: DL +¥89.8bn, DFL +¥10.6bn, PLC +¥21.9bn, TAL ¥(1.8)bn, DLVN ¥(11.3)bn, CP +¥1.9bn, Capula +¥5.2bn, DMRE +¥4.0bn, BO +¥1.0bn, Daiichi Life Reinsurance Bermuda (DLRB) ¥(5.7)bn, and HD/Others ¥(1.4)bn.
| Segment | Metric | FY2025 | FY2024 |
|---|---|---|---|
| Domestic Business | Group Adjusted Profit | ¥416.3bn | ¥316.1bn |
| Overseas Business | Group Adjusted Profit | ¥119.2bn | ¥114.6bn |
| Non-Insurance Business | Group Adjusted Profit | ¥22.2bn | ¥8.0bn |
| HD, Others | Group Adjusted Profit | ¥(6.2)bn | ¥0.9bn |
| Group Total | Group Adjusted Profit | ¥551.5bn | ¥439.5bn |
FY2026 Forecast
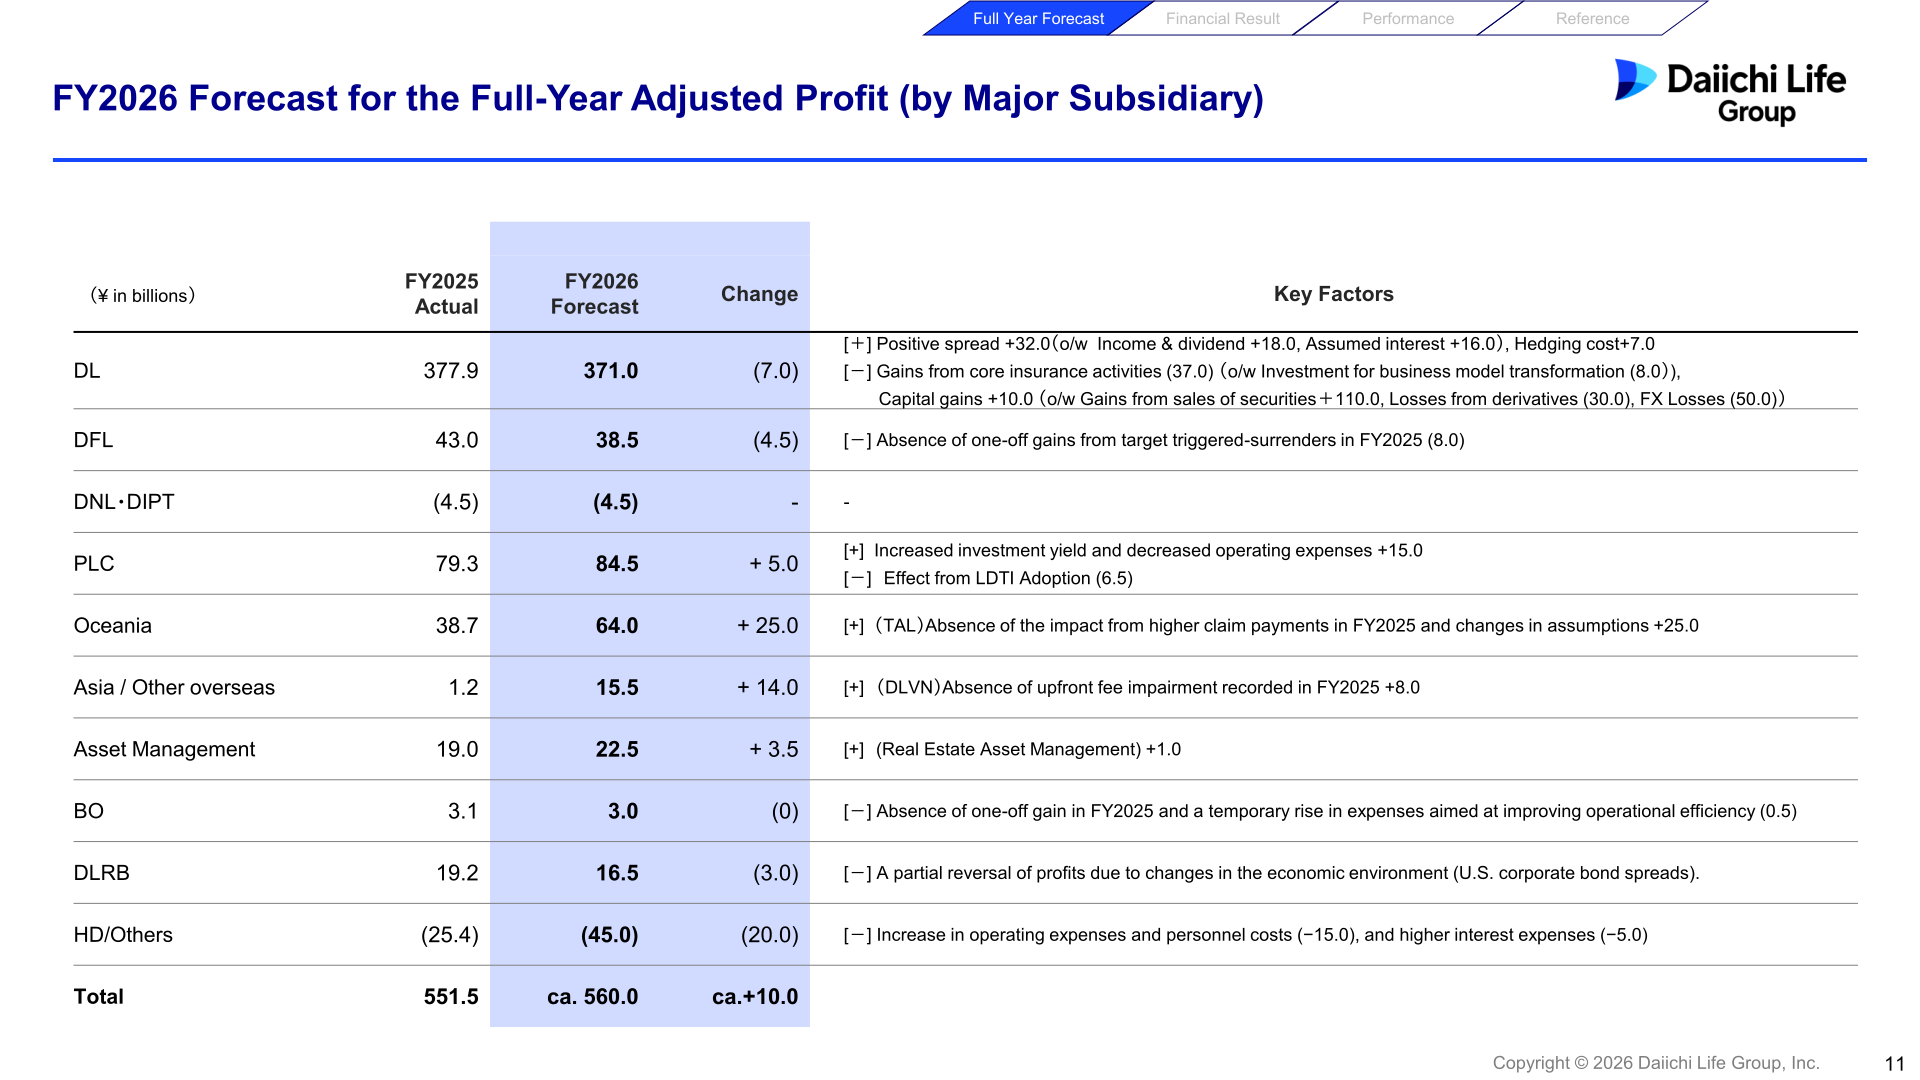
Group Adjusted Profit for FY2026, the final year of the current Medium-Term Plan (MTP), is forecast at ca. ¥560.0bn, up ca. ¥10.0bn (+2%) YoY, marking a record high for the fourth consecutive year. Domestic business is expected to remain broadly flat at a high level, while profit growth in Overseas business — led by an expected ¥25.0bn earnings increase at TAL on premium rate revisions and steady repricing of in-force policies — is projected to drive the increase. Adjusted ROE is expected to remain broadly in line with the FY2025 level. The full-year forecast of Group VNB for FY2027 is scheduled to be disclosed on May 27, 2026 at the Financial Analyst Meeting.
| Company/Segment | FY2025 Actual | FY2026 Forecast | Change |
|---|---|---|---|
| DL | ¥377.9bn | ¥371.0bn | (¥7.0bn) |
| DFL | ¥43.0bn | ¥38.5bn | (¥4.5bn) |
| DNL・DIPT | ¥(4.5)bn | ¥(4.5)bn | – |
| PLC | ¥79.3bn | ¥84.5bn | +¥5.0bn |
| Oceania (TAL) | ¥38.7bn | ¥64.0bn | +¥25.0bn |
| Asia / Other overseas | ¥1.2bn | ¥15.5bn | +¥14.0bn |
| Asset Management | ¥19.0bn | ¥22.5bn | +¥3.5bn |
| BO | ¥3.1bn | ¥3.0bn | (¥0bn) |
| DLRB | ¥19.2bn | ¥16.5bn | (¥3.0bn) |
| HD/Others | ¥(25.4)bn | ¥(45.0)bn | (¥20.0bn) |
| Group Total (Group Adjusted Profit) | ¥551.5bn | ca. ¥560.0bn | ca. +¥10.0bn |
Shareholder Returns
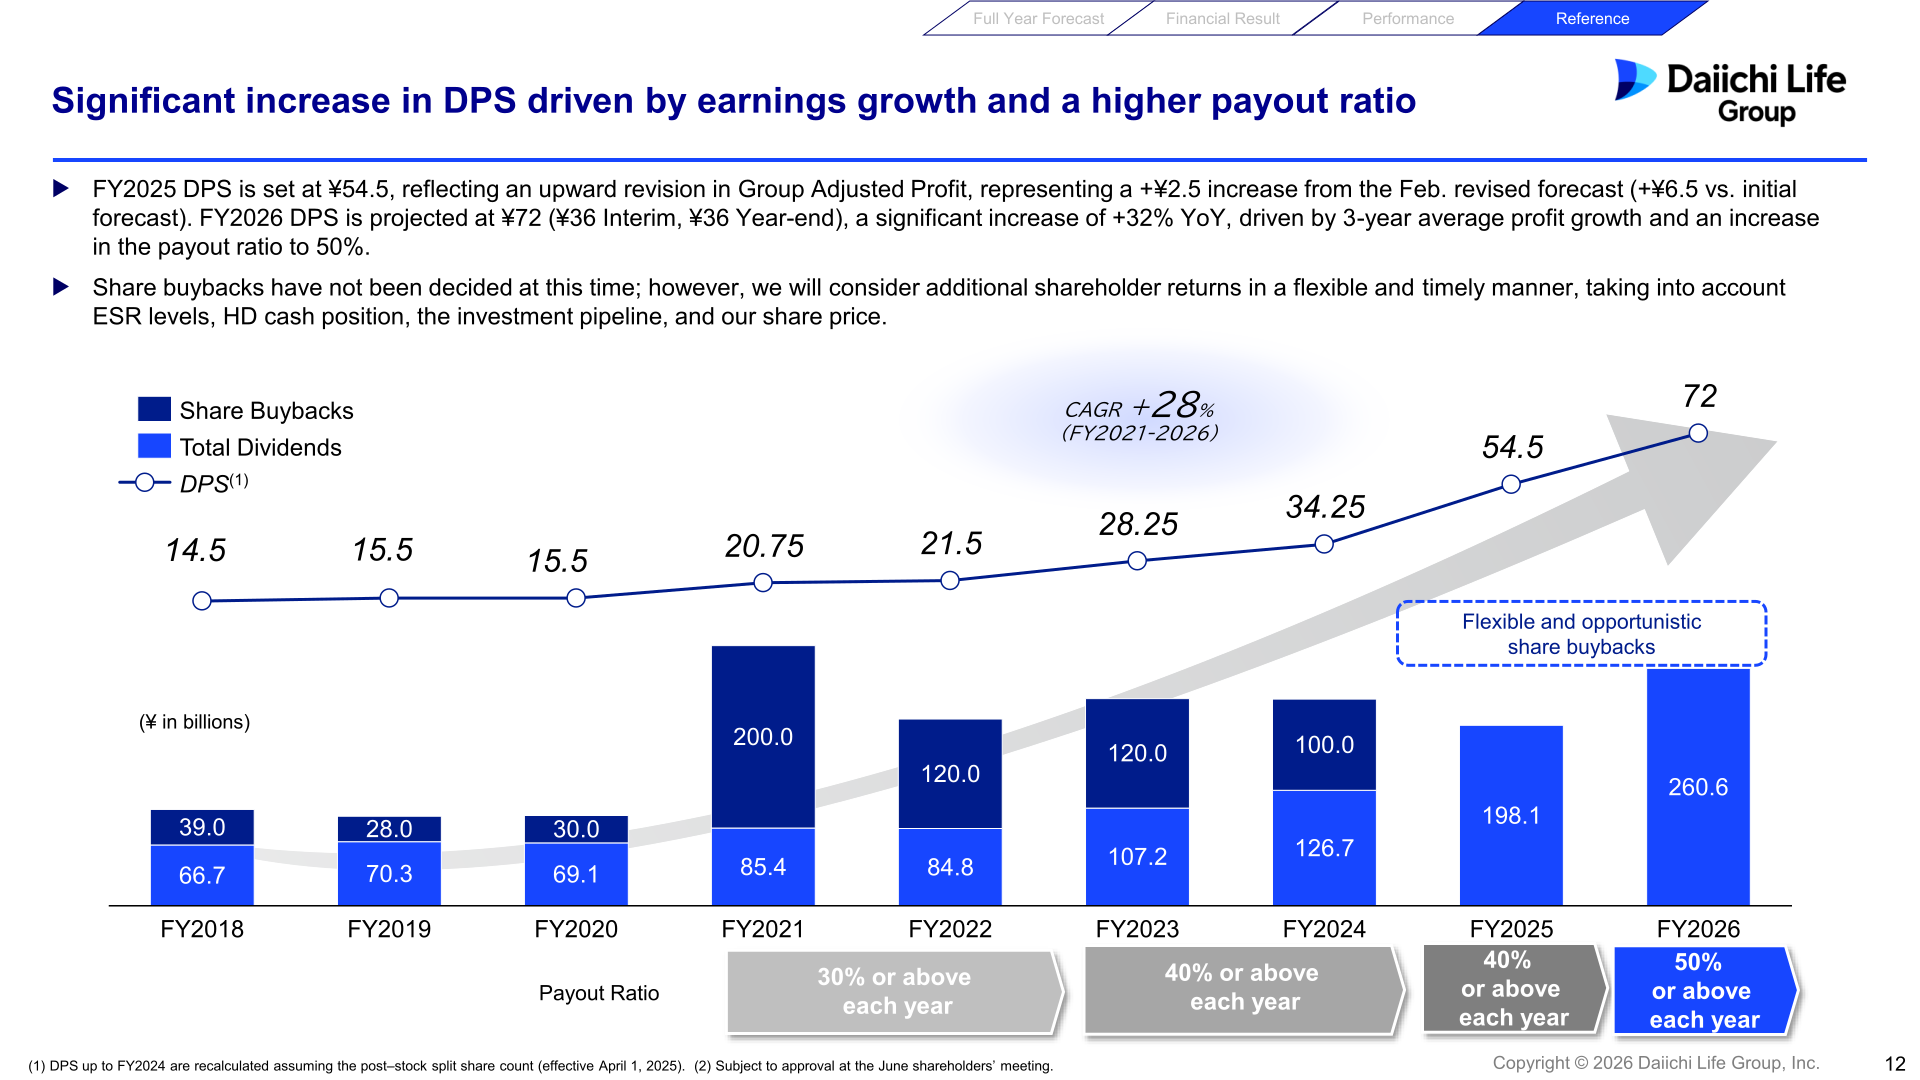
FY2025 dividend per share (DPS) was set at ¥54.5, up ¥20.25 YoY, reflecting the upward revision in Group Adjusted Profit and ¥2.5 above the February revised forecast (interim dividend ¥24, year-end dividend ¥30.5). From FY2026, the Company has adopted a dividend payout ratio policy of 50% or higher each fiscal year, effective from the FY2026 interim dividend, based on the average Group Adjusted Profit of the past three years; the prior guideline for a total payout ratio (dividends plus buybacks) of 50% or higher on average over the medium term has been discontinued. FY2026 DPS is forecast at ¥72 (¥36 interim, ¥36 year-end), up 32% YoY, representing a DPS CAGR of +28% over FY2021-2026. Share buybacks for FY2026 have not been decided at this time; the Company states it will consider additional shareholder returns flexibly and in a timely manner, taking into account ESR levels, the holding company’s cash position, the investment pipeline, and the share price. Treasury stock is expected to be cancelled at an appropriate timing unless held for a specific reason.
| Item | FY2024 | FY2025 (Actual) | FY2026 (Forecast) |
|---|---|---|---|
| Dividend per share | ¥34.25 | ¥54.5 | ¥72 |
| Interim / Year-end DPS | – | ¥24 / ¥30.5 | ¥36 / ¥36 |
| Dividend payout ratio policy | 40% or above each year | 40% or above each year | 50% or above each year |
Medium-Term Plan / Topics
FY2026 is the final year of the Group’s current Medium-Term Plan. Group Adjusted ROE for FY2025 reached 12.7%, achieving the MTP target of 12% ahead of schedule, and Group Adjusted Profit is forecast to reach a record high for the fourth consecutive year in FY2026. On overseas growth, Protective Life Corporation (PLC) announced the acquisition of Obsidian Insurance Holdings, Inc., a New York State-based hybrid fronting company operating in both the admitted and E&S (excess and surplus) segments of the U.S. P&C insurance market. Obsidian primarily earns fronting fees through license provision and reinsurance arrangements while retaining ca. 5% of risk on its own balance sheet; the deal is expected to close by the end of FY2026 or Q1 FY2027, subject to regulatory approval, and will be funded with PLC’s cash on hand (investment amount not disclosed). In the next Medium-Term period, the acquisition is expected to contribute ca. USD 30-40mn to Adjusted Profit, while Group ESR is expected to see a temporary decline of ca. 1-2%. Separately, Daiichi Frontier Life (DFL) plans a capital reduction (filed for approval in February 2026, effective March 23, 2026) under the Group’s capital circulation management approach, with the resulting surplus funds to be allocated to dividends to the holding company and redeployed to growth businesses.
This article is an analysis based on publicly available information and is not a recommendation to buy or sell any specific securities. Investment decisions are your own responsibility.
![[Obayashi] Investors’ Guide 2026 — The Complete 24-Article Breakdown](https://japan-equity.com/wp-content/uploads/2026/07/hub_cover-1024x1024.png)
![[Obayashi] IR & SR Policy — Feeding Dialogue Back into Management](https://japan-equity.com/wp-content/uploads/2026/07/p32_sq-1024x1024.jpg)
![[Obayashi] Domestic Civil Engineering — Resilience Spending Supports 9.6% Margin](https://japan-equity.com/wp-content/uploads/2026/07/p11_sq-1024x1024.jpg)
![[Obayashi] Overseas Construction — Orders Reach ¥1.2tn](https://japan-equity.com/wp-content/uploads/2026/07/p15_sq-1024x1024.jpg)
![[Obayashi] Share Price & External Ratings — vs TOPIX, ESG Index Inclusion](https://japan-equity.com/wp-content/uploads/2026/07/p40_sq-1024x1024.jpg)
![[Construction] ¥75.5tn Investment, Shrinking Workforce — Big-5 Market Share](https://japan-equity.com/wp-content/uploads/2026/07/p12_sq-1024x1024.jpg)



![[Obayashi] Capital Policy & Shareholder Returns — ROE 10%+, DOE ~5%, ¥100bn Buyback](https://japan-equity.com/wp-content/uploads/2026/07/p27_sq-1024x1024.jpg)
![[Obayashi] Reducing Cross-Shareholdings — ¥285.2bn Sold in Five Years](https://japan-equity.com/wp-content/uploads/2026/07/p29_sq-1024x1024.jpg)
![[Obayashi] ¥750bn Investment Plan — ¥300bn to Development, ¥190bn to Tech/DX](https://japan-equity.com/wp-content/uploads/2026/07/p30_sq-1024x1024.jpg)
![[Obayashi] MTP2022 KPIs — Operating Profit ~2x Target, ROE 14.4%](https://japan-equity.com/wp-content/uploads/2026/07/p25_sq-1024x1024.jpg)
![[Obayashi] Cash Allocation — ¥420bn Investment CF Over Five Years](https://japan-equity.com/wp-content/uploads/2026/07/p26_sq-1024x1024.jpg)
![[Obayashi] Green Energy — 44 Plants, 344MW, and the Green Hydrogen Challenge](https://japan-equity.com/wp-content/uploads/2026/07/p21_sq-1024x1024.jpg)
![[Obayashi] Tackling the Labor Shortage — Robotics Construction®](https://japan-equity.com/wp-content/uploads/2026/07/p14_sq-1024x1024.jpg)
