
This article is based on publicly available IR materials and is not a recommendation to buy or sell any specific securities.
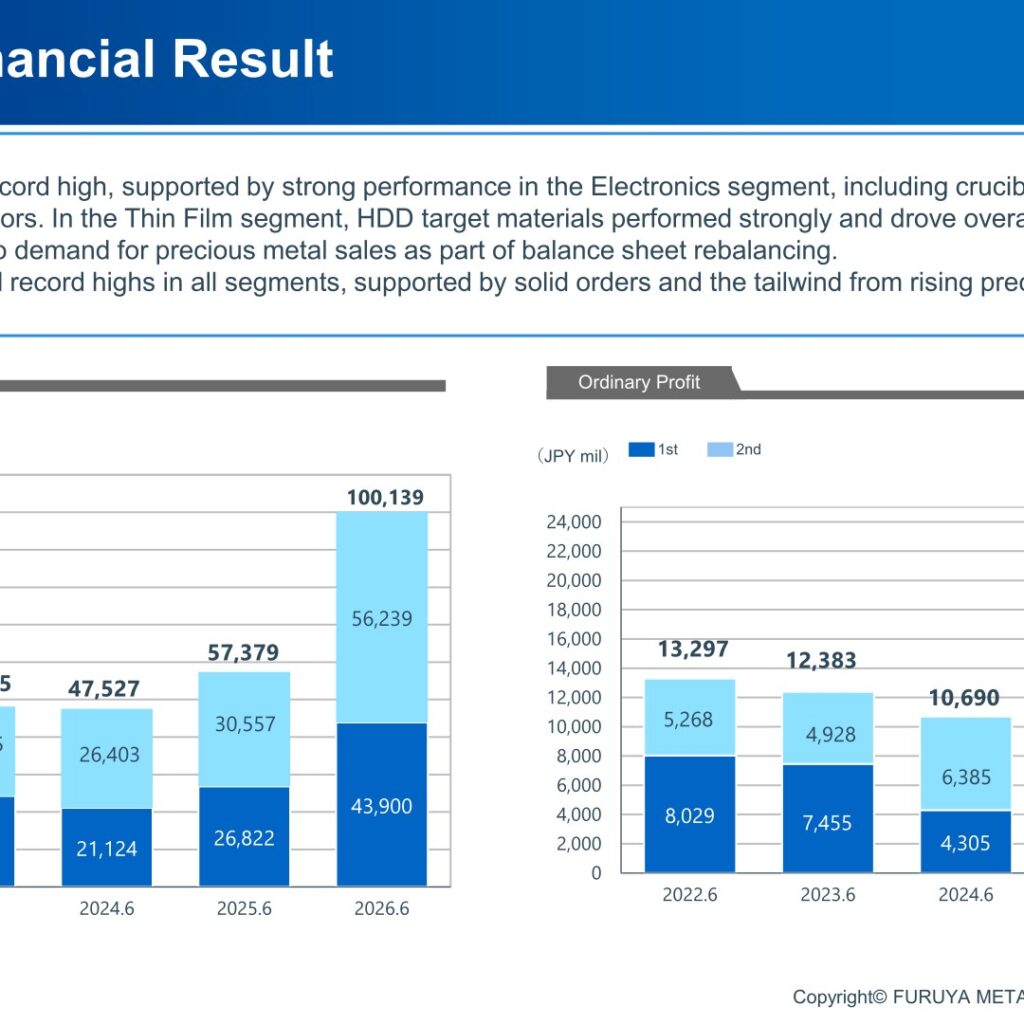
FURUYA METAL CO., LTD. (7826) reported record-high net sales and profit at every income stage for the fiscal year ended June 30, 2026, which the Company designates “FY2026” (its 58th fiscal term); this site classifies the results in its FY2025 series alongside other companies’ most recently completed fiscal year. Consolidated net sales exceeded ¥100.0 billion for the first time, reaching ¥100,139 million, an increase of ¥42.7 billion from the previous year, while gross profit rose to ¥30,272 million, an increase of ¥16.0 billion. All segments exceeded the previous year’s results, led by the Electronics segment (crucibles for medical equipment and optical cable isolators) and the Thin Film segment (HDD target materials for data centers). The Company also cited resilient demand in the information and telecommunications, semiconductor and electronics markets, rising precious metal market prices, and a yen that remained weaker against the U.S. dollar than planned.
Consolidated Results (Full-Year Actual)
Revenue rose to ¥100,139 million from ¥57,379 million a year earlier, and gross income rose to ¥30,272 million from ¥14,188 million, lifting the gross income ratio to 30.2% from 24.7%. Operating income increased to ¥24,794 million from ¥9,538 million, and ordinary income increased to ¥24,664 million from ¥9,389 million, for an ordinary income ratio of 24.6% versus 16.4% a year earlier. Net income rose to ¥16,034 million from ¥6,468 million. Full-year revenue reached 104.3% of the Company’s most recent budget and net income reached 106.9% of budget.
| Item | FY2026 (Actual) | FY2025 (Actual) |
|---|---|---|
| Revenue (millions of yen) | 100,139 | 57,379 |
| Cost of Sales (millions of yen) | 69,866 | 43,191 |
| Gross Income (millions of yen / ratio) | 30,272 (30.2%) | 14,188 (24.7%) |
| SG&A Expenses (millions of yen) | 5,477 | 4,650 |
| Operating Income (millions of yen) | 24,794 | 9,538 |
| Ordinary Income (millions of yen / ratio) | 24,664 (24.6%) | 9,389 (16.4%) |
| Net Income (millions of yen) | 16,034 | 6,468 |
Segment Results
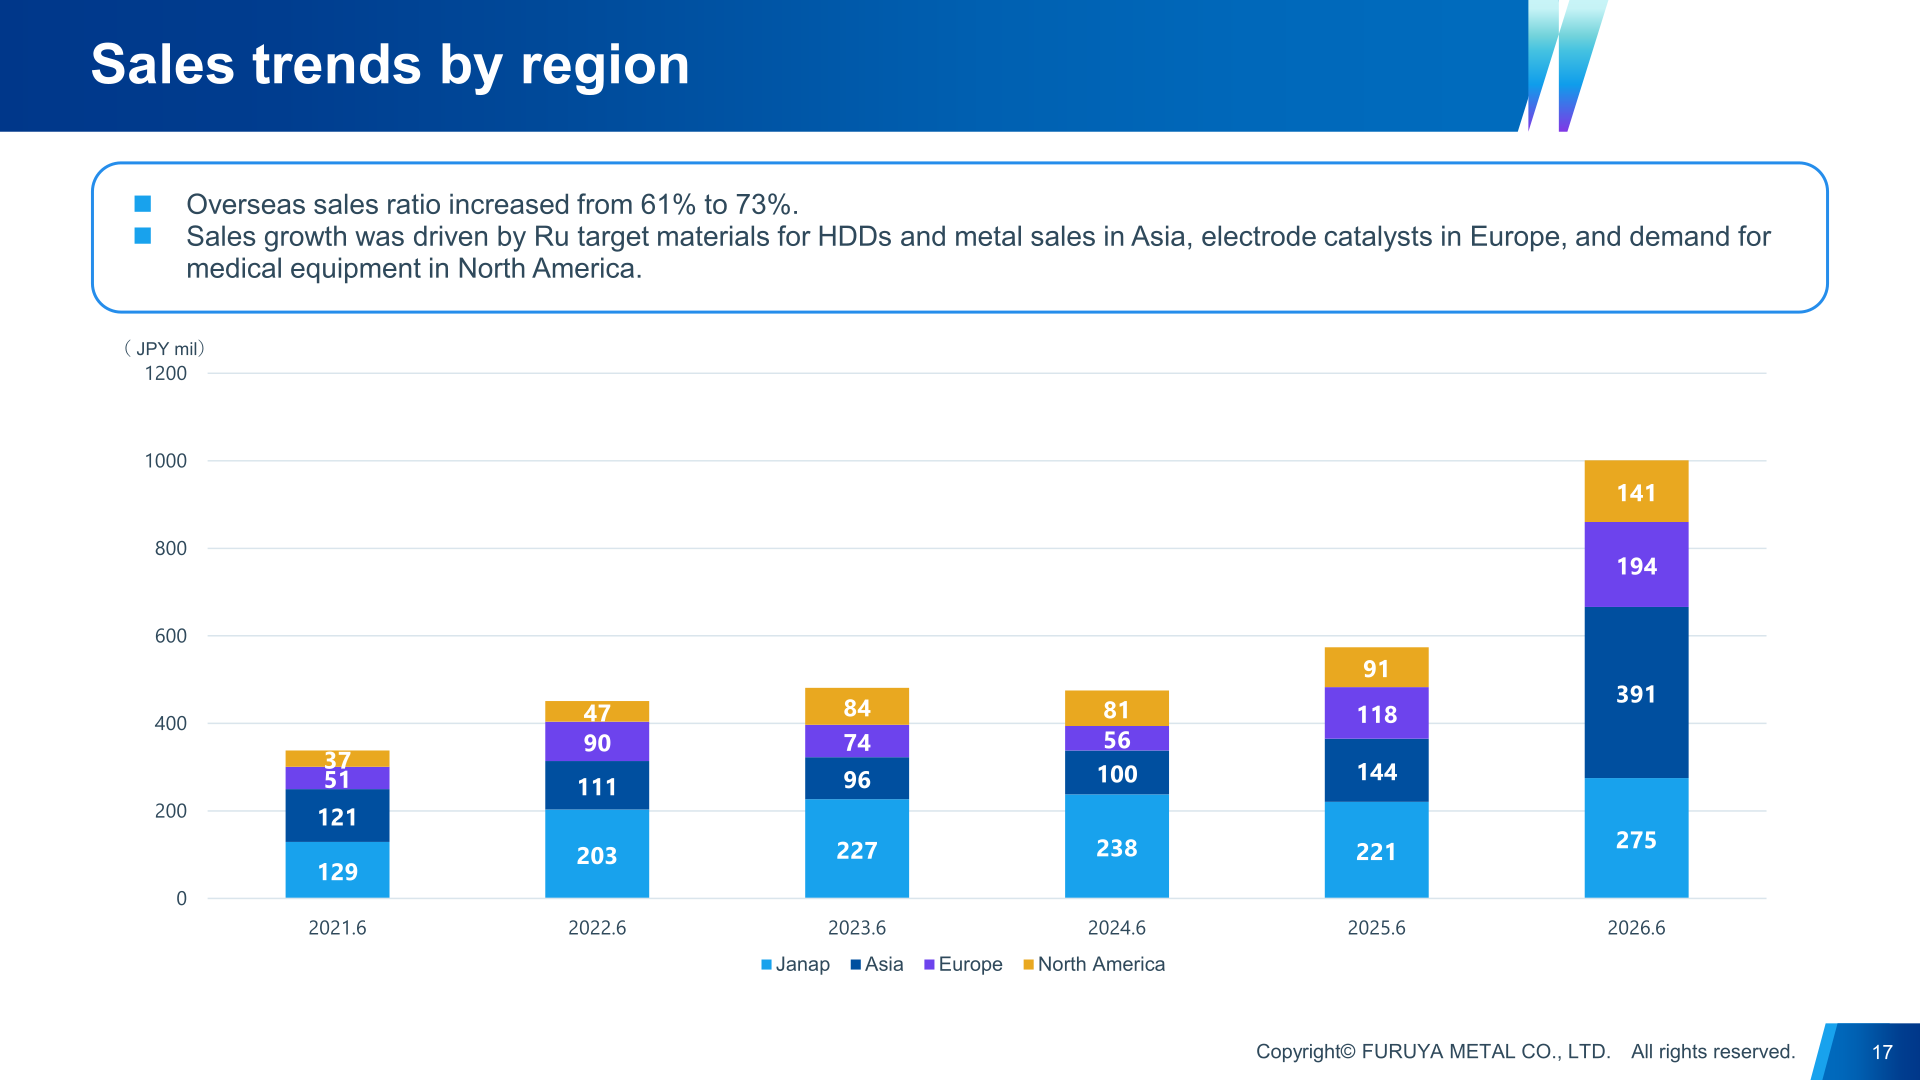
By segment, all five business segments exceeded the previous year’s results. In Electronics, orders for crucibles used in medical equipment (including PET scintillator crystals) and optical cable isolators were strong. In Thin Film, ruthenium target materials for HDDs performed strongly on data center-related demand, and semiconductor target materials for EUV applications remained solid. In Thermal, replacement demand from semiconductor manufacturing equipment makers was firm. In Fine Chemicals and Recycling, revenue and gross profit increased even as the segment recorded temporary expenses in the fourth quarter related to a review of the collection and refining system and related assets. Supply Chain Support revenue and profit rose on metal sales executed in response to inquiries and balance sheet rebalancing. Overseas sales ratio rose from 61% to 73%, driven by ruthenium target materials and metal sales in Asia, electrode catalysts in Europe, and medical equipment demand in North America.
| Segment | Metric | FY2026 (Actual) | FY2025 (Actual) |
|---|---|---|---|
| Electronics | Net Sales (millions of yen) | 10,807 | 5,904 |
| Electronics | Gross Profit (millions of yen) | 3,361 | 1,729 |
| Thin Film | Net Sales (millions of yen) | 18,034 | 11,271 |
| Thin Film | Gross Profit (millions of yen) | 9,494 | 4,305 |
| Thermal | Net Sales (millions of yen) | 6,688 | 4,860 |
| Thermal | Gross Profit (millions of yen) | 2,326 | 1,548 |
| Fine Chemicals and Recycling | Net Sales (millions of yen) | 27,701 | 26,328 |
| Fine Chemicals and Recycling | Gross Profit (millions of yen) | 9,161 | 6,458 |
| Supply Chain Support | Net Sales (millions of yen) | 19,044 | 7,653 |
| Supply Chain Support | Gross Profit (millions of yen) | 2,331 | 40 |
| Total | Net Sales (millions of yen) | 100,139 | 57,379 |
| Total | Gross Profit (millions of yen) | 30,272 | 14,188 |
FY2027 Forecast
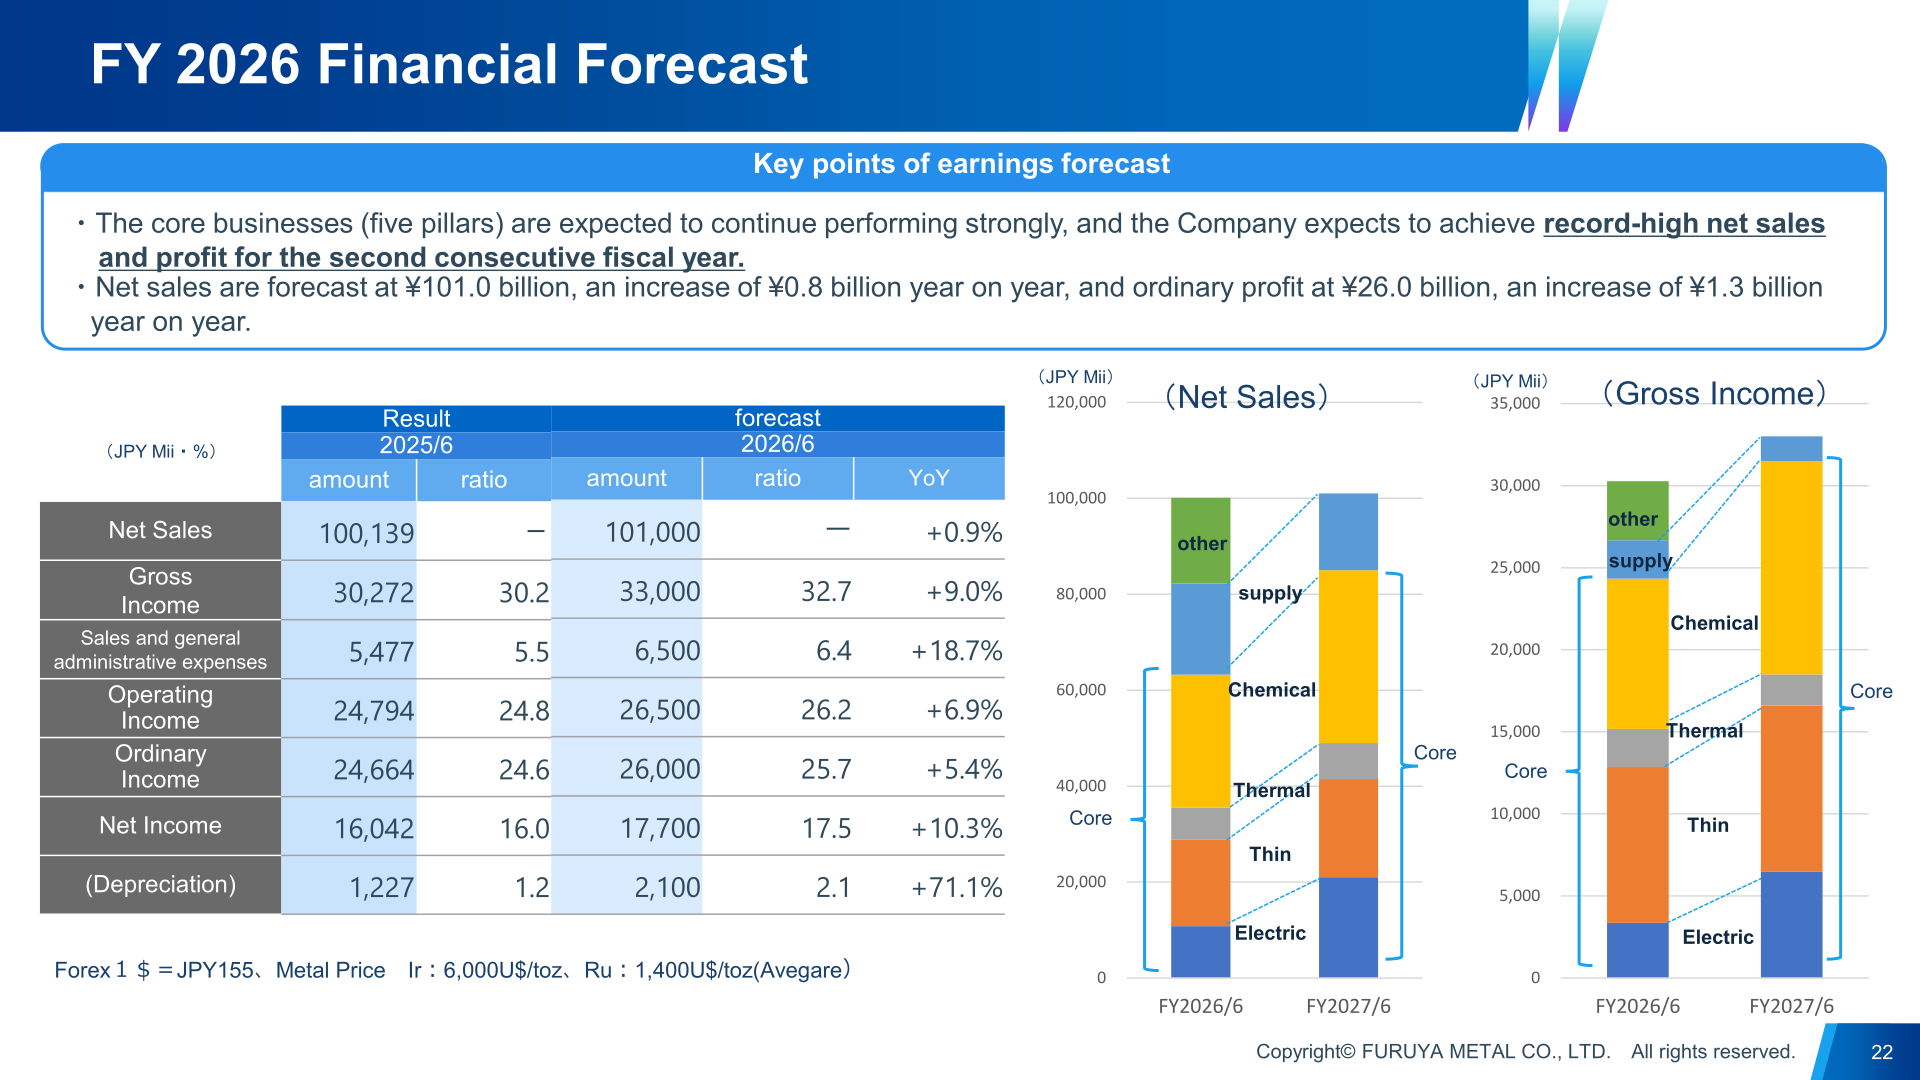
For the fiscal year ending June 30, 2027 (the 59th fiscal term), the Company expects to achieve record-high net sales and profit for a second consecutive fiscal year, supported by continued strong performance across its core businesses (“five pillars”). Net sales are forecast at ¥101,000 million (+0.9% year on year), gross income at ¥33,000 million (+9.0%), SG&A expenses at ¥6,500 million (+18.7%), operating income at ¥26,500 million (+6.9%), ordinary income at ¥26,000 million (+5.4%), and net income at ¥17,700 million (+10.3%). The forecast assumes an exchange rate of ¥155 per U.S. dollar and average metal prices of $6,000/toz for iridium and $1,400/toz for ruthenium. (Note: the presentation’s forecast summary tables on these pages label the two columns “2025/6” and “2026/6”; based on the figures matching the FY2026 actual results above and the accompanying bar charts on the same page, which are labeled “FY2026/6” and “FY2027/6”, this article presents the columns as FY2026 (Actual) and FY2027 (Forecast).) By segment, Electronics and Fine Chemicals & Recycling are expected to see the largest revenue and profit growth, while Thermal profit is expected to be affected by higher depreciation from the start of operations at the New Chitose Plant, and Supply Chain Support revenue and profit are planned lower based on the current outlook for demand.
| Item | FY2027 Forecast | FY2026 (Actual) | Change (YoY) |
|---|---|---|---|
| Net Sales (millions of yen) | 101,000 | 100,139 | +0.9% |
| Gross Income (millions of yen / ratio) | 33,000 (32.7%) | 30,272 (30.2%) | +9.0% |
| SG&A Expenses (millions of yen / ratio) | 6,500 (6.4%) | 5,477 (5.5%) | +18.7% |
| Operating Income (millions of yen / ratio) | 26,500 (26.2%) | 24,794 (24.8%) | +6.9% |
| Ordinary Income (millions of yen / ratio) | 26,000 (25.7%) | 24,664 (24.6%) | +5.4% |
| Net Income (millions of yen / ratio) | 17,700 (17.5%) | 16,042 (16.0%) | +10.3% |
| Depreciation (millions of yen / ratio) | 2,100 (2.1%) | 1,227 (1.2%) | +71.1% |
Shareholder Returns
The annual dividend for FY2026 was ¥165 per share (dividend payout ratio over 25%), an increase of ¥69 from the ¥96 per share paid in FY2025. For FY2027, the Company plans to pay an annual dividend of ¥180 per share. The dividend per share figures for the fiscal years ended June 2022 through June 2024 are presented as if a stock split had taken place at the beginning of the fiscal year ended June 2022; the dividend for the fiscal year ended June 2024 included a commemorative dividend for the Company’s listing on the Tokyo Stock Exchange Prime Market, and on July 1, 2024, the Company implemented a three-for-one stock split of its common shares.
Medium-Term Plan / Topics — KFK Vision 2030
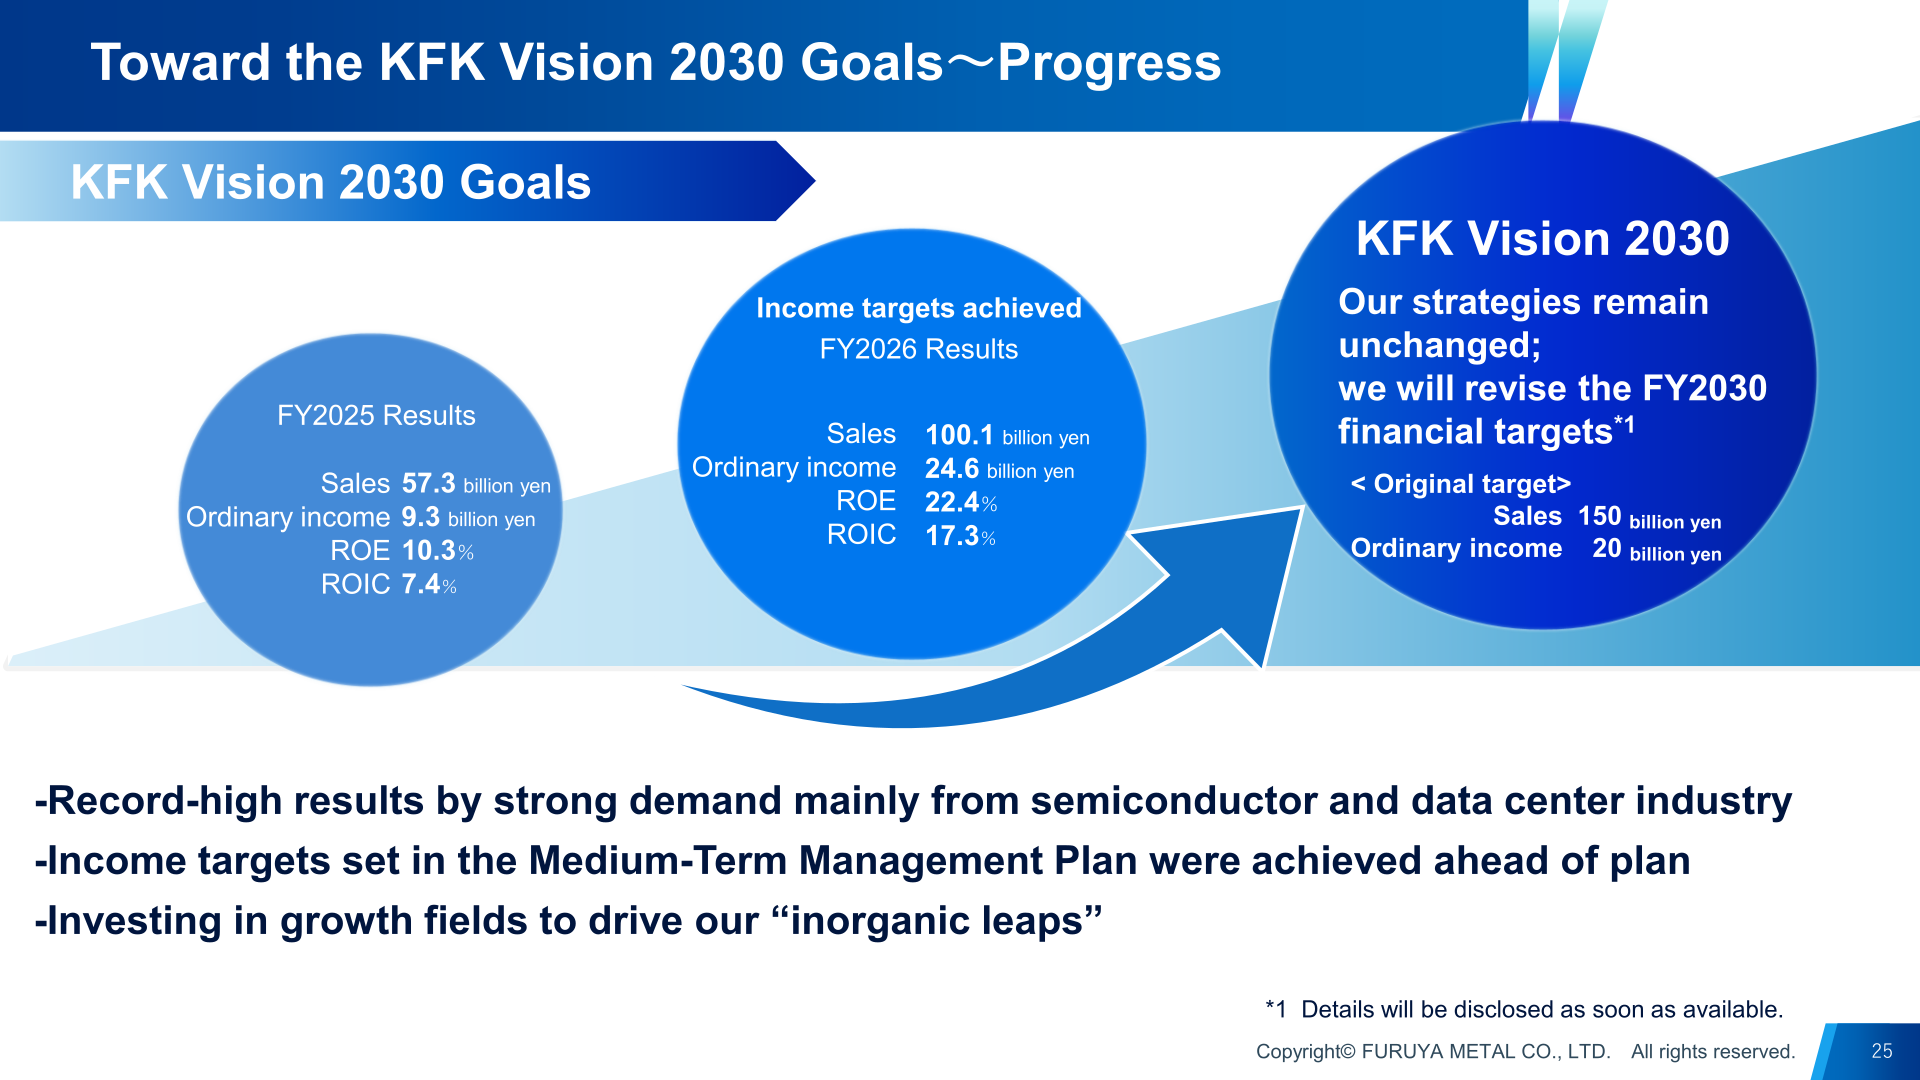
Under its long-term plan KFK Vision 2030, the Company’s vision is to become the world’s No.1 in iridium and ruthenium. FY2026 results (sales of ¥100.1 billion, ordinary income of ¥24.6 billion, ROE of 22.4% and ROIC of 17.3%) compare with FY2025 results (sales of ¥57.3 billion, ordinary income of ¥9.3 billion, ROE of 10.3% and ROIC of 7.4%). The Company stated that the income targets set in its Medium-Term Management Plan were achieved ahead of plan versus the original 2030 targets of ¥150 billion in sales and ¥20 billion in ordinary income, and that while its strategies remain unchanged, it will revise its FY2030 financial targets, with details to be disclosed as soon as available. Separately, the Company plans to invest approximately ¥30 billion in growth initiatives — including capital investment, R&D and M&A — in areas such as data centers, cutting-edge semiconductors, next-generation communications, green hydrogen, mobility and resource circulation, as part of building new business pillars toward KFK Vision 2030.
This article is an analysis based on publicly available information and is not a recommendation to buy or sell any specific securities. Investment decisions are your own responsibility.
















