
This article is based on publicly available IR materials and is not a recommendation to buy or sell any specific securities.
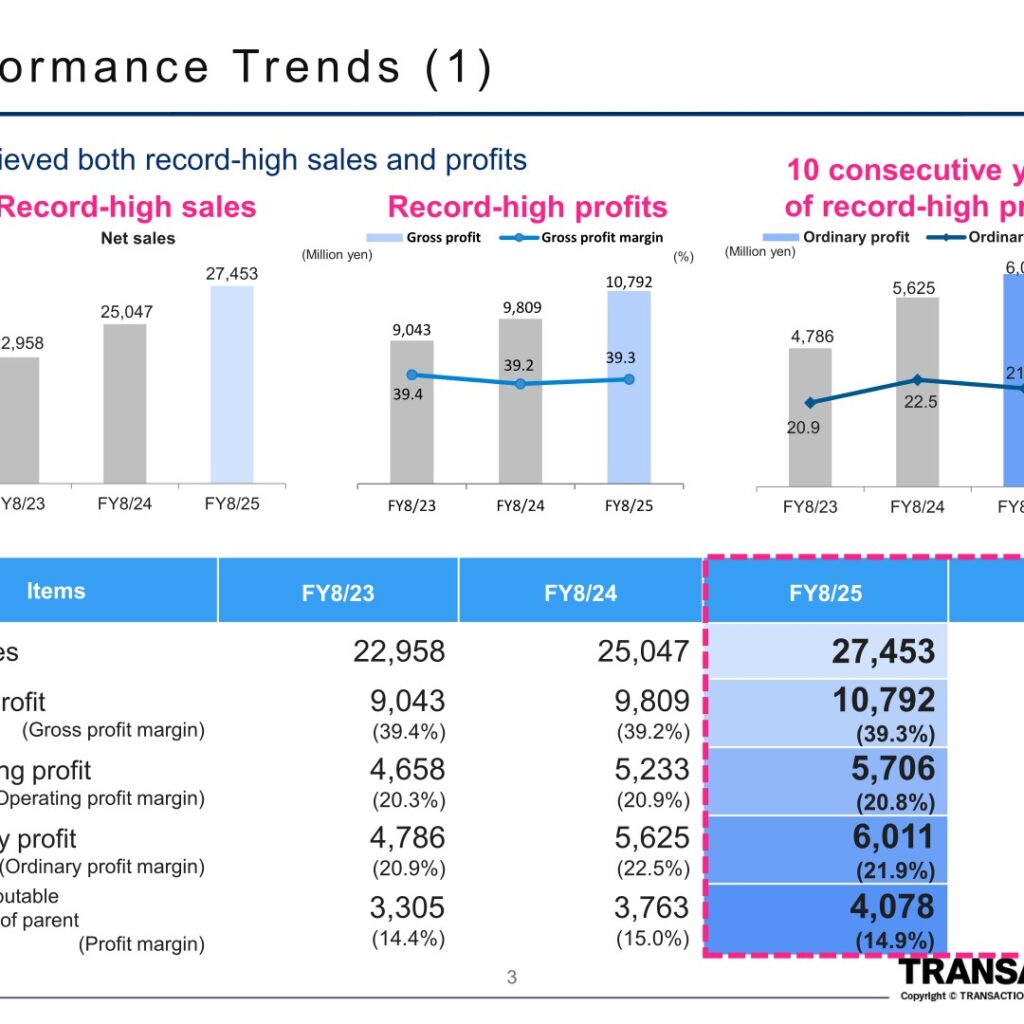
TRANSACTION Co., Ltd. labels its fiscal year ended August 31, 2025 as “FY8/25” in its financial results materials; this article follows japan-equity.com’s convention of referring to it as FY2025, while retaining the company’s original “FY8/23”-“FY8/30” notation in tables and figures reproduced from the presentation. TRANSACTION, an OEM manufacturer and e-commerce marketer of eco-products, lifestyle products, wellness products, and other consumer goods, achieved both record-high sales and record-high profit in FY8/25, marking the 10th consecutive year of record-high profit. B2B website sales performed strongly throughout the year, and although D2C website sales slowed in the second quarter, they improved significantly in the most recent period, with e-commerce sales accounting for more than 30% of total sales in the fourth quarter. Compared with the full-year forecast, ordinary profit and profit attributable to owners of parent exceeded plan, while net sales and operating profit slightly fell short of plan due to delays in the arrival of some new products.
Consolidated Results (Full-Year Actual)
Consolidated net sales increased to 27,453 million yen, an index of 109.6% of the previous year. Operating profit rose to 5,706 million yen (109.0% of the previous year), ordinary profit increased to 6,011 million yen (106.9%), and profit attributable to owners of parent rose to 4,078 million yen (108.4%). Versus the FY8/25 plan, net sales were 98.4% of plan (a shortfall of 446 million yen against a plan of 27,900 million yen) and operating profit was 97.5% of plan, while ordinary profit and profit attributable to owners of parent exceeded plan at 100.9% and 104.2% of plan, respectively.
| Item | FY8/23 | FY8/24 | FY8/25 | YoY |
|---|---|---|---|---|
| Net sales | 22,958 | 25,047 | 27,453 | 109.6% |
| Gross profit (margin) | 9,043 (39.4%) | 9,809 (39.2%) | 10,792 (39.3%) | 110.0% |
| Operating profit (margin) | 4,658 (20.3%) | 5,233 (20.9%) | 5,706 (20.8%) | 109.0% |
| Ordinary profit (margin) | 4,786 (20.9%) | 5,625 (22.5%) | 6,011 (21.9%) | 106.9% |
| Profit attributable to owners of parent (margin) | 3,305 (14.4%) | 3,763 (15.0%) | 4,078 (14.9%) | 108.4% |
Segment Results (Sales by Product Classification)
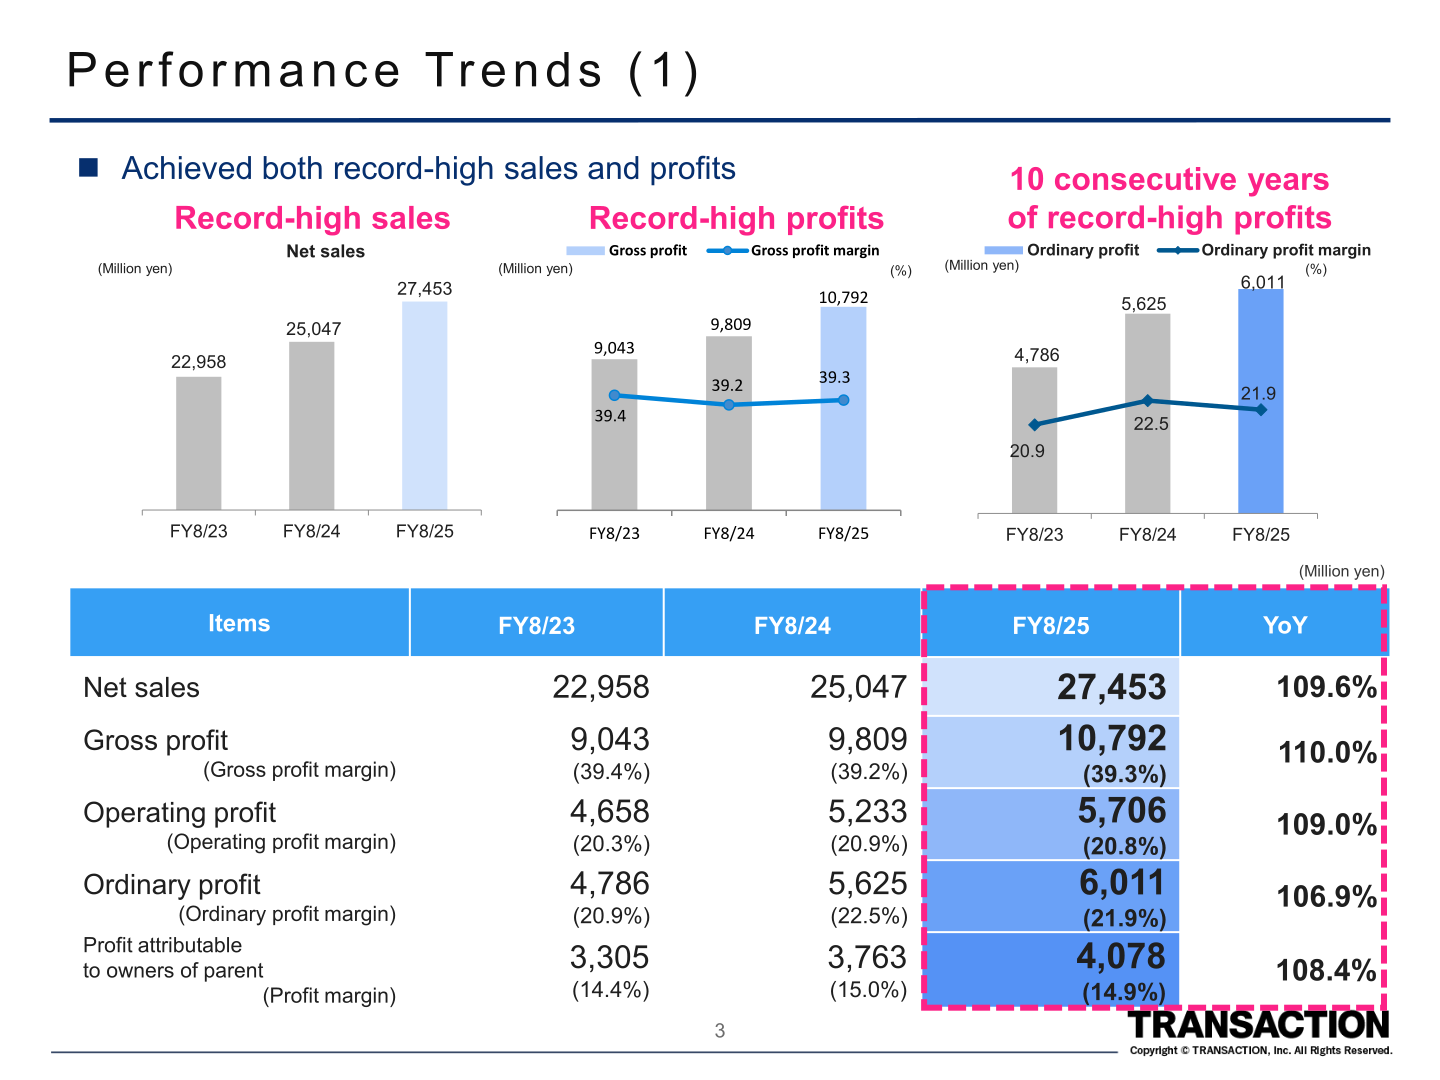
By product classification, lifestyle products remained the largest category, with net sales rising to 14,273 million yen (110.5% of the previous year) on growing “oshikatsu” (fan-support activity) demand and inbound tourism demand, although some entertainment-industry projects were pushed back from the second quarter to the third quarter or later. Wellness products grew fastest, up to 1,630 million yen (127.0%) on higher sales of cosmetic accessories in addition to healthcare products such as masks. Eco-products rose to 11,189 million yen (106.5%), with demand remaining stable but growth falling below expectations due to delays in the arrival of some new products in the fourth quarter. E-commerce sales, which cut across product categories, rose to 7,777 million yen (139.1% of the previous year), lifting e-commerce’s share of consolidated net sales to 28.3% in FY8/25 from 22.3% in FY8/24, and to 31.5% in the fourth quarter alone.
| Product Classification | FY8/23 | FY8/24 | FY8/25 | YoY |
|---|---|---|---|---|
| Eco-products | 10,189 | 10,503 | 11,189 | 106.5% |
| Lifestyle products | 11,205 | 12,915 | 14,273 | 110.5% |
| Wellness products | 1,247 | 1,283 | 1,630 | 127.0% |
| Design and other | 316 | 344 | 359 | 104.5% |
| Total | 22,958 | 25,047 | 27,453 | 109.6% |
FY2026 Forecast
For FY8/26 (the fiscal year ending August 31, 2026), the first year of the 5th Medium-term Management Plan, TRANSACTION forecasts net sales of 29,500 million yen (107.5% of FY8/25), operating profit of 6,100 million yen (106.9%), ordinary profit of 6,300 million yen (104.8%), and profit attributable to owners of parent of 4,120 million yen (101.0%), with upfront investment in human capital and growth businesses to accelerate the growth rate. The company plans to achieve the FY8/26 targets through four key strategies: two business expansions (the e-commerce business and the entertainment (IP) business), four product enhancements (eco-products, climate-change countermeasures and disaster-prevention products, travel-related finished goods, and pet wear and related finished goods), acquisition of trend demand, and factory enhancement through its in-house factories.
| Item | FY8/25 (Results) | FY8/26 (Plan) | YoY |
|---|---|---|---|
| Net sales | 27,453 | 29,500 | 107.5% |
| Gross profit (margin) | 10,792 (39.3%) | 11,760 (39.9%) | 109.0% |
| SG&A expenses | 5,086 | 5,660 | 111.3% |
| Operating profit (margin) | 5,706 (20.8%) | 6,100 (20.7%) | 106.9% |
| Ordinary profit (margin) | 6,011 (21.9%) | 6,300 (21.4%) | 104.8% |
| Profit attributable to owners of parent (margin) | 4,078 (14.9%) | 4,120 (14.0%) | 101.0% |
Shareholder Returns
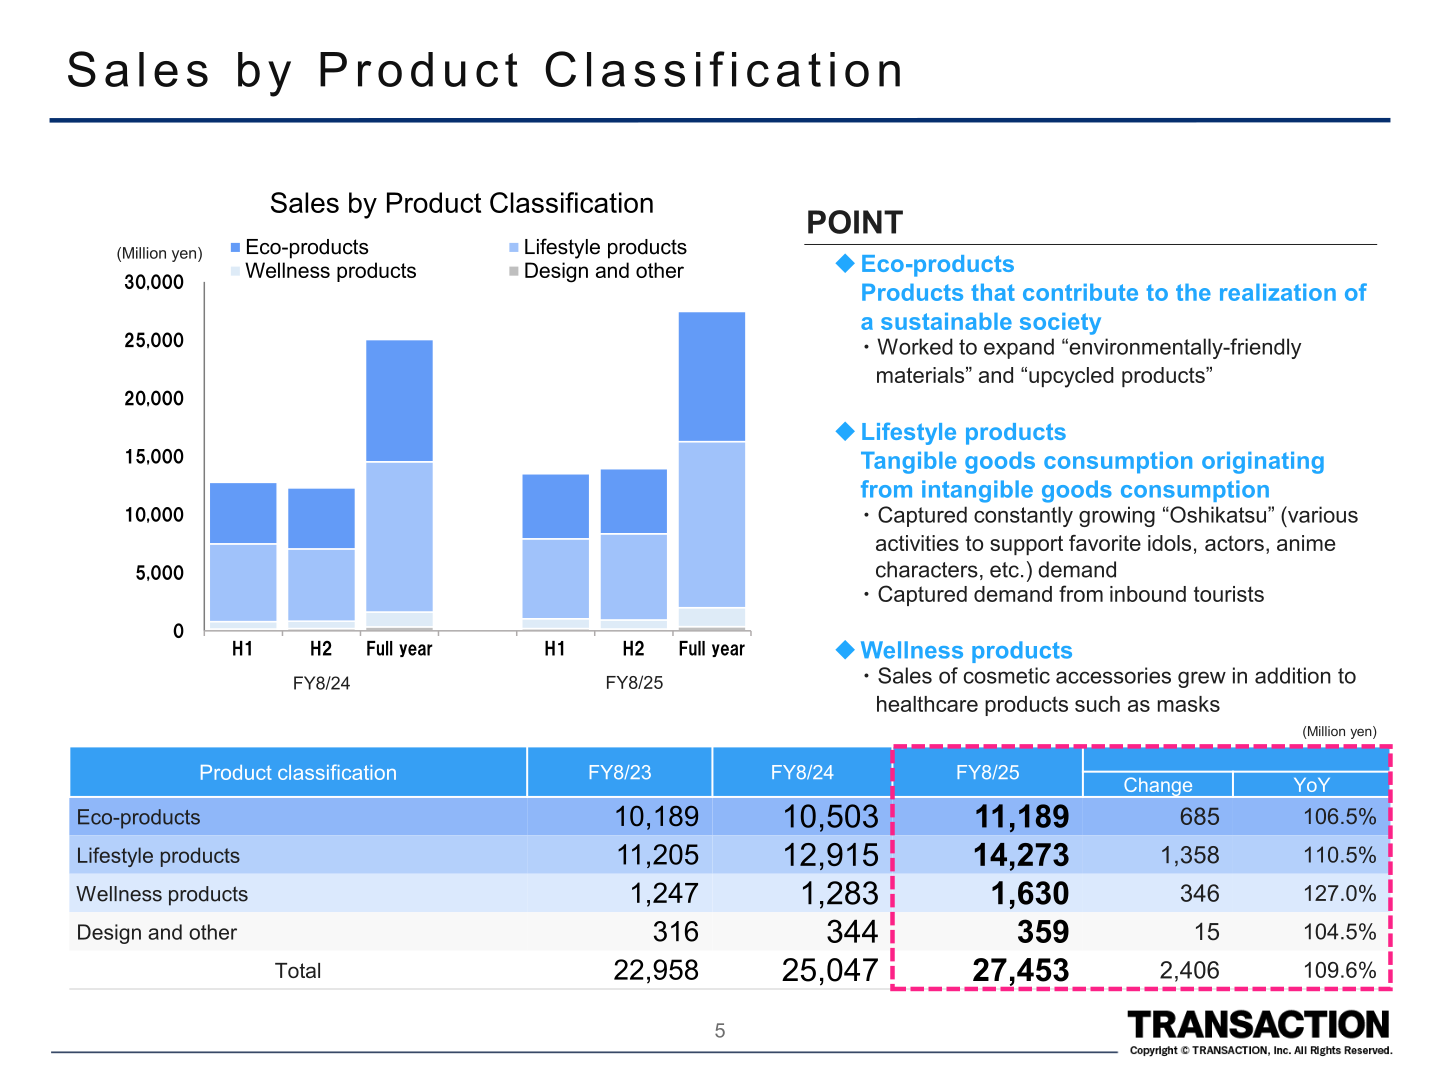
TRANSACTION’s basic policy is to continuously implement appropriate profit distribution in line with sustainable performance and corporate value improvement as well as its financial position, and, in consideration of future business expansion and financial soundness, the company has decided to raise the dividend payout ratio to around 40% through an appropriate balance of growth investment and profit distribution. The FY8/25 dividend was 28.5 yen per share (after the August 31, 2025 stock split), an increase of 9 yen from 19.5 yen in FY8/24 (146% of the previous year), and the company forecasts a further dividend increase for FY8/26, which would mark 14 consecutive years of dividend increases since listing. TRANSACTION also implemented share buybacks for two consecutive years: it purchased 289,100 shares for a total of 499 million yen in FY8/24 (before the stock split), and purchased 600,000 shares for a total of 1,486 million yen on July 24, 2025, before canceling those 600,000 repurchased shares on August 5, 2025.
5th Medium-Term Management Plan
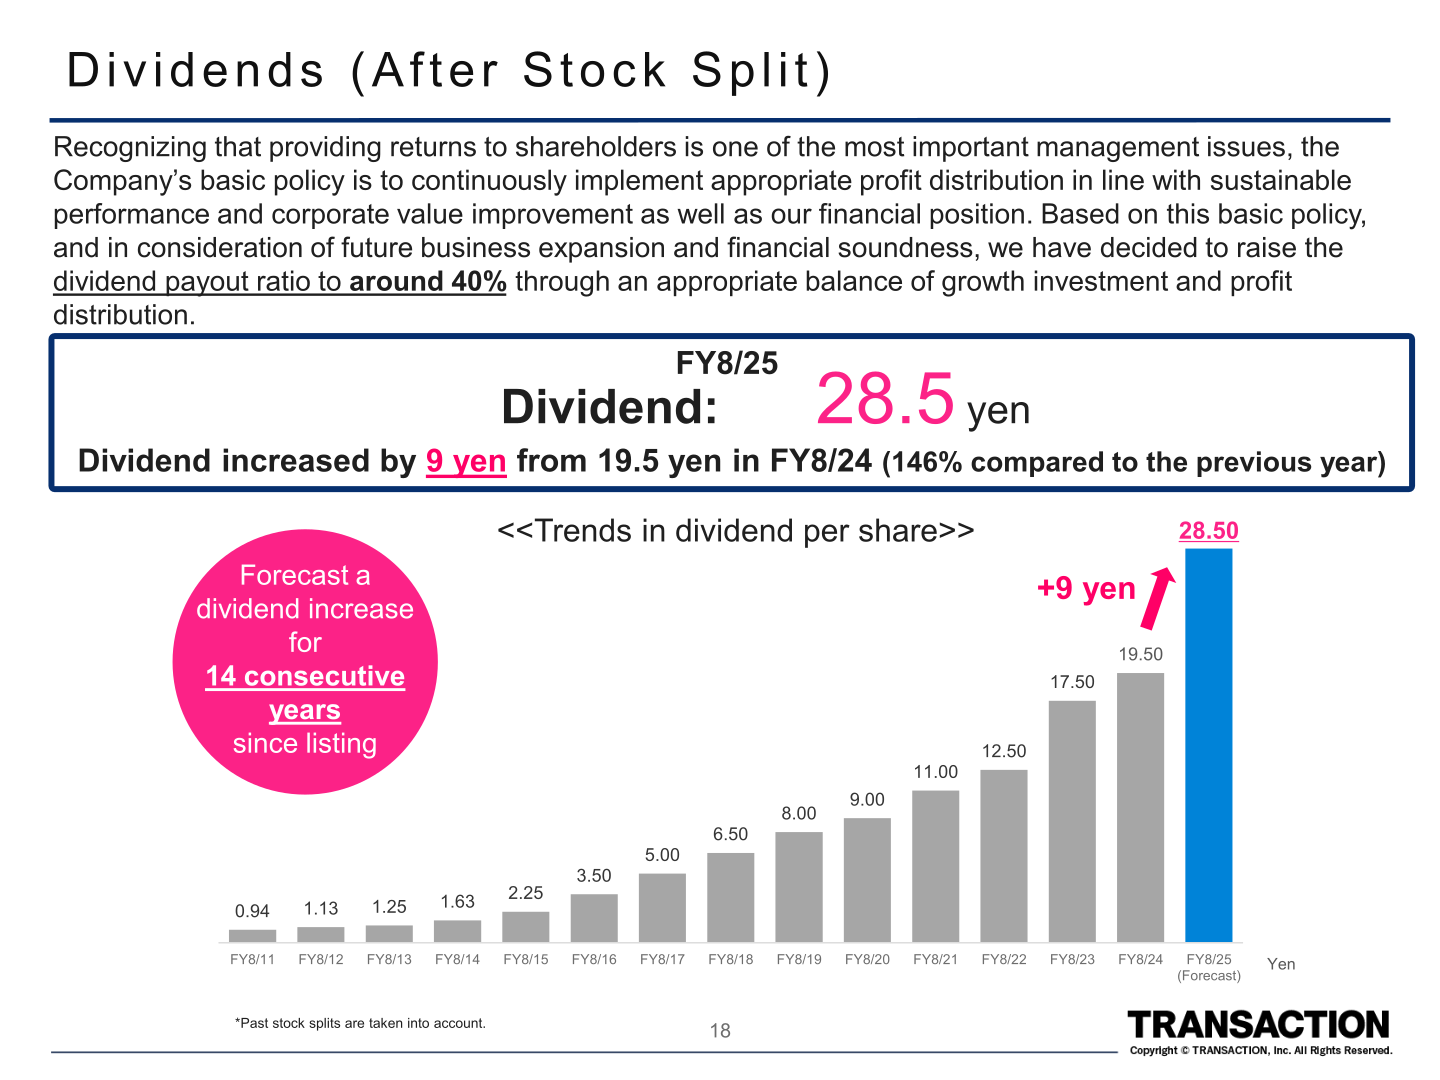
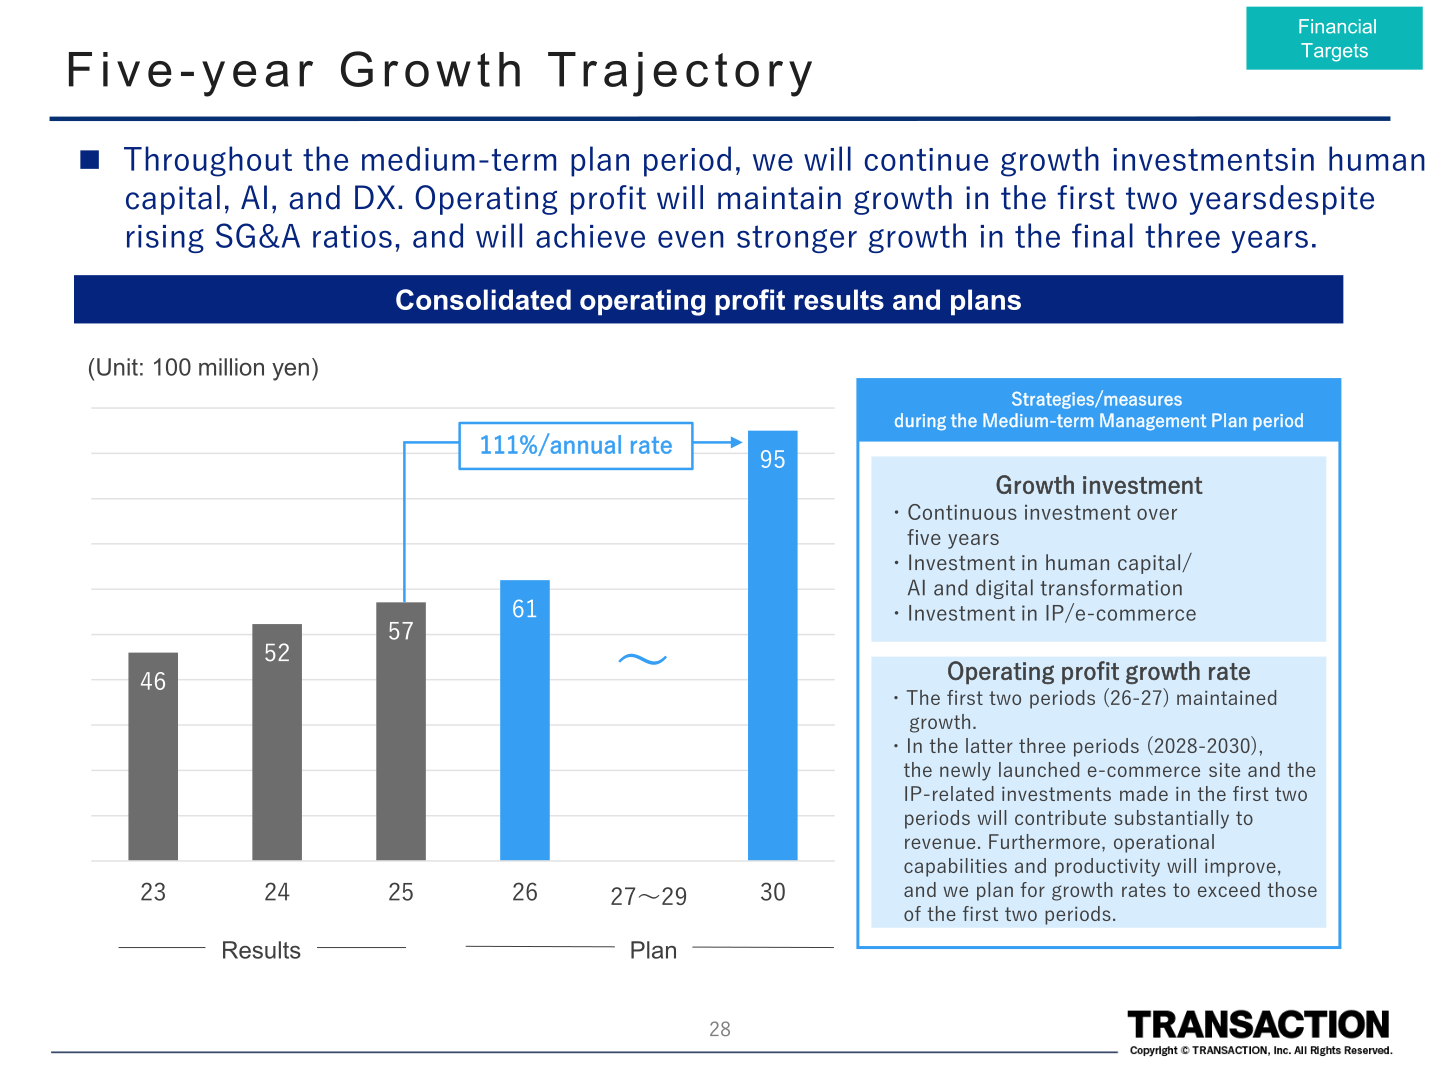
TRANSACTION launched its 5th Medium-term Management Plan covering FY8/26 to FY8/30, targeting consolidated net sales of 45 billion yen and operating profit of 9.5 billion yen (an average annual growth rate of over 10%) in the final year, FY8/30, along with ROE of about 20%. The plan includes 4.0 billion yen in M&A investment to strengthen functions in manufacturing, logistics, e-commerce, and entertainment (IP) businesses, though M&A effects are not reflected in the plan’s numerical targets; if M&A funds are not fully utilized, the company will flexibly consider strengthening shareholder returns instead. From an estimated 18.0 billion yen in available funds (operating cash flow of 25.0 billion yen minus incremental working capital and crisis response funds of approximately 7.0 billion yen), the company plans to allocate 8.0 billion yen to growth investment and 10.0 billion yen to shareholder returns over the plan period. Under the plan, TRANSACTION targets a dividend payout ratio of 40% or more (with a DOE lower limit of 7.0%) and continued dividend increases, and aims for total shareholder return (TSR) of 12% per year combined with double-digit EPS growth.
| Item | FY8/25 (Results) | FY8/26 (1st year, Plan) | FY8/30 (5th year, Plan) |
|---|---|---|---|
| Net sales (100 million yen) | 274.5 | 295.0 | 450.0 |
| Operating profit (100 million yen) | 57.0 | 61.0 | 95.0 |
| Ordinary profit (100 million yen) | 60.1 | 63.0 | 97.0 |
| Profit (100 million yen) | 40.7 | 41.2 | 63.4 |
| EPS | 70.9 yen | 73.0 yen | 112.3 yen |
| Dividend per share (after split; before split in parentheses) | 28.5 yen (57 yen) | 30 yen (15 consecutive years of dividend increases) | 45 yen (19 consecutive years of dividend increases) |
| Dividend payout ratio | 40.2% | 40% or higher | 40% or higher |
| ROE (return on equity) | 21.6% | About 20% | About 20% |
| DOE (dividend on equity) | 8.6% | 7.0% or higher | 7.0% or higher |
This article is an analysis based on publicly available information and is not a recommendation to buy or sell any specific securities. Investment decisions are your own responsibility.
















