
This article is based on publicly available IR materials and is not a recommendation to buy or sell any specific securities.
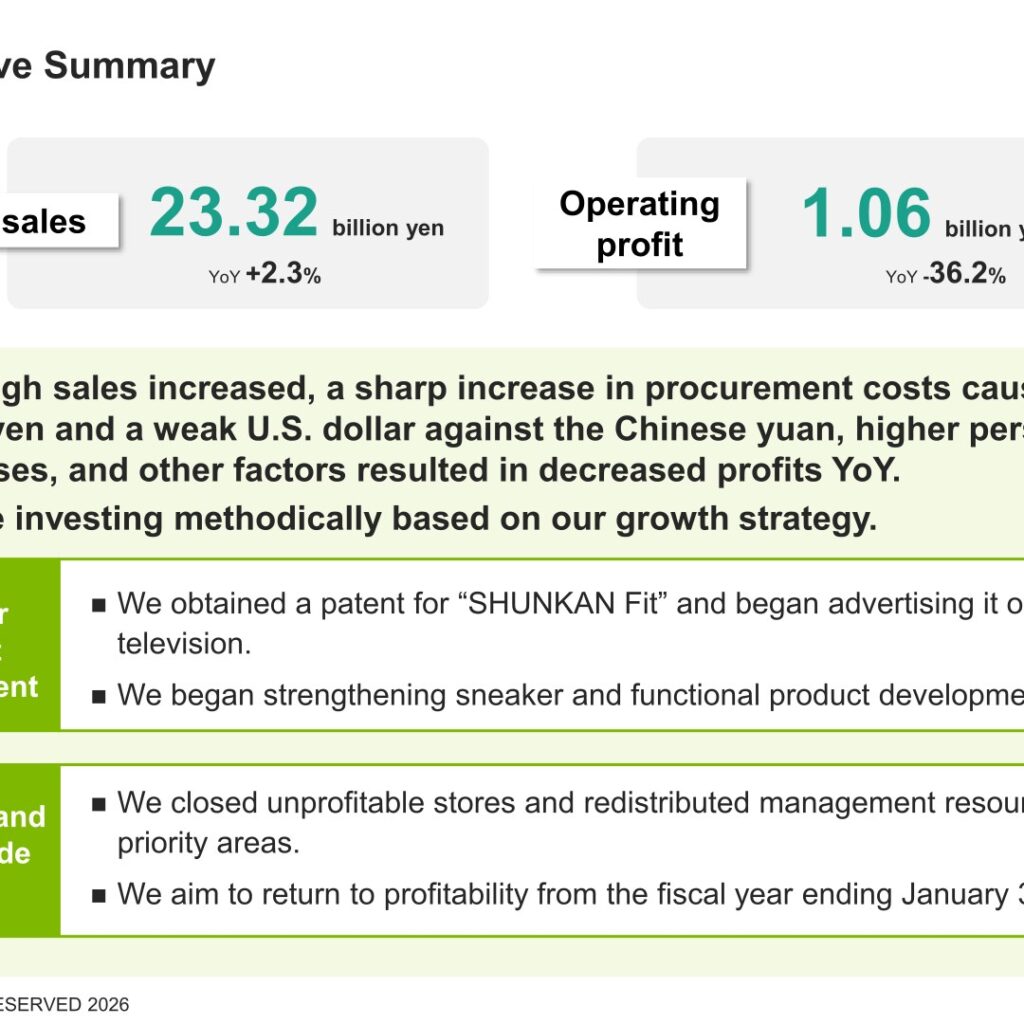
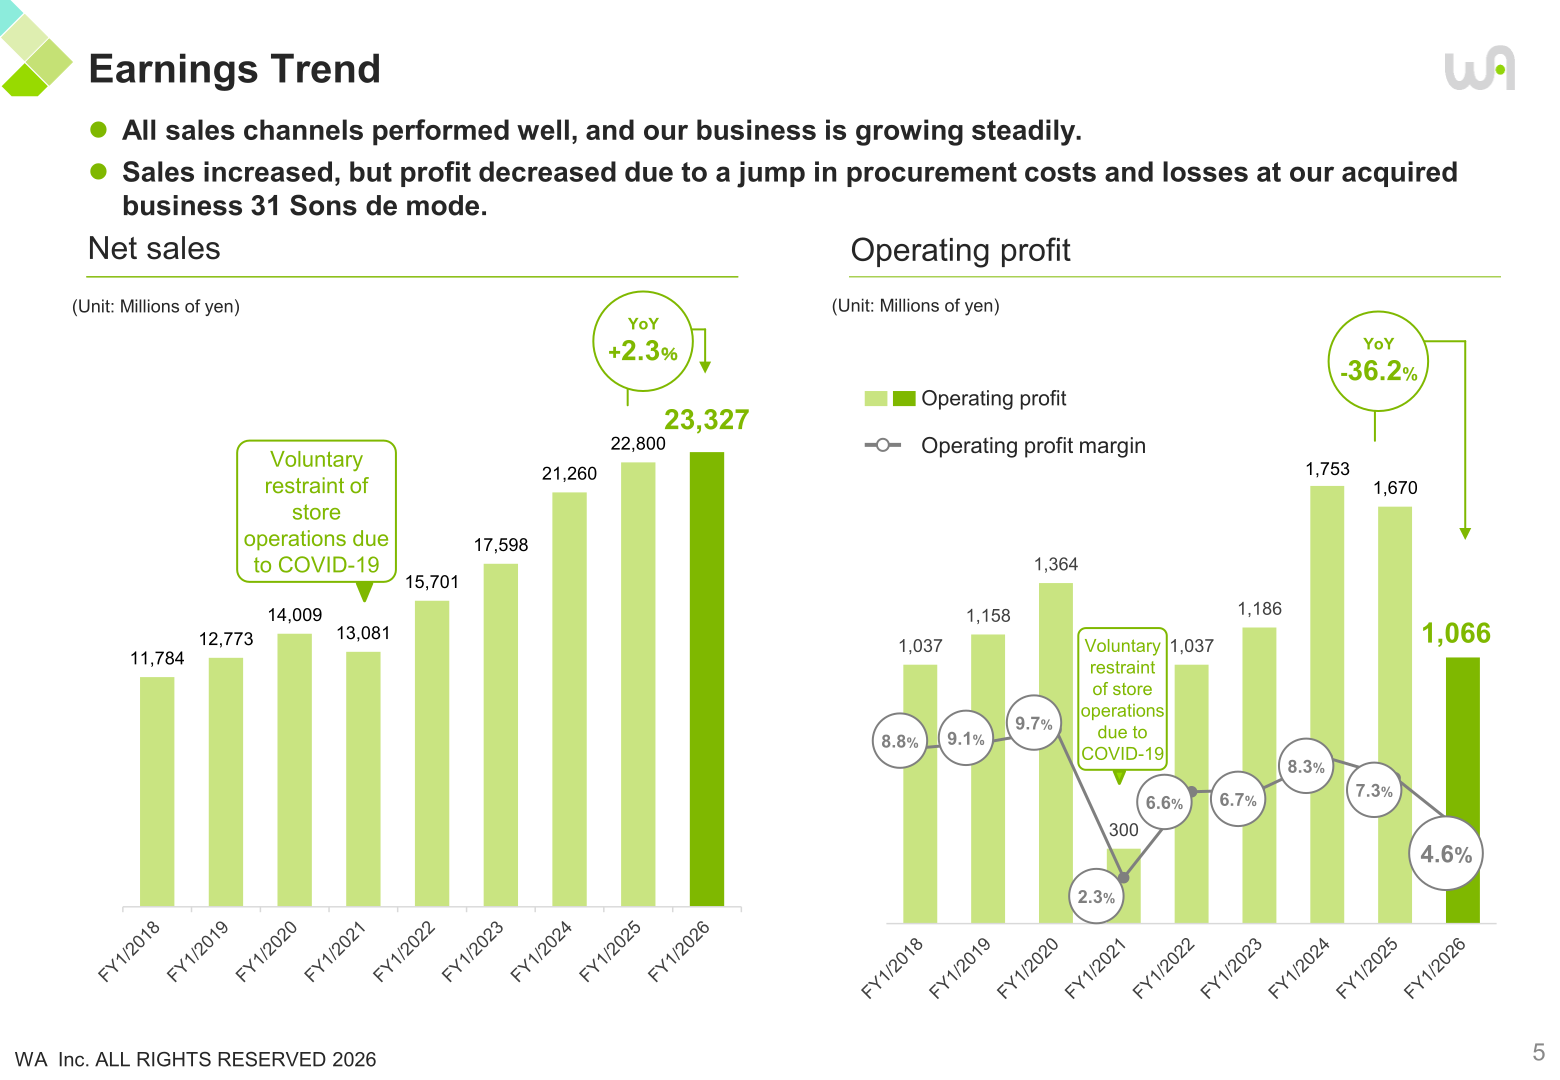
WA Inc. (Tokyo Stock Exchange Prime Market, securities code 7683) reported consolidated net sales of 23,327 million yen for the fiscal year ended January 31, 2026, a record high and up 2.3% year on year, while operating profit fell 36.2% to 1,066 million yen. Note: WA Inc.’s fiscal year runs from February to January; the company labels the year ended January 31, 2026 as “FY1/2026” and the prior year as “FY1/2025,” and the text and tables below follow the company’s own labels. The company attributes the profit decline to a sharp increase in procurement costs caused by a weak yen and a weak U.S. dollar against the Chinese yuan, as well as higher personnel expenses, even as sales grew across its business.
Consolidated Results (Full-Year Actual)
Although net sales reached a record high, full-year results fell short of the company’s revised forecast as market conditions in Hong Kong deteriorated. Profit decreased due to the sharp increase in procurement costs, higher personnel expenses, and costs associated with store consolidation and closures. Figures below are in millions of yen unless otherwise noted.
| Item | FY1/2025 | FY1/2026 | YoY Change (Amount) | YoY Change (Rate) | (Reference) FY1/2026 Full-Year Forecast (After Revision) |
|---|---|---|---|---|---|
| Net sales | 22,800 | 23,327 | +526 | +2.3% | 23,901 |
| Cost of sales | 8,779 | 9,142 | +362 | +4.1% | — |
| Gross profit | 14,021 | 14,185 | +164 | +1.2% | — |
| Selling, general and administrative expenses | 12,350 | 13,118 | +768 | +6.2% | — |
| Operating profit | 1,670 | 1,066 | (604) | (36.2%) | 1,286 |
| Ordinary profit | 1,587 | 1,187 | (400) | (25.2%) | 1,424 |
| Net profit | 996 | 688 | (308) | (31.0%) | 832 |
| Net profit per share (yen) | 52.28 | 36.07 | – | – | 43.63 |
Segment Results
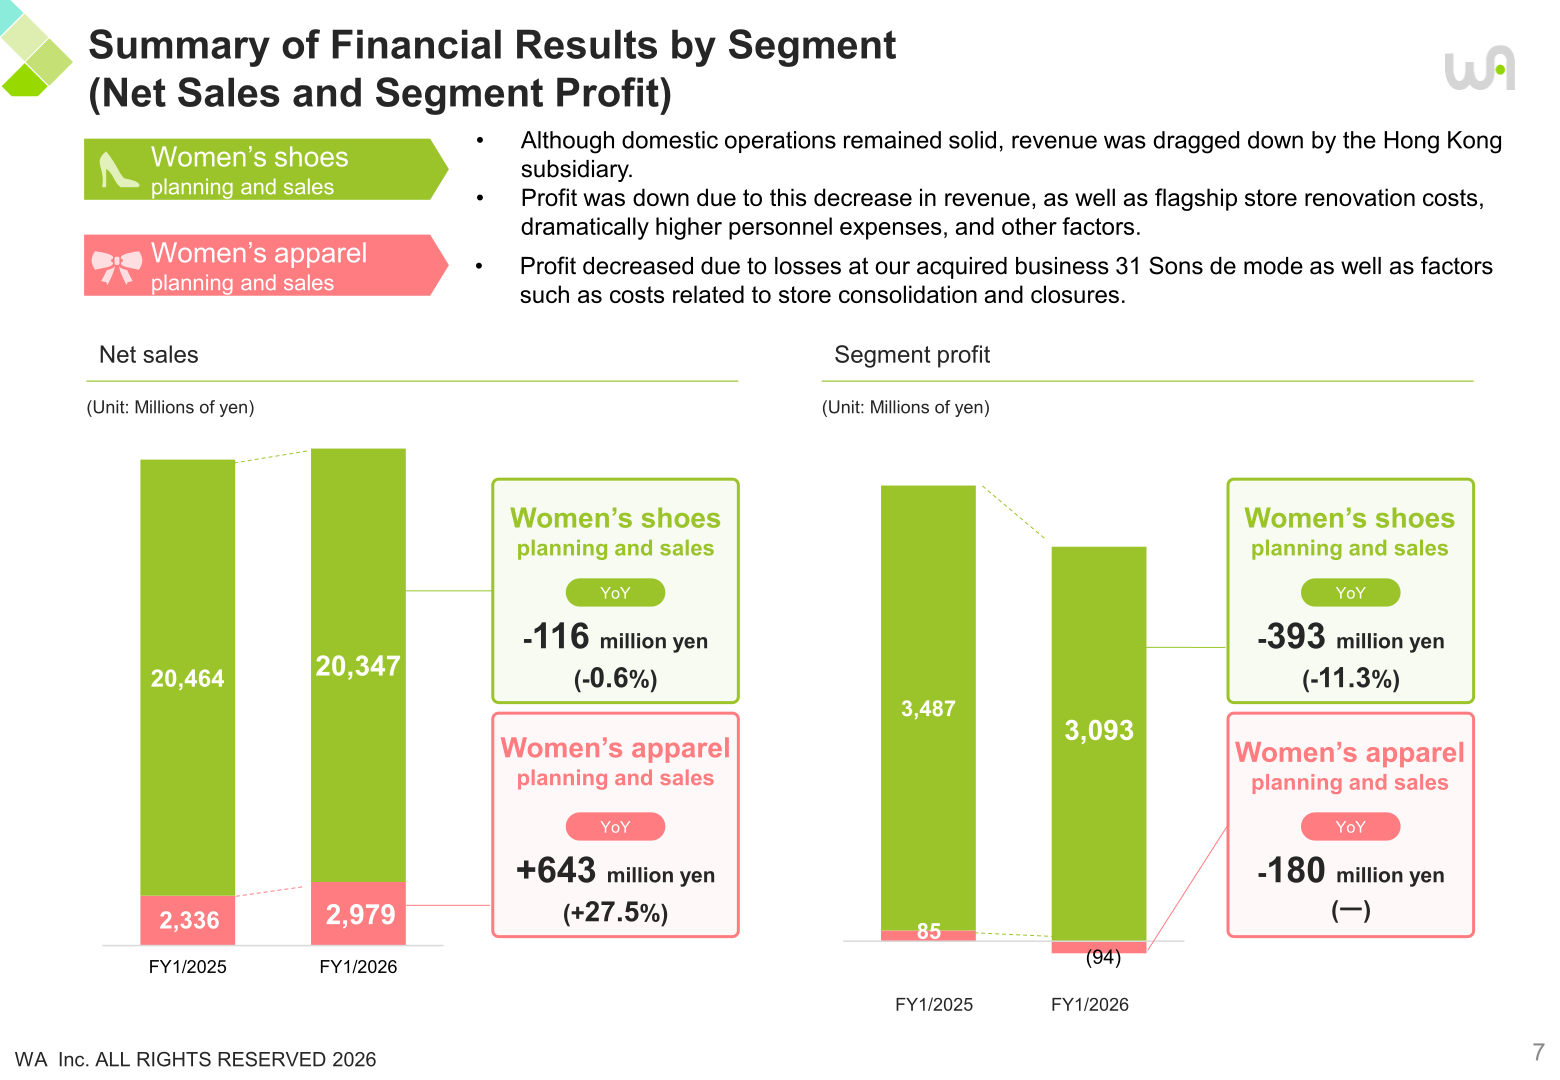
By reporting segment, net sales in the women’s shoes planning and sales segment were 20,347 million yen, down 116 million yen (-0.6%) year on year, while segment profit fell 393 million yen (-11.3%) to 3,093 million yen; the company attributes this to a decline in revenue at the Hong Kong subsidiary, flagship store renovation costs, and dramatically higher personnel expenses. The women’s apparel planning and sales segment posted net sales of 2,979 million yen, up 643 million yen (+27.5%), but recorded a segment loss of 94 million yen, a 180 million yen year-on-year decline, due to losses at the acquired business 31 Sons de mode and costs related to store consolidation and closures.
| Segment | Metric | FY1/2025 | FY1/2026 |
|---|---|---|---|
| Women’s shoes planning and sales | Net sales (¥M) | 20,464 | 20,347 |
| Women’s shoes planning and sales | Segment profit (¥M) | 3,487 | 3,093 |
| Women’s apparel planning and sales | Net sales (¥M) | 2,336 | 2,979 |
| Women’s apparel planning and sales | Segment profit/(loss) (¥M) | 85 | (94) |
Company and Sales Channel Breakdown
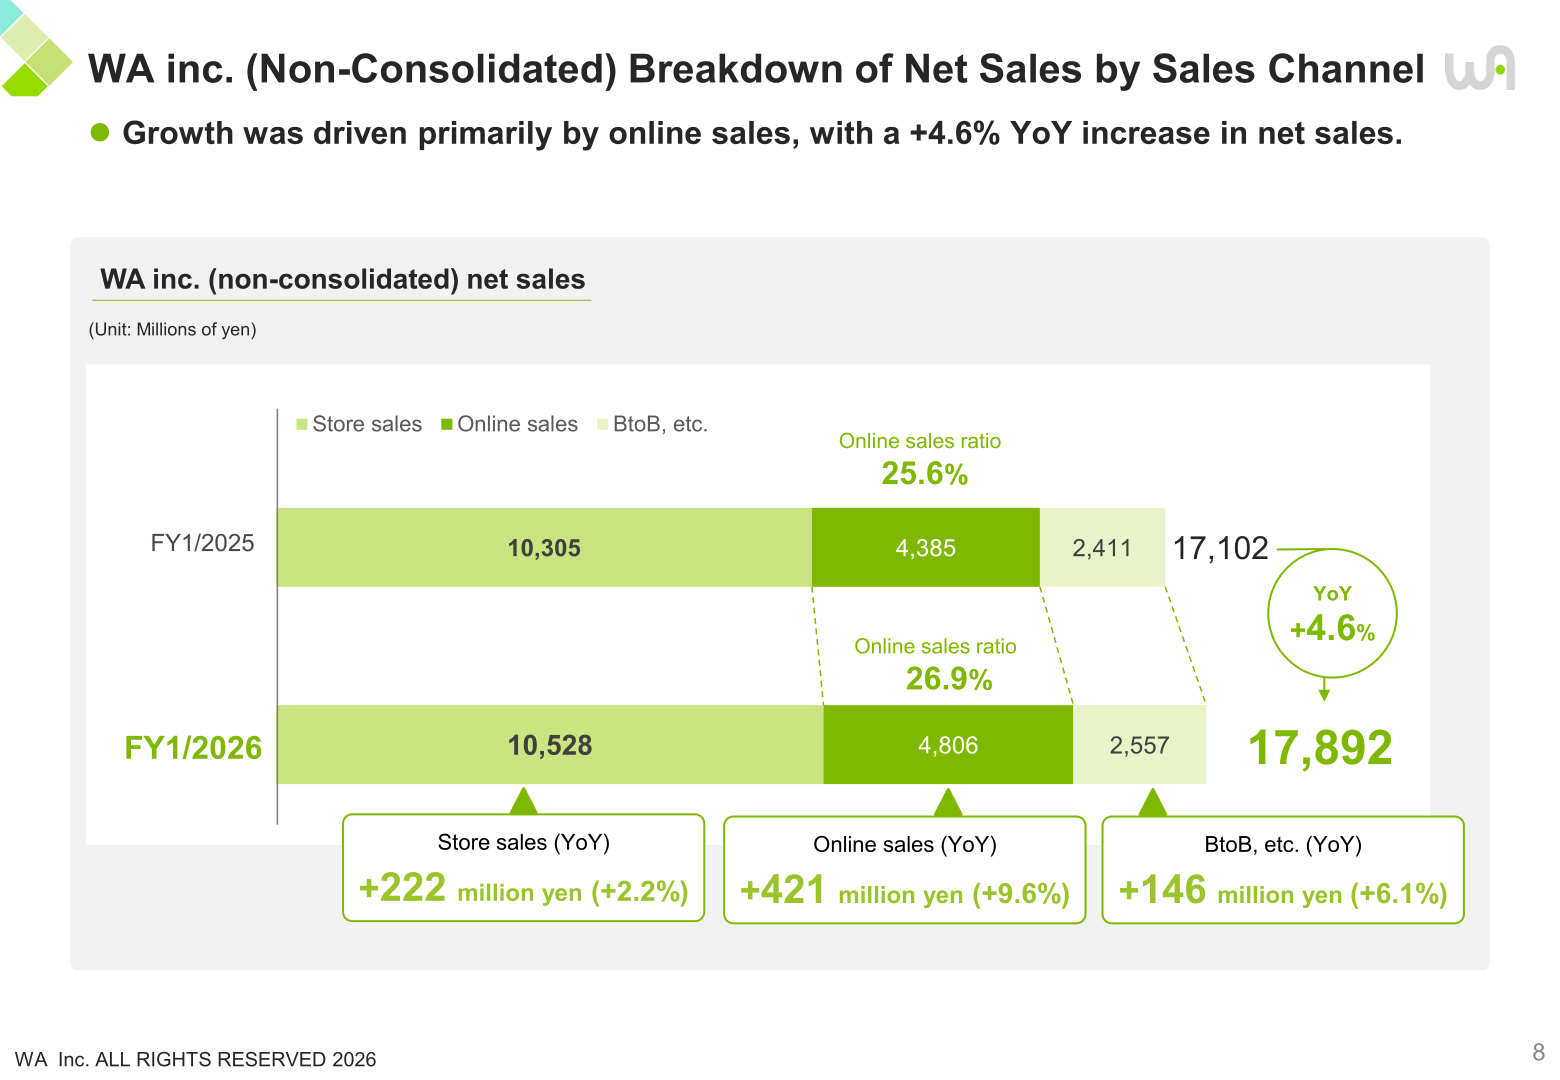
By operating company, WA inc. (non-consolidated) net sales rose 4.6% year on year (+790 million yen), but operating profit fell 38.2% (-480 million yen) on store renovation expenses and costs related to store consolidation and closures. Himiko Co., Ltd. net sales rose 10.2% (+510 million yen) to 5,553 million yen, while its ordinary profit fell 9.8% to 407 million yen, driven by higher personnel expenses and a sharp increase in raw materials expenses. Within WA inc. (non-consolidated), growth was led by online sales, which rose 9.6% (+421 million yen) to 4,806 million yen, lifting the online sales ratio to 26.9% from 25.6%; store sales rose 2.2% (+222 million yen) to 10,528 million yen and BtoB and other sales rose 6.1% (+146 million yen) to 2,557 million yen, for total WA inc. (non-consolidated) net sales of 17,892 million yen versus 17,102 million yen a year earlier.
Store Network
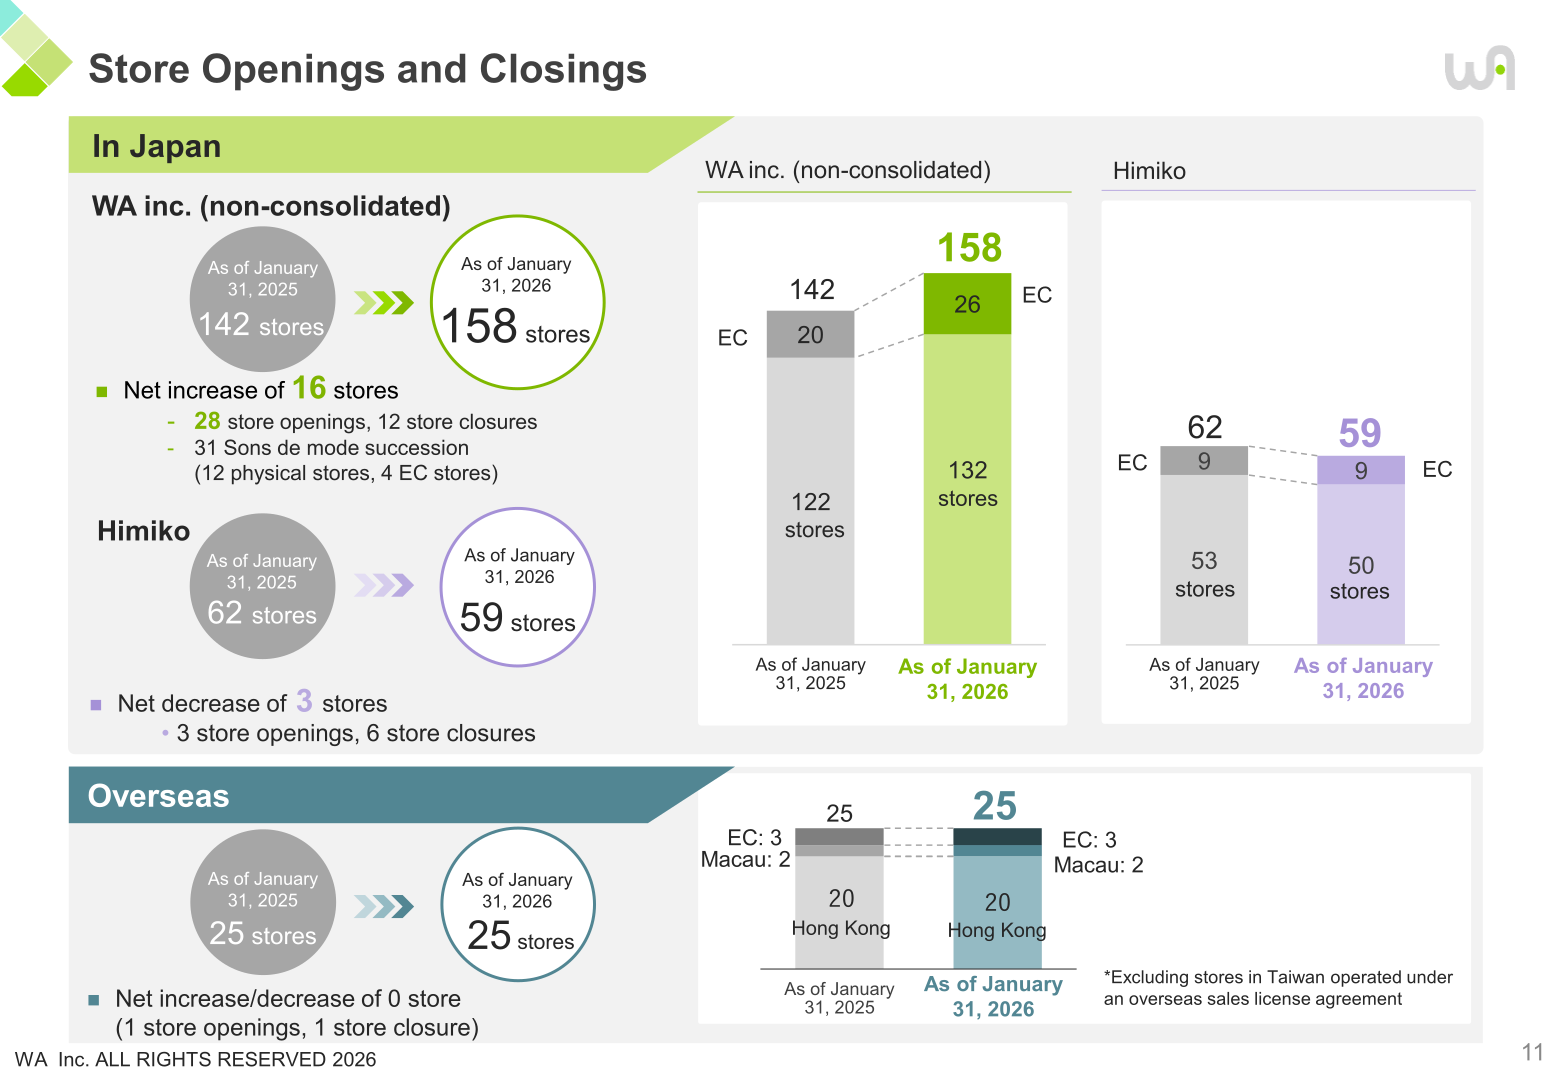
In Japan, WA inc. (non-consolidated) store count rose to a net 158 stores as of January 31, 2026, a net increase of 16 stores (28 store openings, 12 store closures, and the succession of 12 physical stores and 4 EC stores from 31 Sons de mode). Himiko’s store count fell to 59 stores, a net decrease of 3 stores (3 store openings, 6 store closures). Overseas, the store count in Hong Kong and Macau was unchanged at 25 stores (1 store opening, 1 store closure).
FY2026 Forecast
The presentation materials do not include numerical guidance for the fiscal year ending January 31, 2027 (the company’s FY1/2027). This cannot be confirmed from the materials. The company states that it aims to return to profitability from the fiscal year ending January 31, 2027, citing initiatives including obtaining a patent for “SHUNKAN Fit” and beginning to advertise it on television, strengthening sneaker and functional product development, and closing unprofitable stores to redistribute management resources to priority areas.
Shareholder Returns
The presentation materials do not contain a dividend or shareholder return policy. This cannot be confirmed from the materials.
Financial Position
Total assets increased by 322 million yen to 13,457 million yen as of January 31, 2026, driven mainly by growth in inventories and investments and other assets. Total liabilities rose by 8 million yen to 2,393 million yen, and total net assets rose by 314 million yen to 11,063 million yen. The equity ratio improved to 82.2% from 81.8%.
| Item | As of January 31, 2025 | As of January 31, 2026 | Change |
|---|---|---|---|
| Current assets | 10,001 | 9,951 | (50) |
| Cash and deposits | 2,895 | 2,623 | (272) |
| Notes and accounts receivable – trade | 2,002 | 1,969 | (33) |
| Inventories | 4,582 | 4,994 | +411 |
| Non-current assets | 3,133 | 3,506 | +372 |
| Total assets | 13,134 | 13,457 | +322 |
| Total liabilities | 2,385 | 2,393 | +8 |
| Total net assets | 10,749 | 11,063 | +314 |
| Equity ratio | 81.8% | 82.2% | +0.4 percentage points |
This article is an analysis based on publicly available information and is not a recommendation to buy or sell any specific securities. Investment decisions are your own responsibility.
















