
This article is based on publicly available IR materials and is not a recommendation to buy or sell any specific securities.
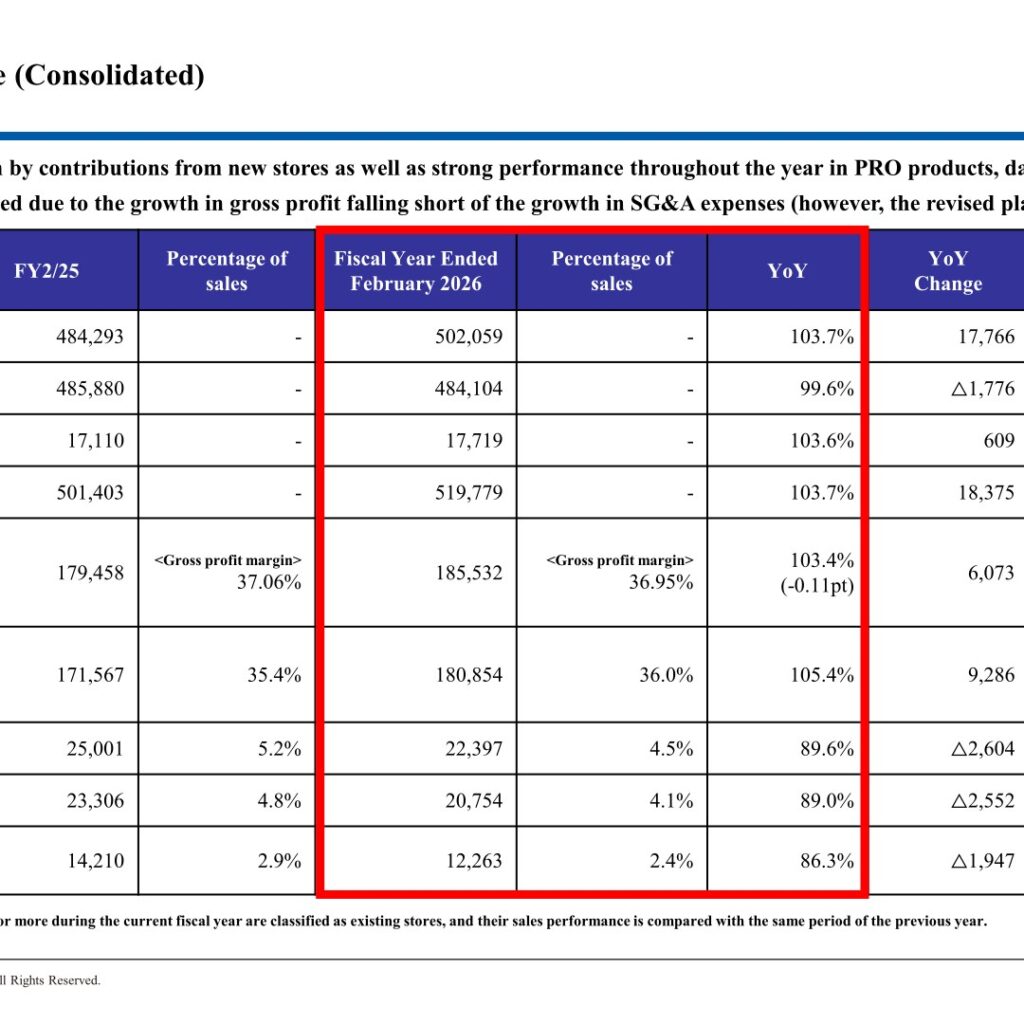
Note: KOHNAN SHOJI Co., Ltd. closes its books at the end of February, and the presentation labels the period under review “Fiscal Year Ended February 2026” (FY2/26); it is classified as FY2025 under this site’s convention, and all labels below follow the presentation. For the fiscal year ended February 2026 (March 1, 2025 – February 28, 2026), the home center operator reported consolidated Operating Revenues of 519,779 million yen, or 103.7% of the prior year, while Operating Income fell to 22,397 million yen (89.6% year on year) and Net Income to 12,263 million yen (86.3%). The presentation states that net sales increased, driven by contributions from new stores as well as strong performance throughout the year in PRO products, daily consumables and food items, but that profits at each level declined due to the growth in gross profit falling short of the growth in SG&A expenses — although the revised plan targets were achieved. For the fiscal year ending February 2027 (FY2/27), the company forecasts Operating Revenues of 543,500 million yen and Net Income of 12,500 million yen.
Consolidated Results (Fiscal Year Ended February 2026)
Gross profit rose to 185,532 million yen (103.4%), but the gross profit margin slipped to 36.95% from 37.06%, a change of -0.11pt. Selling, general and administrative expenses increased 105.4% to 180,854 million yen, an increase of 9,286 million yen, which the company identifies as the reason operating income declined by 2,604 million yen. Against the revised plan, results came in at 105.4% for Operating Income and 102.2% for Net Income; against the original plan they were 87.5% and 84.6% respectively.
| Item (Millions of yen) | FY2/25 | Fiscal Year Ended February 2026 | YoY | YoY Change |
|---|---|---|---|---|
| Operating revenues | 484,293 | 502,059 | 103.7% | 17,766 |
| Same-store sales | 485,880 | 484,104 | 99.6% | △1,776 |
| Operating income | 17,110 | 17,719 | 103.6% | 609 |
| Operating Revenues | 501,403 | 519,779 | 103.7% | 18,375 |
| Gross profit | 179,458 | 185,532 | 103.4% | 6,073 |
| Gross profit margin | 37.06% | 36.95% | -0.11pt | – |
| Selling, general and administrative expenses | 171,567 | 180,854 | 105.4% | 9,286 |
| Operating Income | 25,001 | 22,397 | 89.6% | △2,604 |
| Ordinary Income | 23,306 | 20,754 | 89.0% | △2,552 |
| Profit attributable to owners of parent (Net Income) | 14,210 | 12,263 | 86.3% | △1,947 |
Within SG&A expenses, personnel expenses were 62,812 million yen (106.6%), rent expenses 55,599 million yen (104.7%), depreciation costs and similar items 17,782 million yen (105.7%) and other SG&A expenses 44,659 million yen (104.5%). Of the last item, utilities expenses were 5,673 million yen (96.7%), commission fees 6,435 million yen (113.0%) and distribution expenses 5,700 million yen (117.7%). The consolidated SG&A ratio moved from 35.4% in the previous period to 36.0% in the current period, a year-on-year increase of 0.6 pt, and total SG&A expenses came in at 99.9% of plan.
Performance by Business Format
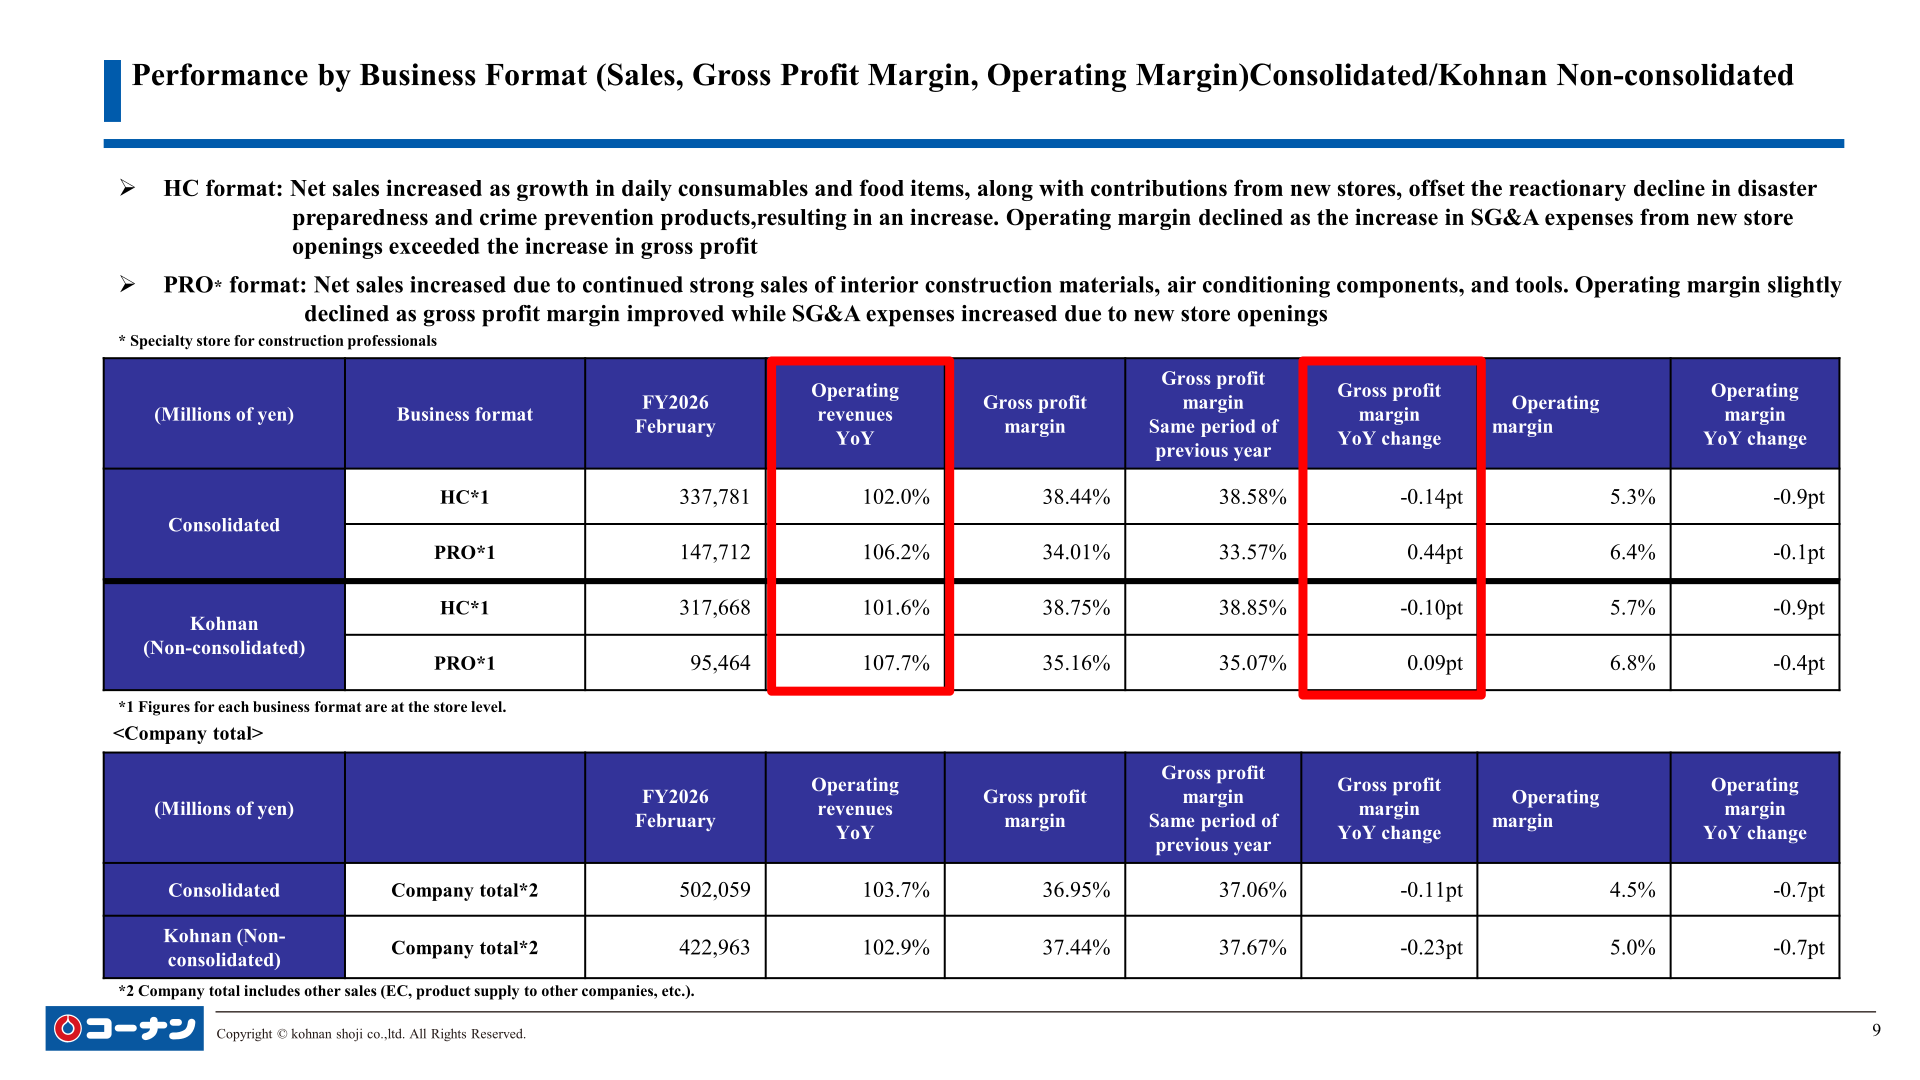
For the HC (home center) format, the company states that net sales increased as growth in daily consumables and food items, along with contributions from new stores, offset the reactionary decline in disaster preparedness and crime prevention products, while the operating margin declined as the increase in SG&A expenses from new store openings exceeded the increase in gross profit. For the PRO format — a specialty store format for construction professionals — net sales increased due to continued strong sales of interior construction materials, air conditioning components and tools, with the operating margin slightly declining as gross profit margin improved while SG&A expenses increased due to new store openings.
| (Millions of yen) | Business format | FY2026 February | Operating revenues YoY | Gross profit margin | Gross profit margin (same period of previous year) | Operating margin | Operating margin YoY change |
|---|---|---|---|---|---|---|---|
| Consolidated | HC | 337,781 | 102.0% | 38.44% | 38.58% | 5.3% | -0.9pt |
| Consolidated | PRO | 147,712 | 106.2% | 34.01% | 33.57% | 6.4% | -0.1pt |
| Kohnan (Non-consolidated) | HC | 317,668 | 101.6% | 38.75% | 38.85% | 5.7% | -0.9pt |
| Kohnan (Non-consolidated) | PRO | 95,464 | 107.7% | 35.16% | 35.07% | 6.8% | -0.4pt |
| Consolidated | Company total | 502,059 | 103.7% | 36.95% | 37.06% | 4.5% | -0.7pt |
| Kohnan (Non-consolidated) | Company total | 422,963 | 102.9% | 37.44% | 37.67% | 5.0% | -0.7pt |
On a same-store basis, cumulative consolidated net sales for the period were -0.4% year on year, against an industry average of -1.7% (the average of same-store sales at nine listed home center companies), with customer traffic at -1.7% and the average purchase amount at +1.3%. By business format, same-store sales were -1.2% for HC and +1.2% for PRO. The company attributes the decline mainly to the reactionary decline from the previous year’s special demand for disaster preparedness and crime prevention products from August to November, as well as struggles in selling seasonal merchandise outside of summer.
By product category on a consolidated basis, Home Improvement (DIY products, PRO products, gardening, renovation) recorded 240,177 million yen (103.5%, 47.8% of sales), Housekeeping 158,928 million yen (104.2%, 31.7%), Pet & Leisure 70,254 million yen (100.4%, 14.0%), Food 16,693 million yen (117.4%, 3.3%) and Other (100-yen shop, kerosene, vending machines) 16,006 million yen (103.7%, 3.2%), for a total of 502,059 million yen (103.7%). Among subsidiaries, Ken Depot posted 52,247 million yen (103.4%), HOME IMPROVEMENT HIROSE 24,273 million yen in total (103.3%) and KOHNAN VIETNAM 4,358 million yen (105.5%); HC Mitsuwa (1,219 million yen) and I’nT Holdings (1,874 million yen) recorded sales from this fiscal year, for four months and three months respectively.
Financial Position and Cash Flow
Total assets stood at 504,793 million yen, an increase of 25,786 million yen, with merchandise and finished products rising 13,981 million yen to 145,955 million yen on inventory increases from new stores. Total equity was 173,849 million yen, up 8,056 million yen, and the equity ratio was 34.4%. The D/E ratio (interest-bearing debt divided by net assets) was 1.26x, against 1.25x at the previous fiscal year-end, with interest-bearing debt increasing due to new store openings and associated inventory increases as well as M&A. Cash flow from operating activities was 22,990 million yen (versus 22,441 million yen), cash flow from investing activities was △20,650 million yen (versus △21,723 million yen) and cash flow from financing activities was 1,460 million yen (versus △1,433 million yen), leaving free cash flow of 2,340 million yen and a year-end cash and cash equivalents balance of 13,300 million yen. Capital expenditures for FY2/26 were ¥25.4 billion, exceeding the initial plan by approximately ¥3.0 billion due to additional M&A expenses, and the FY2/27 plan is ¥45.0 billion.
FY2/27 Results Outlook
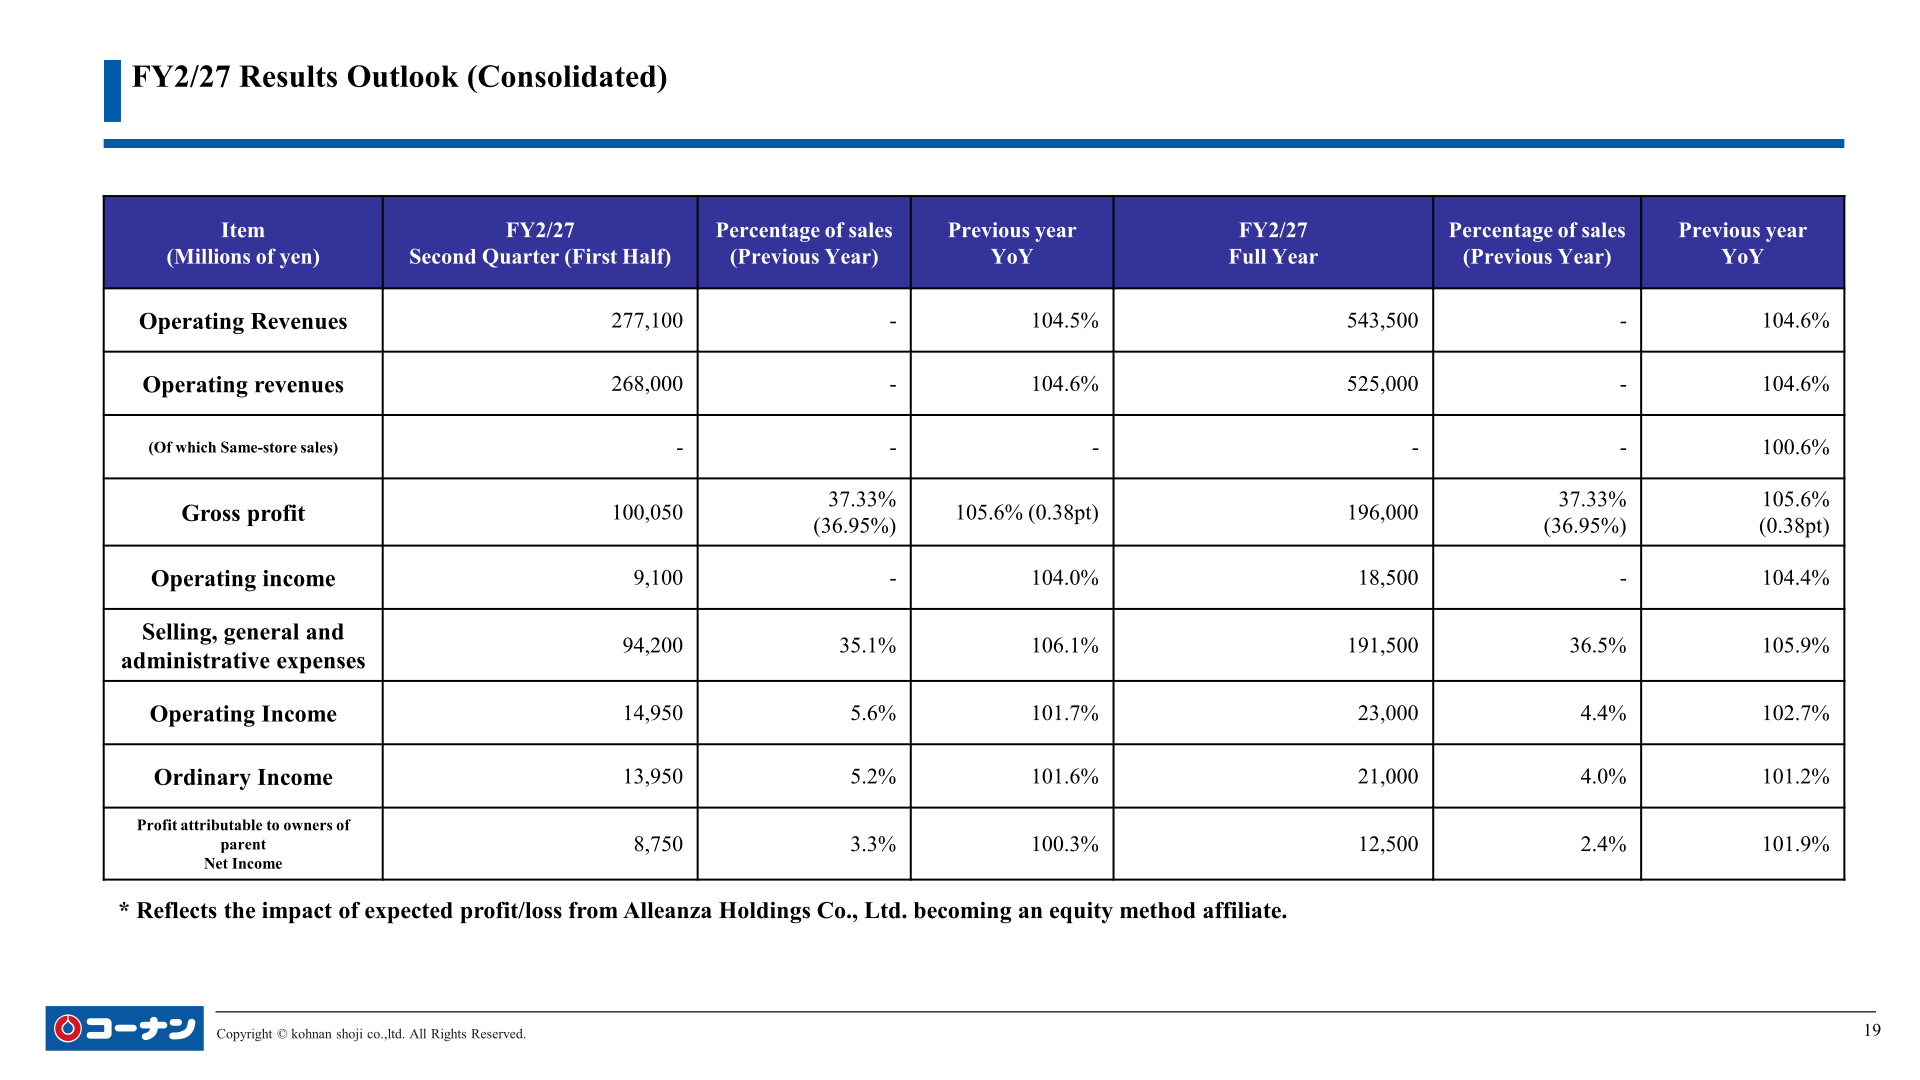
For the fiscal year ending February 2027, the company projects Operating Revenues of 543,500 million yen (104.6%), Operating Income of 23,000 million yen (102.7%), Ordinary Income of 21,000 million yen (101.2%) and Net Income of 12,500 million yen (101.9%). Same-store sales are assumed at 100.6% and the gross profit margin at 37.33%, against 36.95% in the period under review. The presentation notes that the outlook reflects the impact of expected profit and loss from Alleanza Holdings Co., Ltd. becoming an equity method affiliate.
| Item (Millions of yen) | FY2/27 Second Quarter (First Half) | YoY | FY2/27 Full Year | YoY |
|---|---|---|---|---|
| Operating Revenues | 277,100 | 104.5% | 543,500 | 104.6% |
| Operating revenues | 268,000 | 104.6% | 525,000 | 104.6% |
| (Of which Same-store sales) | – | – | – | 100.6% |
| Gross profit | 100,050 | 105.6% | 196,000 | 105.6% |
| Operating income | 9,100 | 104.0% | 18,500 | 104.4% |
| Selling, general and administrative expenses | 94,200 | 106.1% | 191,500 | 105.9% |
| Operating Income | 14,950 | 101.7% | 23,000 | 102.7% |
| Ordinary Income | 13,950 | 101.6% | 21,000 | 101.2% |
| Profit attributable to owners of parent (Net Income) | 8,750 | 100.3% | 12,500 | 101.9% |
Shareholder Returns
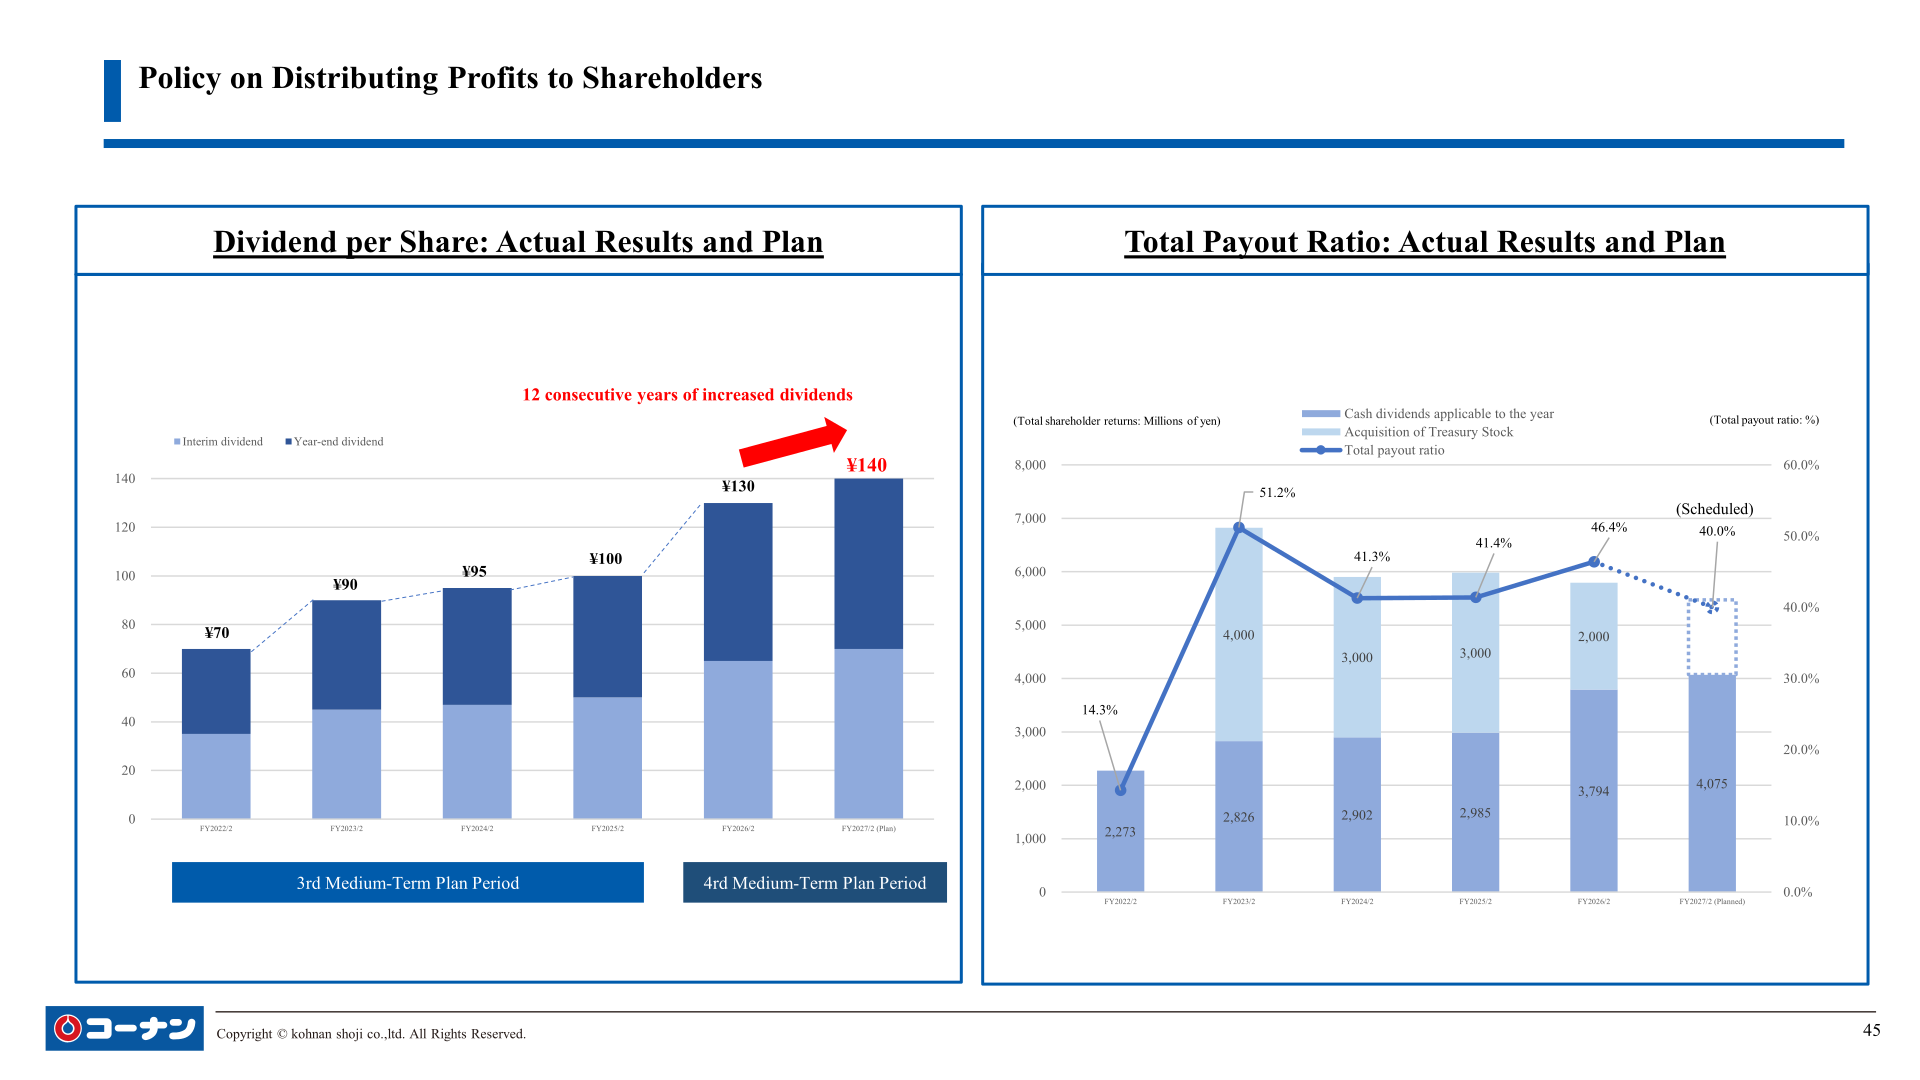
The company positions the return of profits to shareholders as one of its important management policies and, during the 4th Medium-Term Management Period (FY2026/2 – FY2028/2), will consider business outlook, investment in business activities, financial soundness and other factors comprehensively while implementing stable dividends over the long term; acquisition of treasury stock will also be considered as appropriate based on business performance and stock price levels. The target level is a total payout ratio of 40% or more together with progressive dividends. For the fiscal year ending February 2027 the company is aiming for annual dividends of ¥140 per year, an increase of ¥10 per year from the previous year’s actual, targeting a total payout ratio of 40% or more. The presentation highlights 12 consecutive years of increased dividends.
| Item | FY2026/2 | FY2027/2 (Plan) |
|---|---|---|
| Dividend per share | ¥130 | ¥140 |
| Cash dividends applicable to the year (Millions of yen) | 3,794 | 4,075 |
| Acquisition of treasury stock (Millions of yen) | 2,000 | – |
| Total payout ratio | 46.4% | 40.0% (Scheduled) |
Growth Strategy and Group Expansion
FY2/26 is described as the first year of the 4th Mid-Term Management Plan, themed “Building the Foundation for the Future,” under which the company prioritizes investment for growth across seven key strategies: store openings, product and pricing, EC and stores, fan engagement, logistics, operations and human capital management. The company opened 34 stores and closed 4 during the period, ending February 2026 with a total of 671 stores. For FY2/27 it plans 32 store openings, for a planned total of 701 stores at the end of February 2027. PRO format sales reached 147,712 million yen, against a 4th Mid-Term Management Plan final year target of 190,000 million yen, and the PRO format store count stood at 251 stores. Private brand sales on a consolidated basis totalled 154,537 million yen, representing 35.7% of the applicable total, up 0.2pt, with approximately 4,200 SKUs of PB products developed. Total EC sales grew approximately 120% year on year, and Kohnan Plus membership exceeded 1 million.
On group expansion, BORDERLESS Co., Ltd. (a Ken Depot subsidiary) joined the group on June 2, 2025, HC Mitsuwa Co., Ltd. on October 31, 2025, and I’nT Holdings Co., Ltd. on December 26, 2025. The company states that with diverse group companies joining across regions and business formats, annual sales excluding Kohnan alone will reach approximately 100 billion yen. On February 12, 2026, Kohnan announced a tender offer for shares of Alleanza Holdings Co., Ltd., a capital and business alliance agreement with that company, and a basic agreement regarding a capital and business alliance with Valor Holdings Co., Ltd. The tender offer ran from February 13 to March 30, results were announced on March 31, and on April 6 Kohnan acquired 38.79% of Alleanza Holdings shares, making it an affiliate accounted for by the equity method. The presentation shows Kohnan at approximately 49.4% investment (affiliate accounted for by equity method) and Valor Holdings at approximately 50.6% (consolidated subsidiary), and states that combined sales become the top in the home center industry.
Initiatives to Enhance Corporate Value
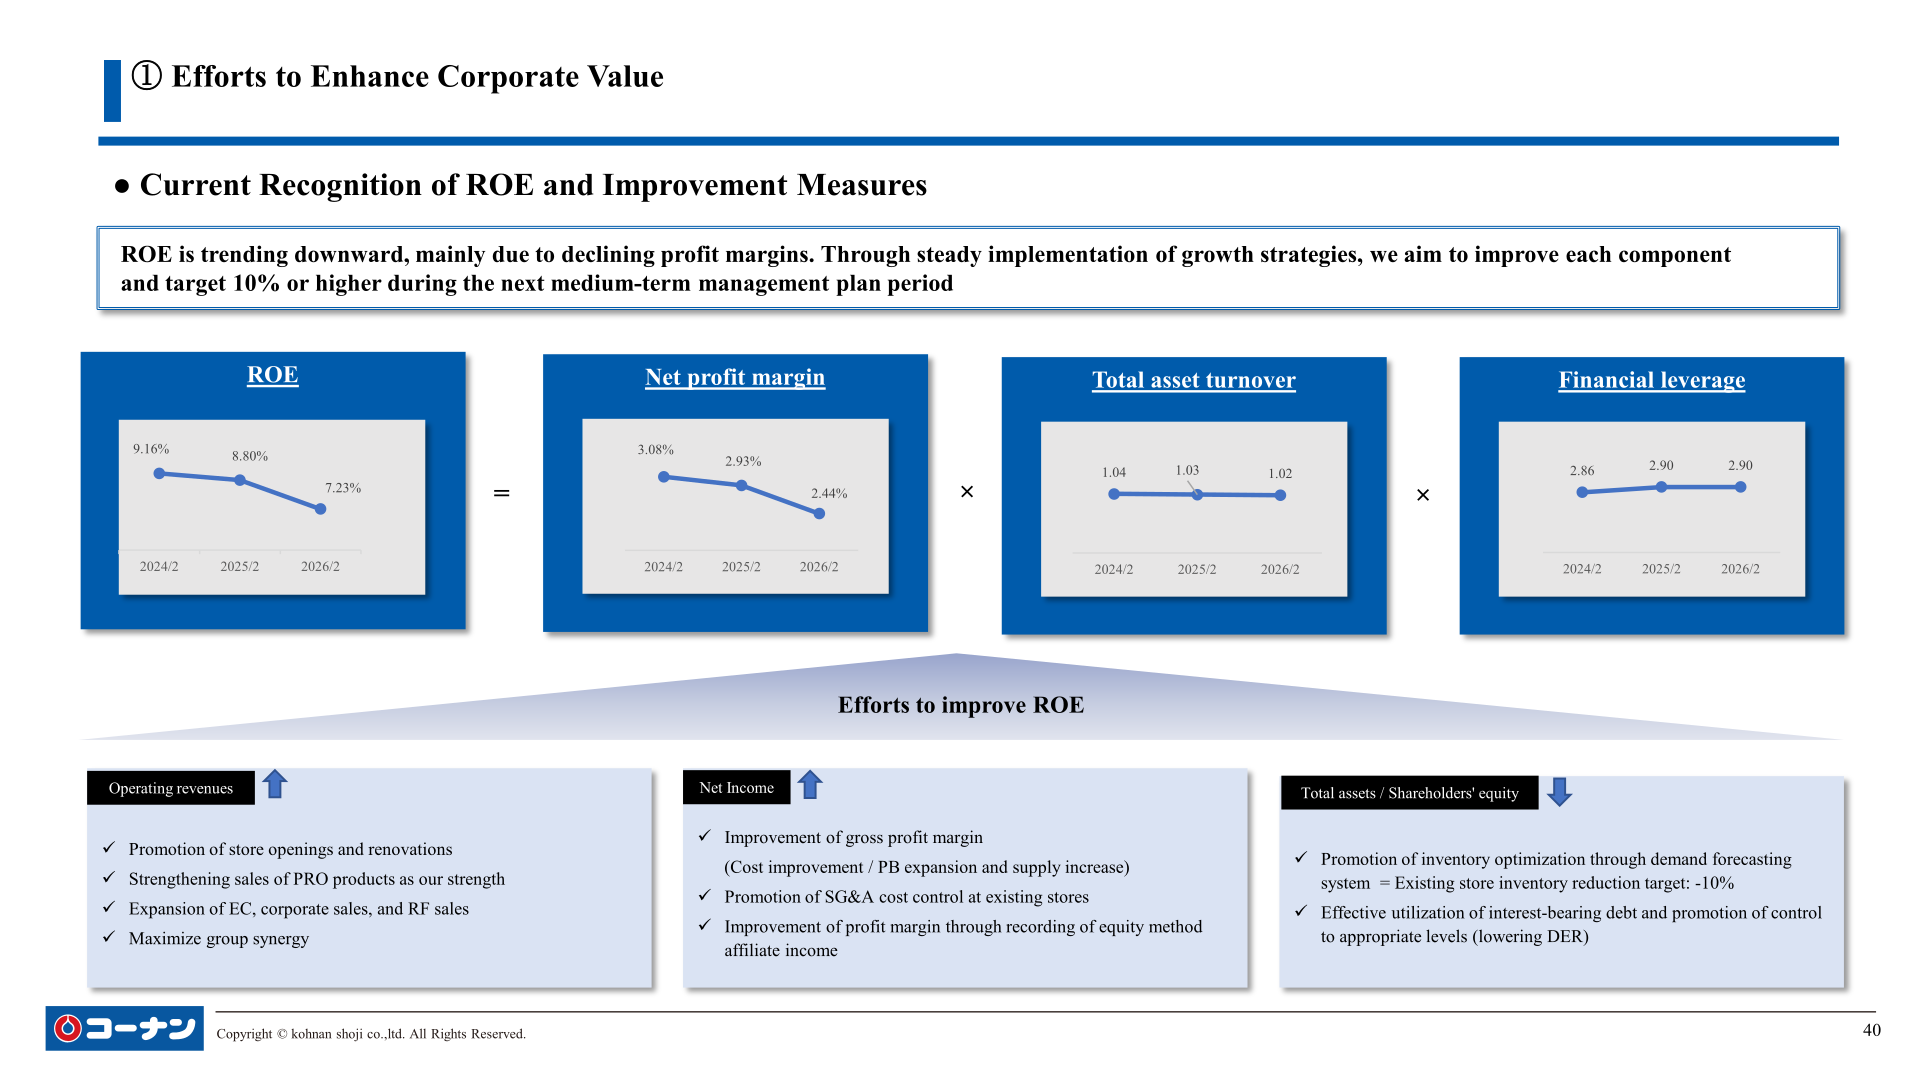
ROE was 7.23% in 2026/2, down from 8.80% in 2025/2 and 9.16% in 2024/2, which the company attributes mainly to declining profit margins; it targets 10% or higher during the next medium-term management plan period through improvement of each component — net profit margin (3.08%, 2.93% and 2.44% over the same three periods), total asset turnover (1.04, 1.03 and 1.02) and financial leverage (2.86, 2.90 and 2.90). PBR stood at 0.72x, against 0.81x in 2024/2 and 0.64x in 2025/2, while PER rose to 10.01x from 7.32x. The share price was ¥4,325 at the end of February 2026, compared with ¥1,355 in March 2015. In FY2026/February the company held 4 earnings briefings, 2 IR events for individual investors, 118 individual IR meetings for investors and 4 media interviews with the president.
This article is an analysis based on publicly available information and is not a recommendation to buy or sell any specific securities. Investment decisions are your own responsibility.
















