
This article is based on publicly available IR materials and is not a recommendation to buy or sell any specific securities.
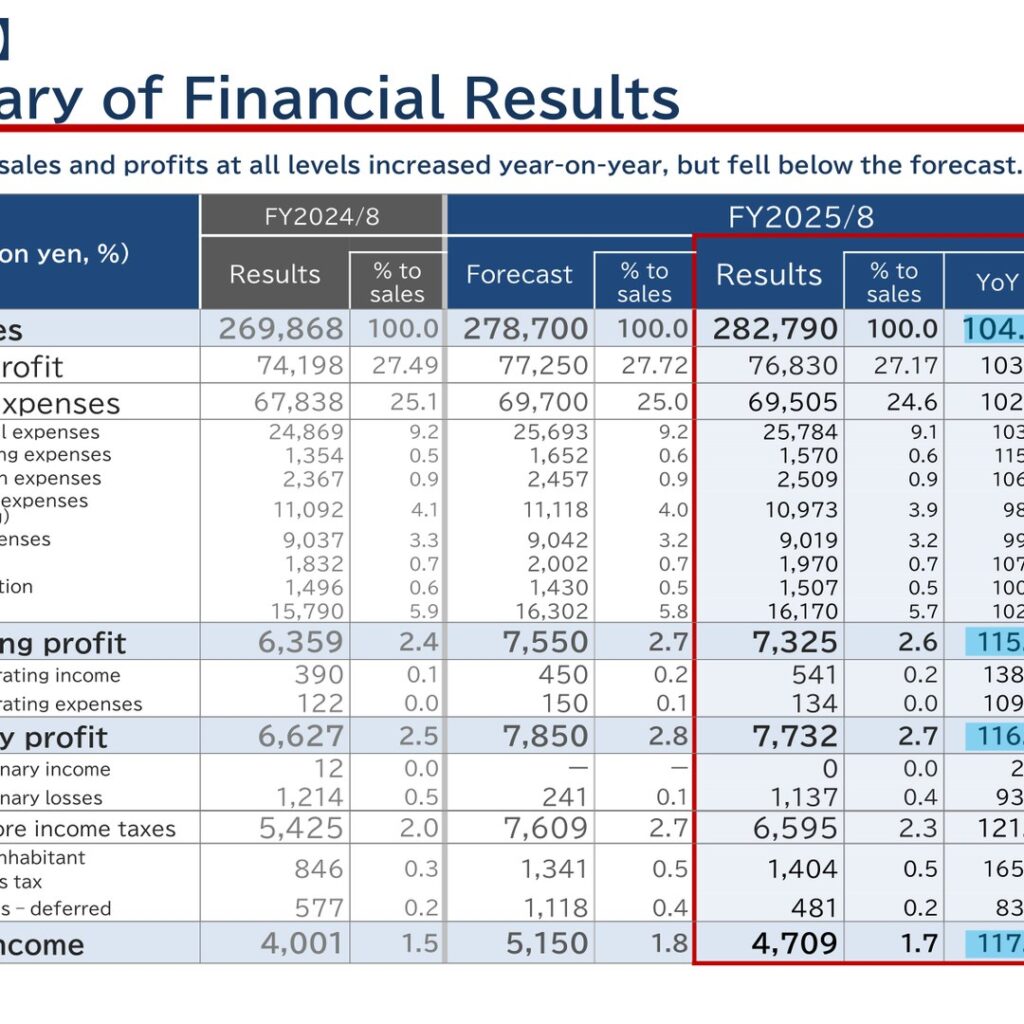
Kojima Co., Ltd. (Tokyo Stock Exchange, Prime Market: 7513) reported results for FY2025/8, the fiscal year from September 1, 2024 to August 31, 2025, in a Financial Results Briefing released on October 21, 2025. The briefing is a joint presentation covering both BicCamera Inc. (Tokyo Stock Exchange, Prime Market: 3048) and Kojima; this article covers the Kojima section of that presentation. As the materials state, net sales and profits at all levels increased year-on-year, but fell below the forecast. Net sales were 282,790 million yen (104.8% YoY, 101.5% of forecast), while operating profit was 7,325 million yen (115.2% YoY, 97.0% of forecast).
Full-Year Results (FY2025/8)
Gross profit was 76,830 million yen, with a gross profit margin of 27.17% versus 27.49% in FY2024/8. SG&A expenses were 69,505 million yen (24.6% to sales), 102.5% of the prior year and 99.7% of the forecast. Ordinary profit was 7,732 million yen (116.7% YoY) and profit income was 4,709 million yen (117.7% YoY), the latter reaching 91.4% of the forecast of 5,150 million yen. Extraordinary losses of 1,137 million yen were recorded, against 241 million yen in the forecast and 1,214 million yen in the prior year.
| Item (million yen, %) | FY2025/8 Results | % to sales | FY2025/8 Forecast | FY2024/8 Results | YoY | vs. Forecast |
|---|---|---|---|---|---|---|
| Net sales | 282,790 | 100.0 | 278,700 | 269,868 | 104.8 | 101.5 |
| Gross profit | 76,830 | 27.17 | 77,250 | 74,198 | 103.5 | 99.5 |
| SG&A expenses | 69,505 | 24.6 | 69,700 | 67,838 | 102.5 | 99.7 |
| Operating profit | 7,325 | 2.6 | 7,550 | 6,359 | 115.2 | 97.0 |
| Ordinary profit | 7,732 | 2.7 | 7,850 | 6,627 | 116.7 | 98.5 |
| Profit before income taxes | 6,595 | 2.3 | 7,609 | 5,425 | 121.6 | 86.7 |
| Profit income | 4,709 | 1.7 | 5,150 | 4,001 | 117.7 | 91.4 |
Net Sales by Sales Channel
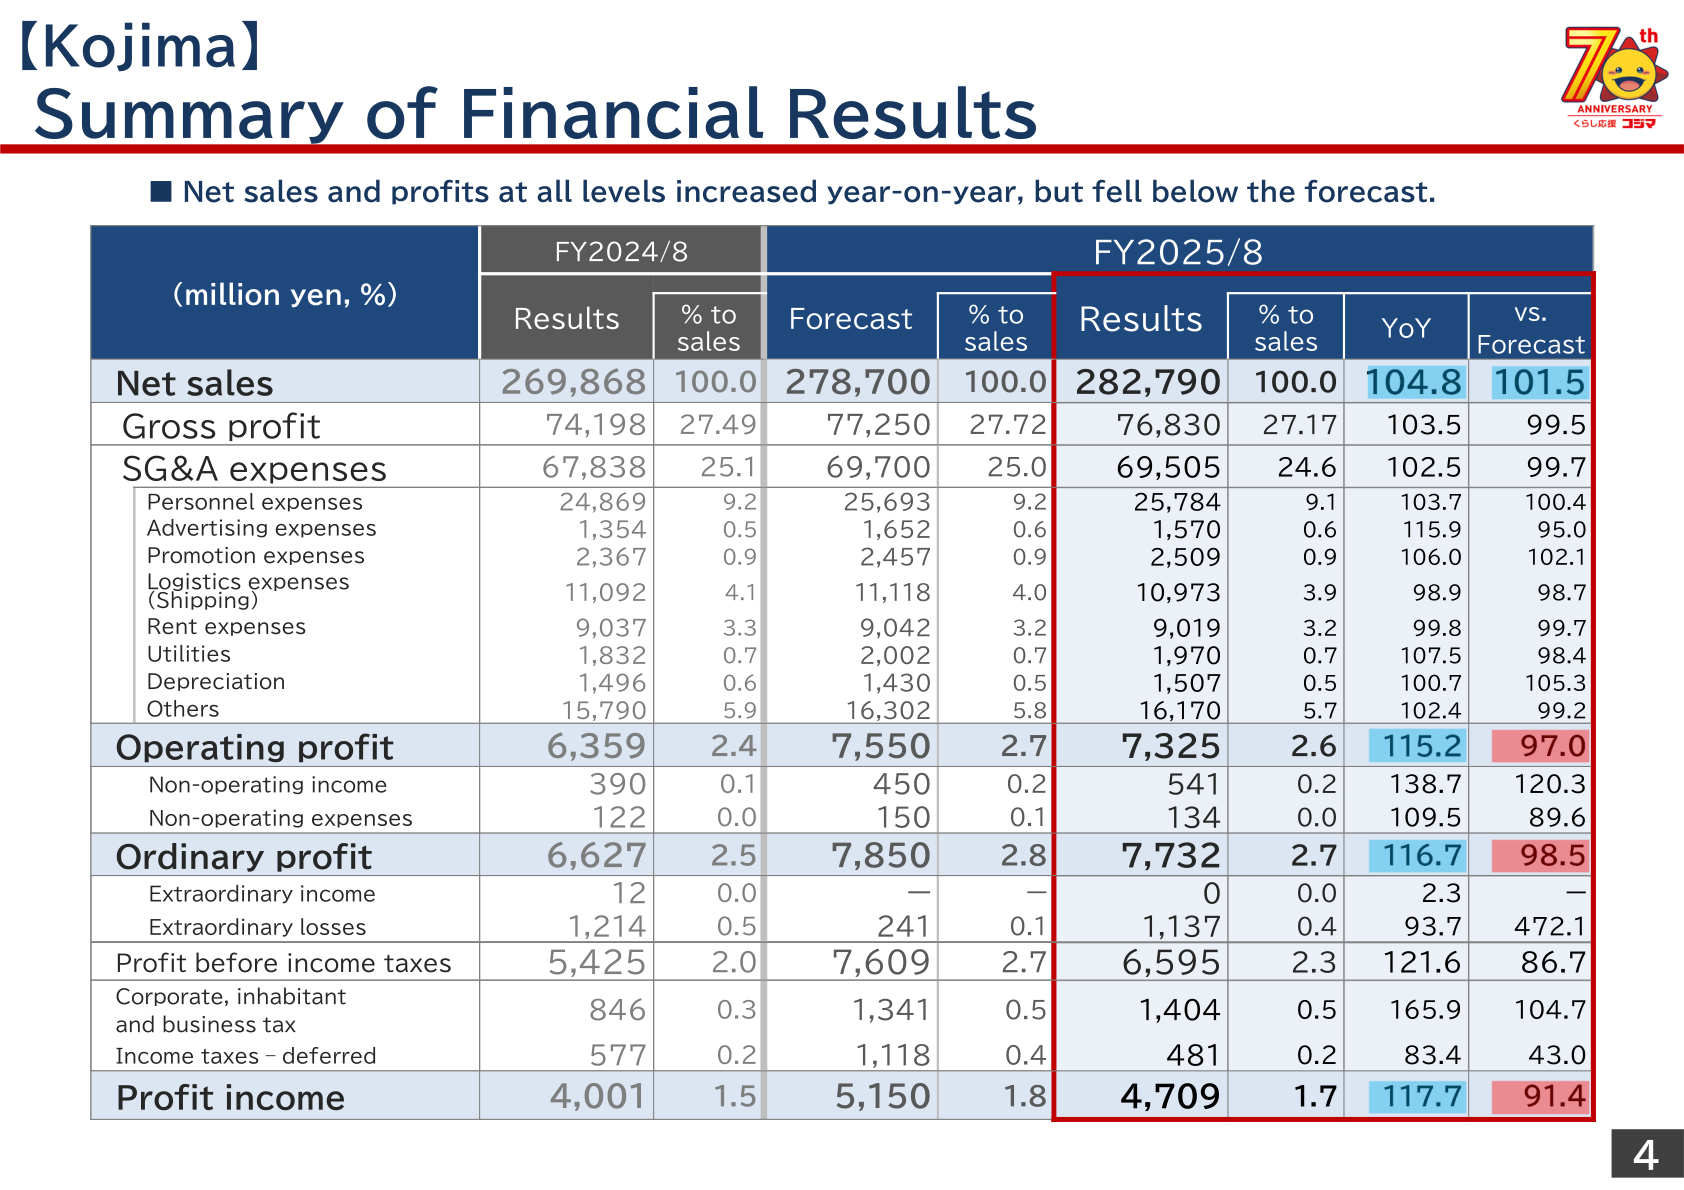
The materials state that sales increased across all existing sales channels, with stores in Tokyo and the in-house website in particular experiencing growth. Existing-store sales were 275,377 million yen (105.3% YoY, +13,803 million yen). Within this, the 29 stores located in Tokyo recorded 58,223 million yen (106.9%) and the 106 stores located outside Tokyo recorded 167,863 million yen (104.7%). EC sales were 36,876 million yen (104.7%), of which the in-house website contributed 10,064 million yen (109.9%) and mall-type EC sites 26,811 million yen (102.9%). The corporate customer business (offices) reached 12,413 million yen (106.7%), while new and closed stores accounted for 7,412 million yen (89.4%).
| Sales channel (million yen, %) | FY2025/8 | FY2024/8 | Difference | YoY |
|---|---|---|---|---|
| Total | 282,790 | 269,868 | +12,921 | 104.8 |
| Existing stores | 275,377 | 261,574 | +13,803 | 105.3 |
| Stores | 226,087 | 214,717 | +11,370 | 105.3 |
| 29 stores located in Tokyo | 58,223 | 54,449 | +3,774 | 106.9 |
| 106 stores located outside Tokyo | 167,863 | 160,267 | +7,595 | 104.7 |
| EC | 36,876 | 35,219 | +1,657 | 104.7 |
| In-house website | 10,064 | 9,156 | +908 | 109.9 |
| Mall-type EC site | 26,811 | 26,063 | +748 | 102.9 |
| Corporate customer business (offices) | 12,413 | 11,638 | +775 | 106.7 |
| New stores, Closed | 7,412 | 8,293 | (881) | 89.4 |
Net Sales by Product Category
By product, the materials state that net sales increased driven by sales of cellular phones and housing equipment, with sales of PCs and air conditioners remaining steady as well. Information communications equipment products rose to 87,053 million yen (114.2% YoY, 30.8% of sales), led by cellular phones at 43,431 million yen (126.2%) and PCs at 16,672 million yen (104.0%). Home appliances were roughly flat at 120,564 million yen (100.5%), with air conditioners at 23,333 million yen (103.2%), while audio visual products declined to 38,943 million yen (97.1%) as TVs fell to 18,024 million yen (97.2%). Housing equipment, aggregated separately, reached 10,403 million yen (118.6%). On the gross margin, the materials explain that the gross profit margin declined to 27.2% for the full year from 27.5% a year earlier, a difference of (0.3), due to an increased sales composition of cellular phones and housing equipment, which have relatively lower profit margins.
On SG&A, the materials note that in addition to investments in human capital and systems, expenses for rebranding were recorded. Personnel expenses rose by 915 million yen year-on-year on proactive investments in improving employee compensation and creating better working environments, as well as a campaign to grant employees special incentive of 70 shares through the Employee Shareholding Association. Advertising and promotion expenses increased by 358 million yen as the Company’s 70th anniversary project rebranding initiative incurred additional expenses, while logistics expenses (shipping) declined by 119 million yen. Total SG&A expenses increased by 1,667 million yen year-on-year but came in 195 million yen below the forecast.
Store Network
As of August 31, 2025, Kojima operated 139 stores nationwide, with two new openings and two closures during the fiscal year. By store format, the network comprised 81 stand-alone stores (58.2%), 34 shopping mall stores (24.5%), 15 supermarket complex stores (10.8%) and 9 other complex stores (6.9%). By region, South Kanto (Tokyo, etc.) accounted for 69 stores (49.6%), including 31 stores in Tokyo, followed by Hokkaido/Tohoku with 18 stores (12.9%), North Kanto with 15 stores (10.8%), Chubu with 15 stores (10.8%), Kinki/Chugoku with 13 stores (9.4%) and Kyushu/Okinawa with 9 stores (6.5%). Reuse sales floors have been introduced in 25 stores, including 6 stores added in the fourth quarter.
FY2026/8 Forecast
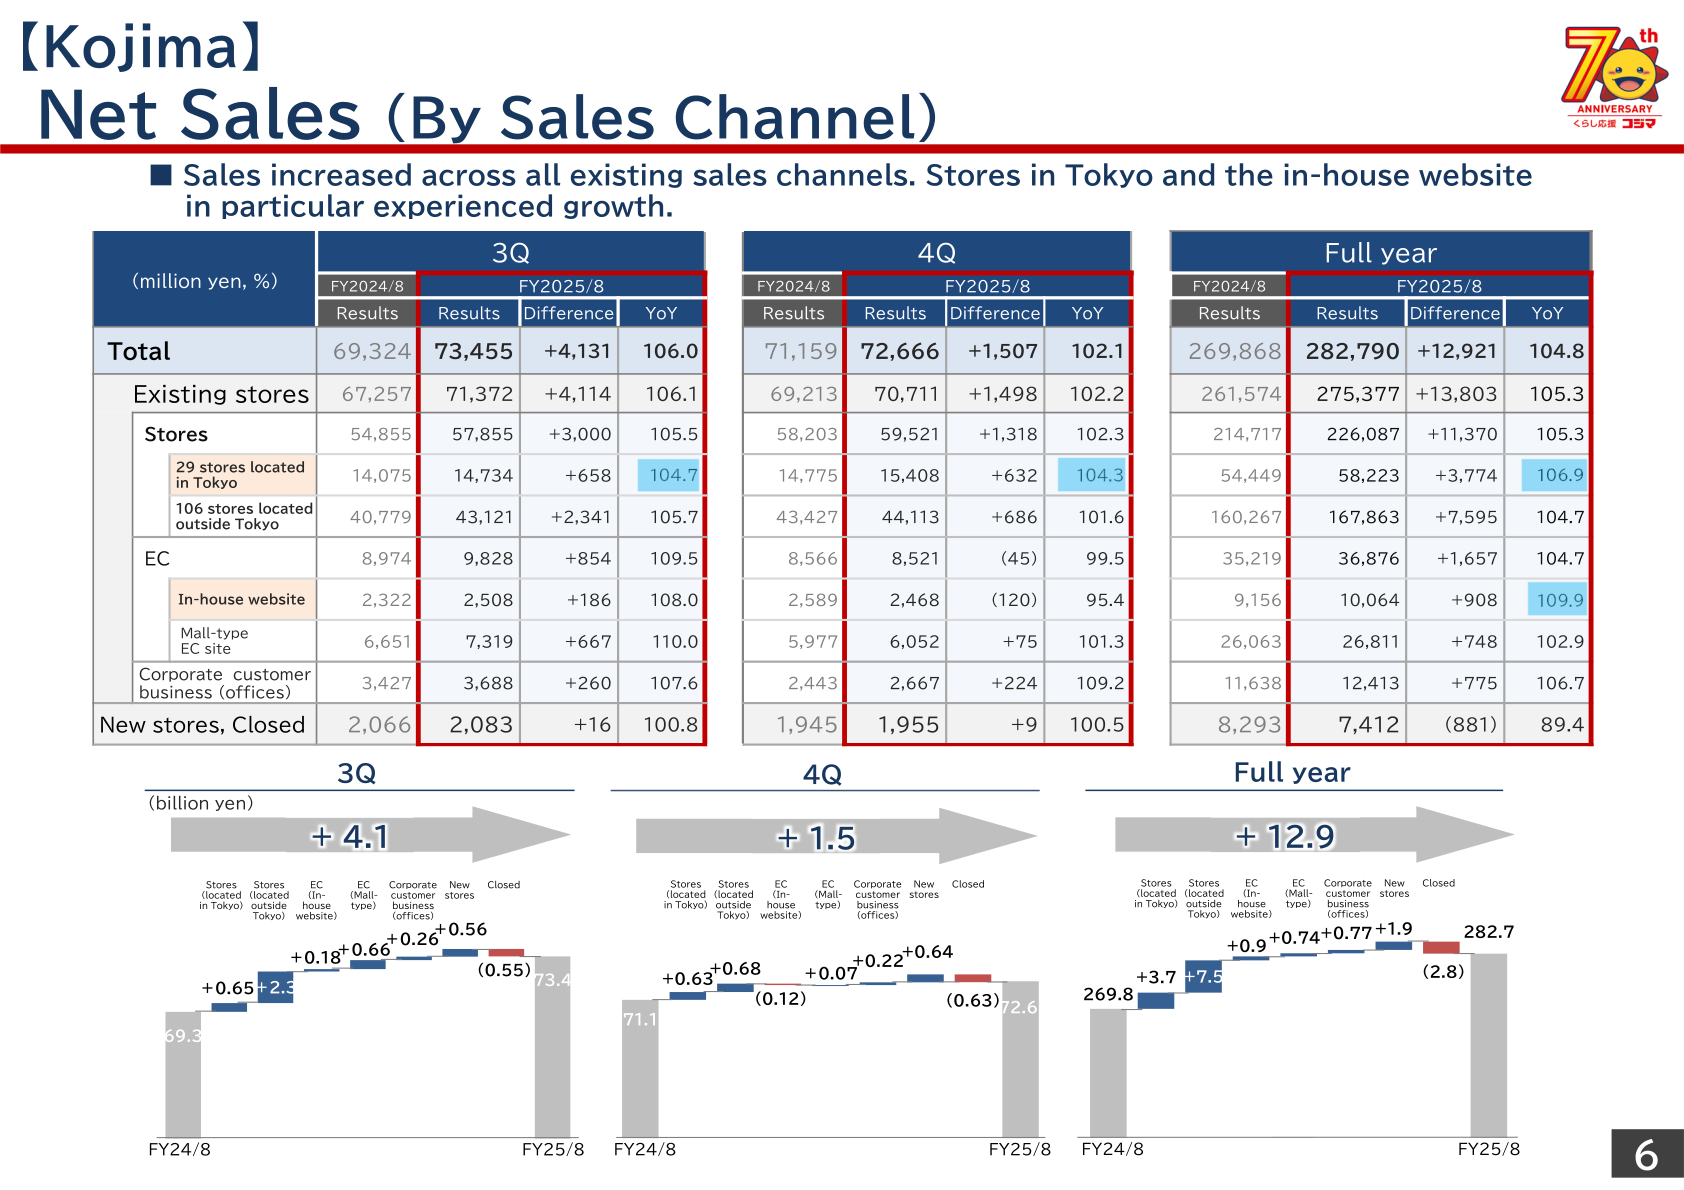
For FY2026/8, Kojima forecasts net sales of 294,000 million yen (104.0% YoY), operating profit of 7,600 million yen (103.7%), ordinary profit of 7,900 million yen (102.2%) and profit income of 4,900 million yen (104.1%). The forecast assumes a gross profit margin of 27.2% and an operating profit margin of 2.6%. By half, first-half net sales are forecast at 143,000 million yen (104.6%) and second-half net sales at 151,000 million yen (103.3%).
| Item (million yen, %) | FY2026/8 Forecast | FY2025/8 Results | YoY |
|---|---|---|---|
| Net sales | 294,000 | 282,790 | 104.0 |
| Operating profit | 7,600 | 7,325 | 103.7 |
| Ordinary profit | 7,900 | 7,732 | 102.2 |
| Profit income | 4,900 | 4,709 | 104.1 |
| Net sales (1H) | 143,000 | 136,667 | 104.6 |
| Net sales (2H) | 151,000 | 146,122 | 103.3 |
Shareholder Returns
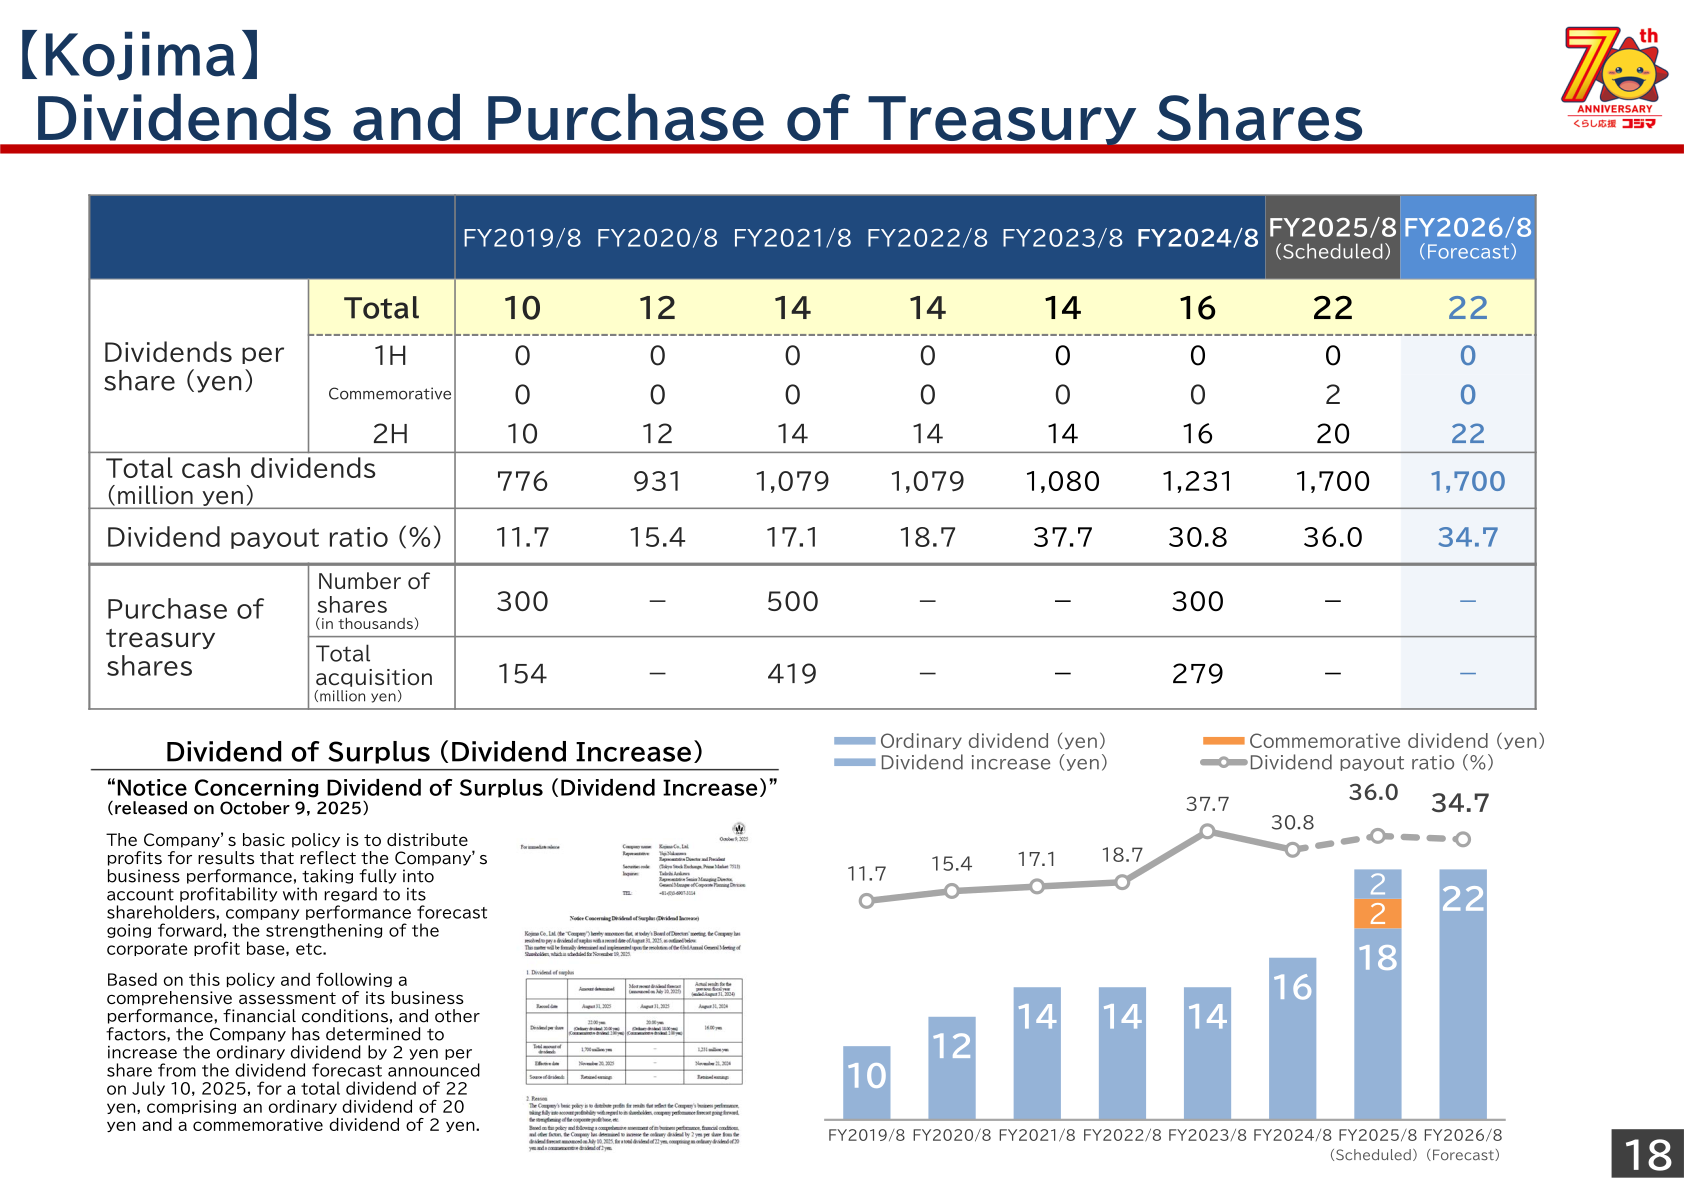
The materials cite the Company’s basic policy of distributing profits for results that reflect the Company’s business performance, taking fully into account profitability with regard to its shareholders, company performance forecast going forward, and the strengthening of the corporate profit base. Following the “Notice Concerning Dividend of Surplus (Dividend Increase)” released on October 9, 2025, the Company determined to increase the ordinary dividend by 2 yen per share from the dividend forecast announced on July 10, 2025, for a total dividend of 22 yen, comprising an ordinary dividend of 20 yen and a commemorative dividend of 2 yen. Total cash dividends for FY2025/8 are 1,700 million yen with a dividend payout ratio of 36.0%. For FY2026/8, the Company forecasts a total dividend of 22 yen per share, total cash dividends of 1,700 million yen and a payout ratio of 34.7%. No purchase of treasury shares is shown for FY2025/8 or FY2026/8; the most recent purchase shown is 300 thousand shares for 279 million yen in FY2024/8.
| Item | FY2023/8 | FY2024/8 | FY2025/8 (Scheduled) | FY2026/8 (Forecast) |
|---|---|---|---|---|
| Dividends per share, total (yen) | 14 | 16 | 22 | 22 |
| 1H (yen) | 0 | 0 | 0 | 0 |
| Commemorative (yen) | 0 | 0 | 2 | 0 |
| 2H (yen) | 14 | 16 | 20 | 22 |
| Total cash dividends (million yen) | 1,080 | 1,231 | 1,700 | 1,700 |
| Dividend payout ratio (%) | 37.7 | 30.8 | 36.0 | 34.7 |
Medium-Term Management Plan and Initiatives
Against the Medium-Term Management Plan, FY2025/8 net sales of 282.7 billion yen and operating profit of 7.3 billion yen exceeded the plan figures of 275.3 billion yen and 6.4 billion yen. The FY2026/8 forecast of 294.0 billion yen in net sales and 7.6 billion yen in operating profit is likewise above the plan’s 283.0 billion yen and 6.7 billion yen, and the plan targets 315.0 billion yen in net sales and 9.0 billion yen in operating profit for FY2029/8.
As future initiatives, the materials cite continuing the plan commemorating the 70th anniversary of the company’s foundation in FY2026/8, sales promotion campaigns featuring popular content to capture new customers, particularly young people, and the establishment of a new “Sales Support Department” to improve customer satisfaction. Electronic shelf labels are to be introduced at all stores, with completion scheduled for FY2026/8 3Q, and a new store, Kojima & BicCamera Aeon Mall Sendai Kamisugi Store, opened on October 8, 2025. Three growth businesses are highlighted: e-commerce (expanding payment and same-day delivery services and OMO promotion), the corporate customer business (expanding the network of corporate sales locations, from 10 locations at FY2024/8-end and 14 at FY2025/8-end to a target of 17 at FY2026/8-end), and the housing equipment business (developing renewable energy products and renovation personnel).
This article is an analysis based on publicly available information and is not a recommendation to buy or sell any specific securities. Investment decisions are your own responsibility.
















