
This article is based on publicly available IR materials and is not a recommendation to buy or sell any specific securities.
Note: TAKEBISHI labels the fiscal year ended March 31, 2026 as “FY3/2026”; the labels used in the text, tables and segment data below follow the company’s presentation. TAKEBISHI Corporation, a Kyoto-based technological trading company affiliated with Mitsubishi Electric, reported record-high net sales and profits for FY3/2026. Net sales rose 9% year on year to ¥109.9 billion, operating income rose 19% to ¥4.1 billion, ordinary income rose 18% to ¥4.5 billion and net income rose 11% to ¥3.0 billion. For FY3/2027 the company plans a second consecutive year of higher revenue and profit with new record highs, and forecasts an annual dividend of ¥80 per share.
Consolidated Results (FY3/2026 Full Year)
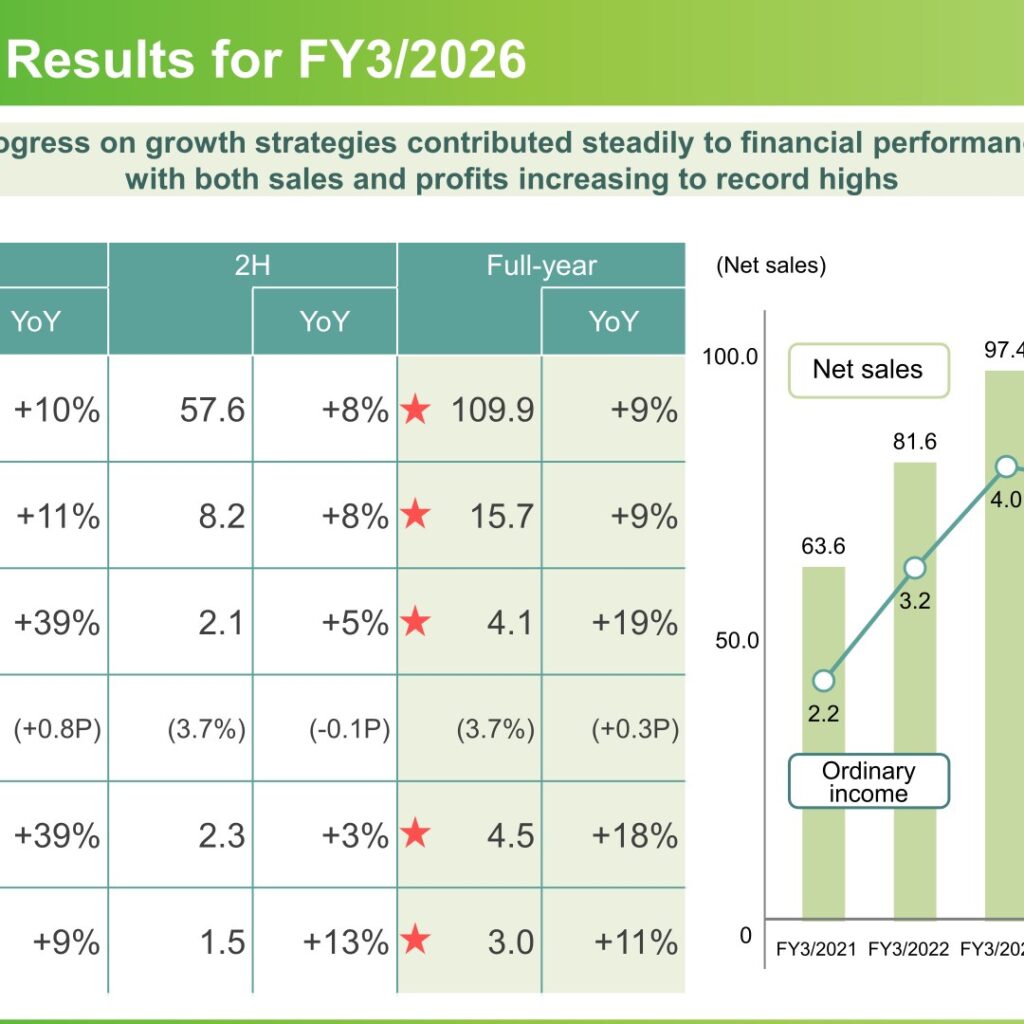
The company states that progress on its growth strategies contributed steadily to financial performance, with both sales and profits increasing to record highs. Net sales, gross profit, operating income, ordinary income and net income were all marked as record highs in the presentation. Net sales were ¥52.2 billion in the first half (+10%) and ¥57.6 billion in the second half (+8%). The full-year operating margin was 3.7%, up 0.3 points year on year.
| Item (Billion yen) | 1H | YoY | 2H | YoY | Full-year | YoY |
|---|---|---|---|---|---|---|
| Net sales | 52.2 | +10% | 57.6 | +8% | 109.9 | +9% |
| Gross profit | 7.6 | +11% | 8.2 | +8% | 15.7 | +9% |
| Operating income | 2.0 | +39% | 2.1 | +5% | 4.1 | +19% |
| (Operating margin) | (3.8%) | (+0.8P) | (3.7%) | (-0.1P) | (3.7%) | (+0.3P) |
| Ordinary income | 2.2 | +39% | 2.3 | +3% | 4.5 | +18% |
| Net income | 1.5 | +9% | 1.5 | +13% | 3.0 | +11% |
The company attributes the improvement in profitability to strategic business expansion and the promotion of M&A, despite an increase in SG&A expenses due to growth investments. Operating income moved from ¥3.43 billion in FY3/2025 to ¥4.08 billion in FY3/2026, an increase of ¥0.65 billion (+19%). Scale fluctuation added ¥1.42 billion — comprising devices +¥0.61 billion, information and communications +¥0.36 billion (of which environmental analysis-related +¥0.12 billion), electronic medical equipment +¥0.24 billion, FA equipment +¥0.15 billion and others +¥0.06 billion — while an increase in SG&A expenses reduced operating income by ¥0.72 billion, rises in write-offs and valuation losses on inventory by ¥0.04 billion and foreign exchange impact by ¥0.01 billion.
By sales composition for FY3/2026, Industrial Equipment and Systems accounted for 36% (¥39.6 bn), Semiconductors and Devices 35% (¥38.1 bn) and Social, Information and Communications 29% (¥32.2 bn). Domestic sales were 77% (¥84.1 bn) and overseas sales 23% (¥25.8 bn). Consolidated employees numbered 930 as of March 31, 2026, and share capital was 3,448 million yen.
Segment Results
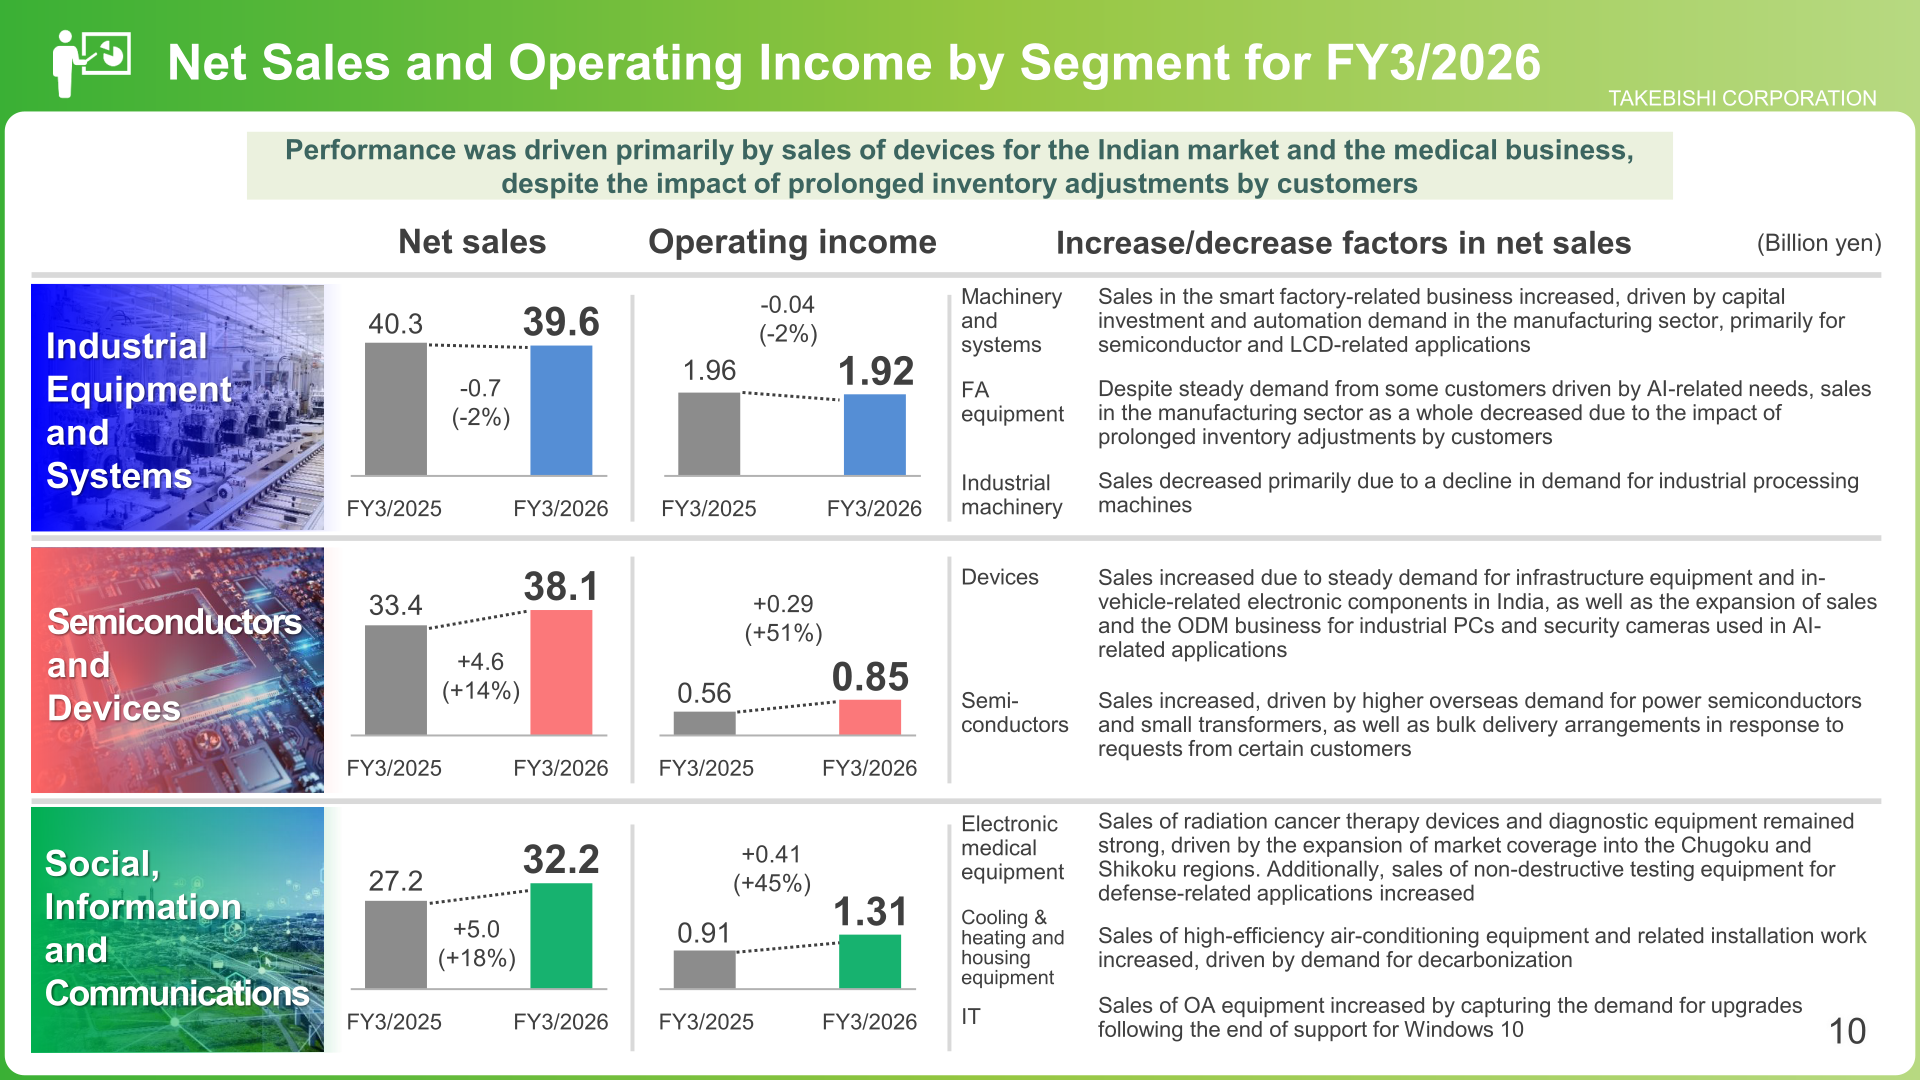
Performance was driven primarily by sales of devices for the Indian market and the medical business, despite the impact of prolonged inventory adjustments by customers. In Industrial Equipment and Systems, smart factory-related sales increased on capital investment and automation demand in the manufacturing sector, primarily for semiconductor and LCD-related applications, while FA equipment sales declined on prolonged customer inventory adjustments and industrial machinery sales fell on lower demand for industrial processing machines. In Semiconductors and Devices, device sales increased on steady demand for infrastructure equipment and in-vehicle-related electronic components in India and on expansion of the ODM business for industrial PCs and security cameras used in AI-related applications, while semiconductor sales rose on higher overseas demand for power semiconductors and small transformers. In Social, Information and Communications, sales of radiation cancer therapy devices and diagnostic equipment remained strong on expanded market coverage into the Chugoku and Shikoku regions, high-efficiency air-conditioning equipment sales grew on decarbonization demand, and OA equipment sales captured upgrade demand following the end of support for Windows 10.
| Segment | Metric (Billion yen) | FY3/2025 | FY3/2026 | FY3/2027 (Forecast) |
|---|---|---|---|---|
| Industrial Equipment and Systems | Net sales | 40.3 | 39.6 | 42.6 |
| Industrial Equipment and Systems | Operating income | 1.96 | 1.92 | 2.08 |
| Semiconductors and Devices | Net sales | 33.4 | 38.1 | 38.8 |
| Semiconductors and Devices | Operating income | 0.56 | 0.85 | 1.1 |
| Social, Information and Communications | Net sales | 27.2 | 32.2 | 31.6 |
| Social, Information and Communications | Operating income | 0.91 | 1.31 | 1.13 |
FY3/2027 Forecast
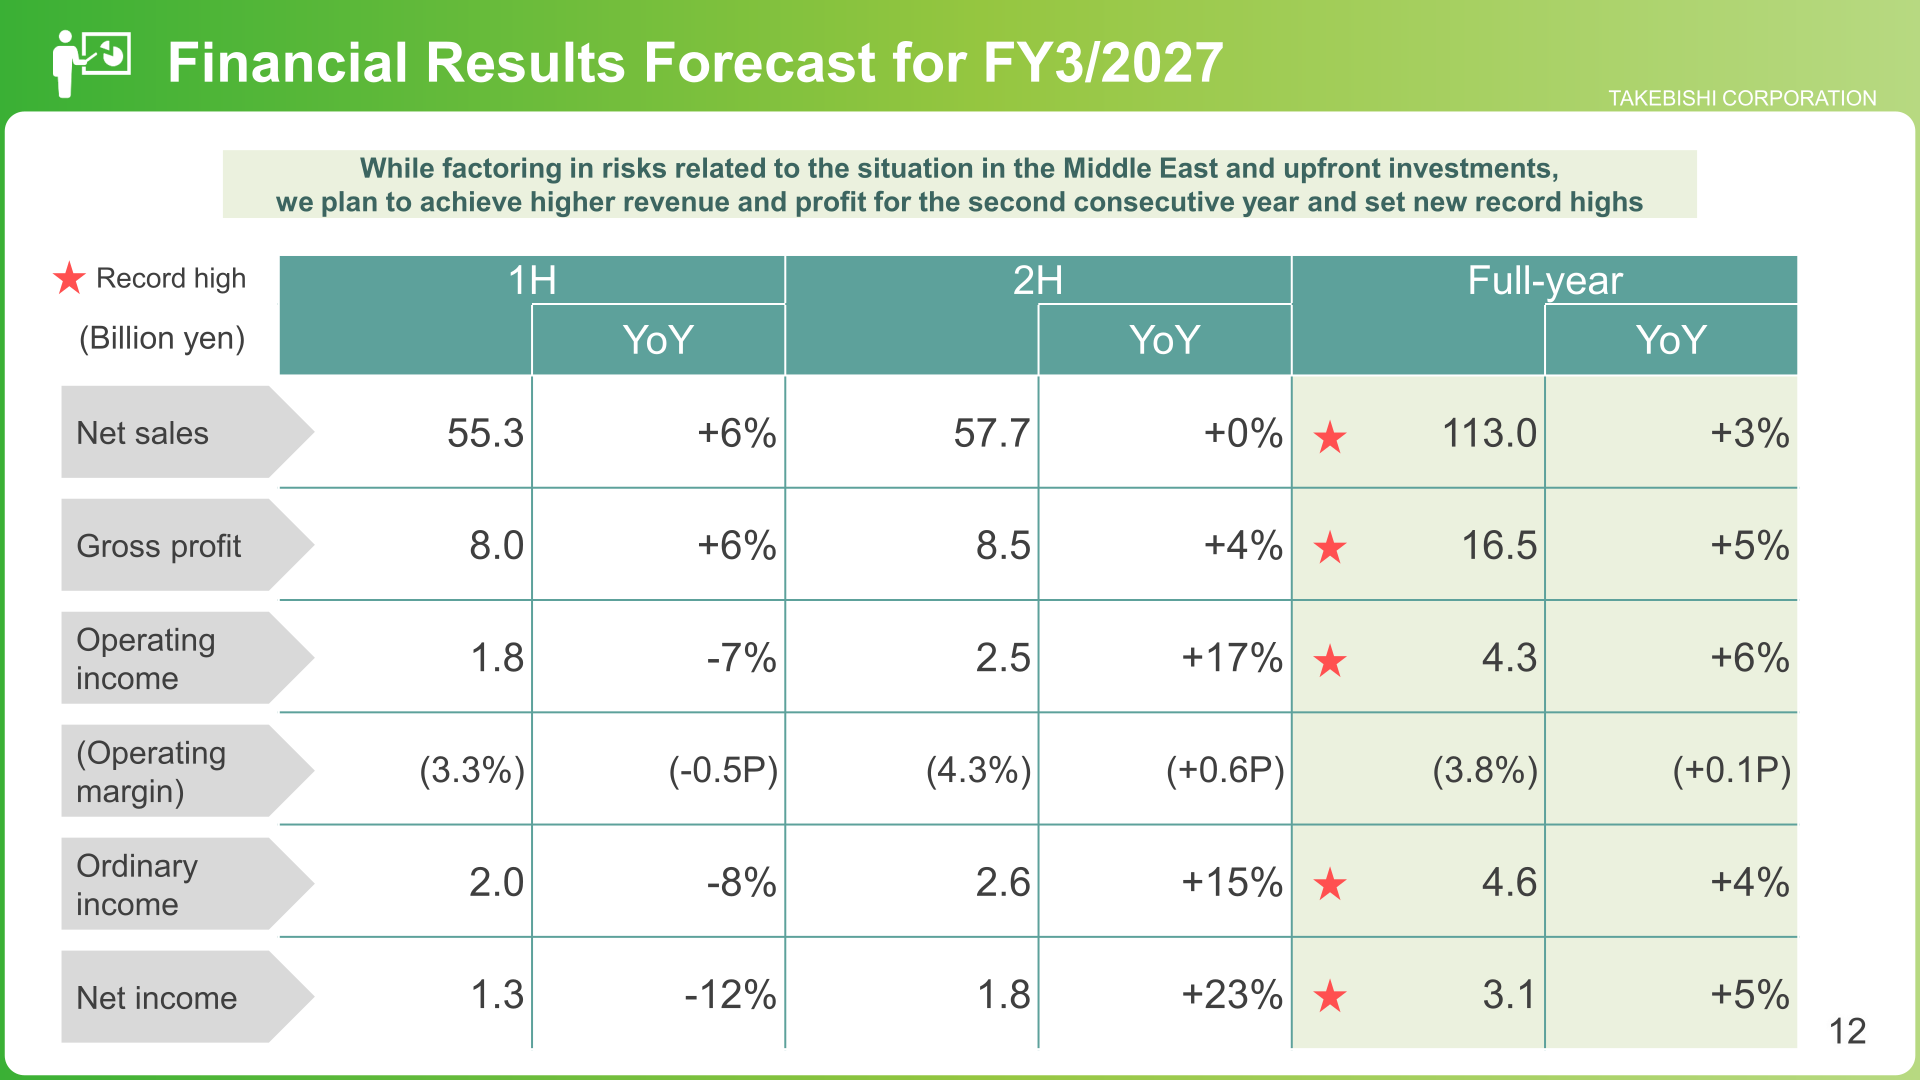
While factoring in risks related to the situation in the Middle East and upfront investments, the company plans to achieve higher revenue and profit for the second consecutive year and set new record highs. Net sales are forecast at ¥113.0 billion (+3%), operating income at ¥4.3 billion (+6%) with an operating margin of 3.8%, ordinary income at ¥4.6 billion (+4%) and net income at ¥3.1 billion (+5%). By segment, Industrial Equipment and Systems is expected to grow as demand from semiconductor-related customers rises on expanding AI investment; Semiconductors and Devices is expected to grow in India in the infrastructure, in-vehicle and AI-related sectors; and Social, Information and Communications is expected to decline due to a rebound from the concentration of replacement demand for mainstay radiation cancer therapy devices and diagnostic equipment such as CT and MRI systems in the previous fiscal year.
| Item (Billion yen) | 1H | YoY | 2H | YoY | Full-year | YoY |
|---|---|---|---|---|---|---|
| Net sales | 55.3 | +6% | 57.7 | +0% | 113.0 | +3% |
| Gross profit | 8.0 | +6% | 8.5 | +4% | 16.5 | +5% |
| Operating income | 1.8 | -7% | 2.5 | +17% | 4.3 | +6% |
| (Operating margin) | (3.3%) | (-0.5P) | (4.3%) | (+0.6P) | (3.8%) | (+0.1P) |
| Ordinary income | 2.0 | -8% | 2.6 | +15% | 4.6 | +4% |
| Net income | 1.3 | -12% | 1.8 | +23% | 3.1 | +5% |
Shareholder Returns
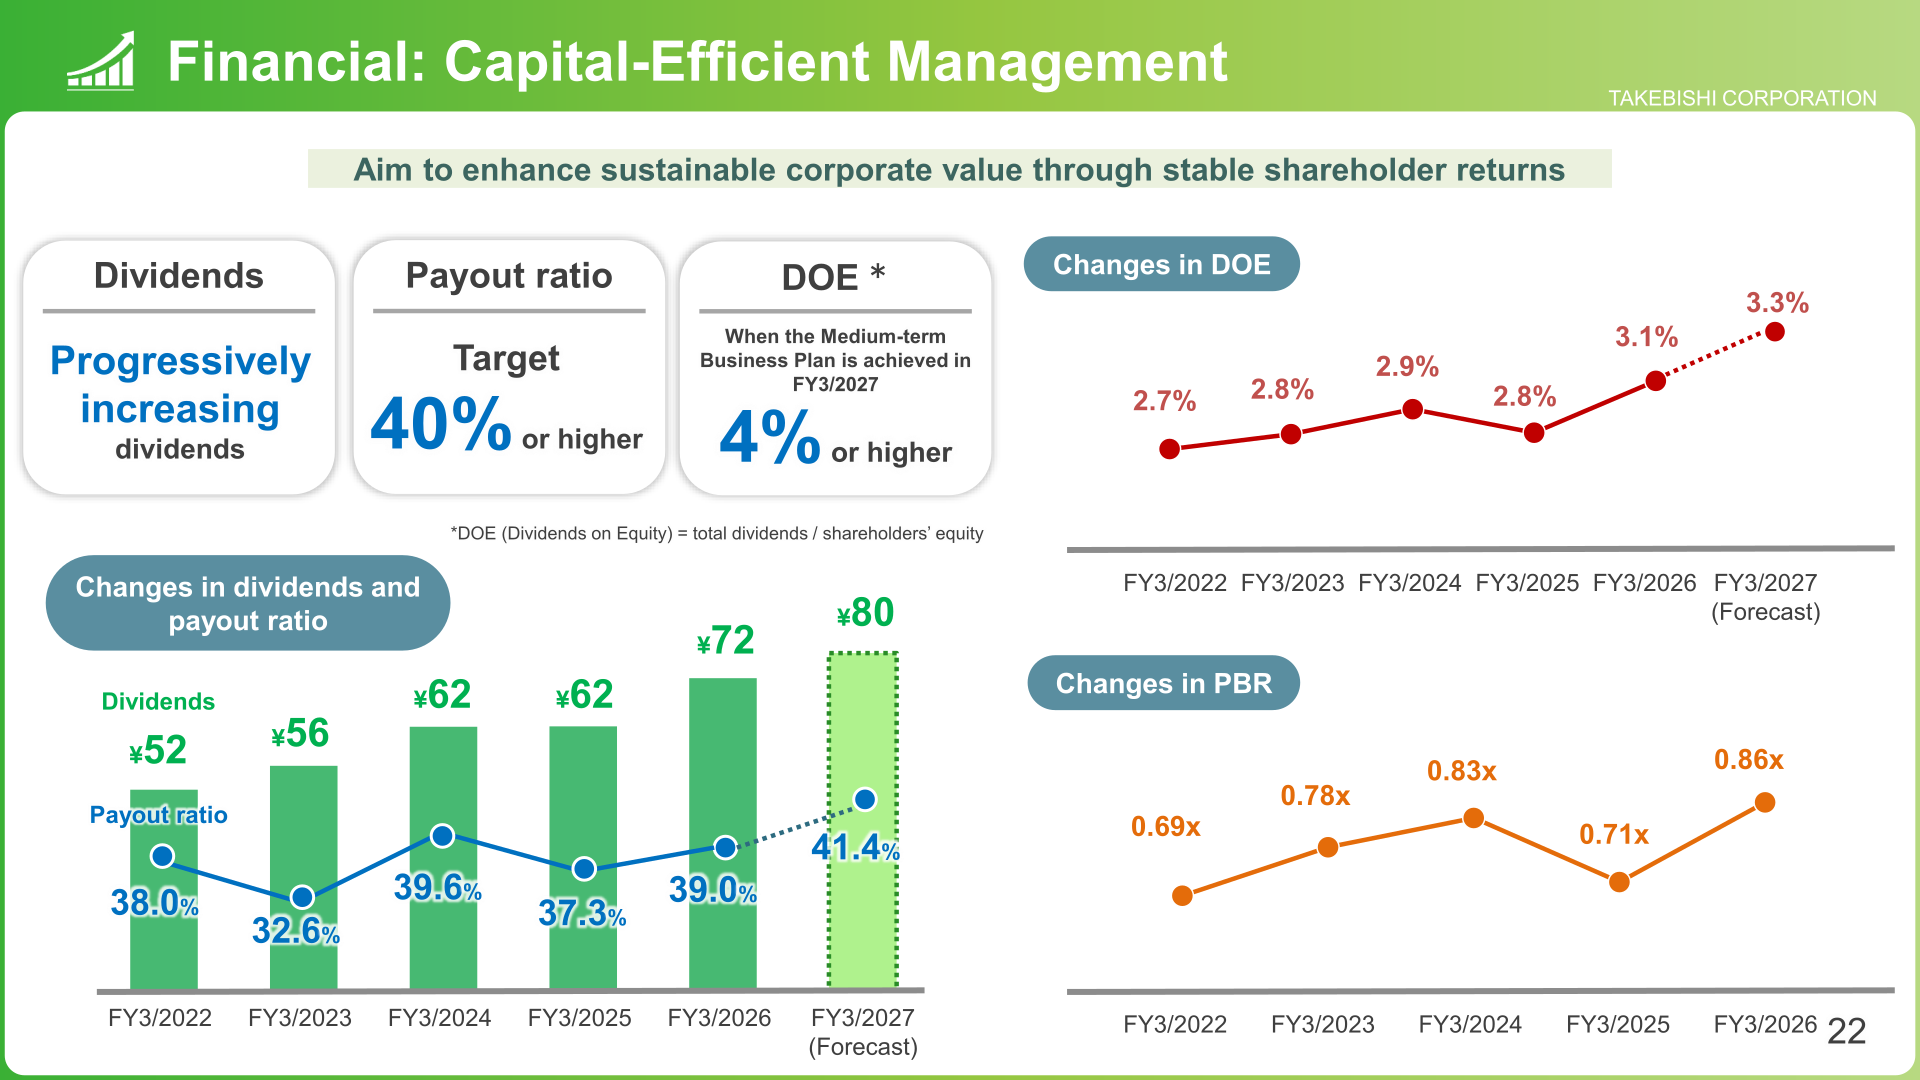
TAKEBISHI aims to enhance sustainable corporate value through stable shareholder returns, with a policy of progressively increasing dividends, a payout ratio target of 40% or higher, and DOE (dividends on equity, defined in the materials as total dividends divided by shareholders’ equity) of 4% or higher when the medium-term business plan is achieved in FY3/2027. The annual dividend rose to ¥72 in FY3/2026 from ¥62 in FY3/2025, and a further increase to ¥80 is forecast for FY3/2027. PBR moved from 0.71x in FY3/2025 to 0.86x in FY3/2026.
| Item | FY3/2022 | FY3/2023 | FY3/2024 | FY3/2025 | FY3/2026 | FY3/2027 (Forecast) |
|---|---|---|---|---|---|---|
| Dividends per share | ¥52 | ¥56 | ¥62 | ¥62 | ¥72 | ¥80 |
| Payout ratio | 38.0% | 32.6% | 39.6% | 37.3% | 39.0% | 41.4% |
| DOE | 2.7% | 2.8% | 2.9% | 2.8% | 3.1% | 3.3% |
Medium-Term Business Plan “T-Link1369”
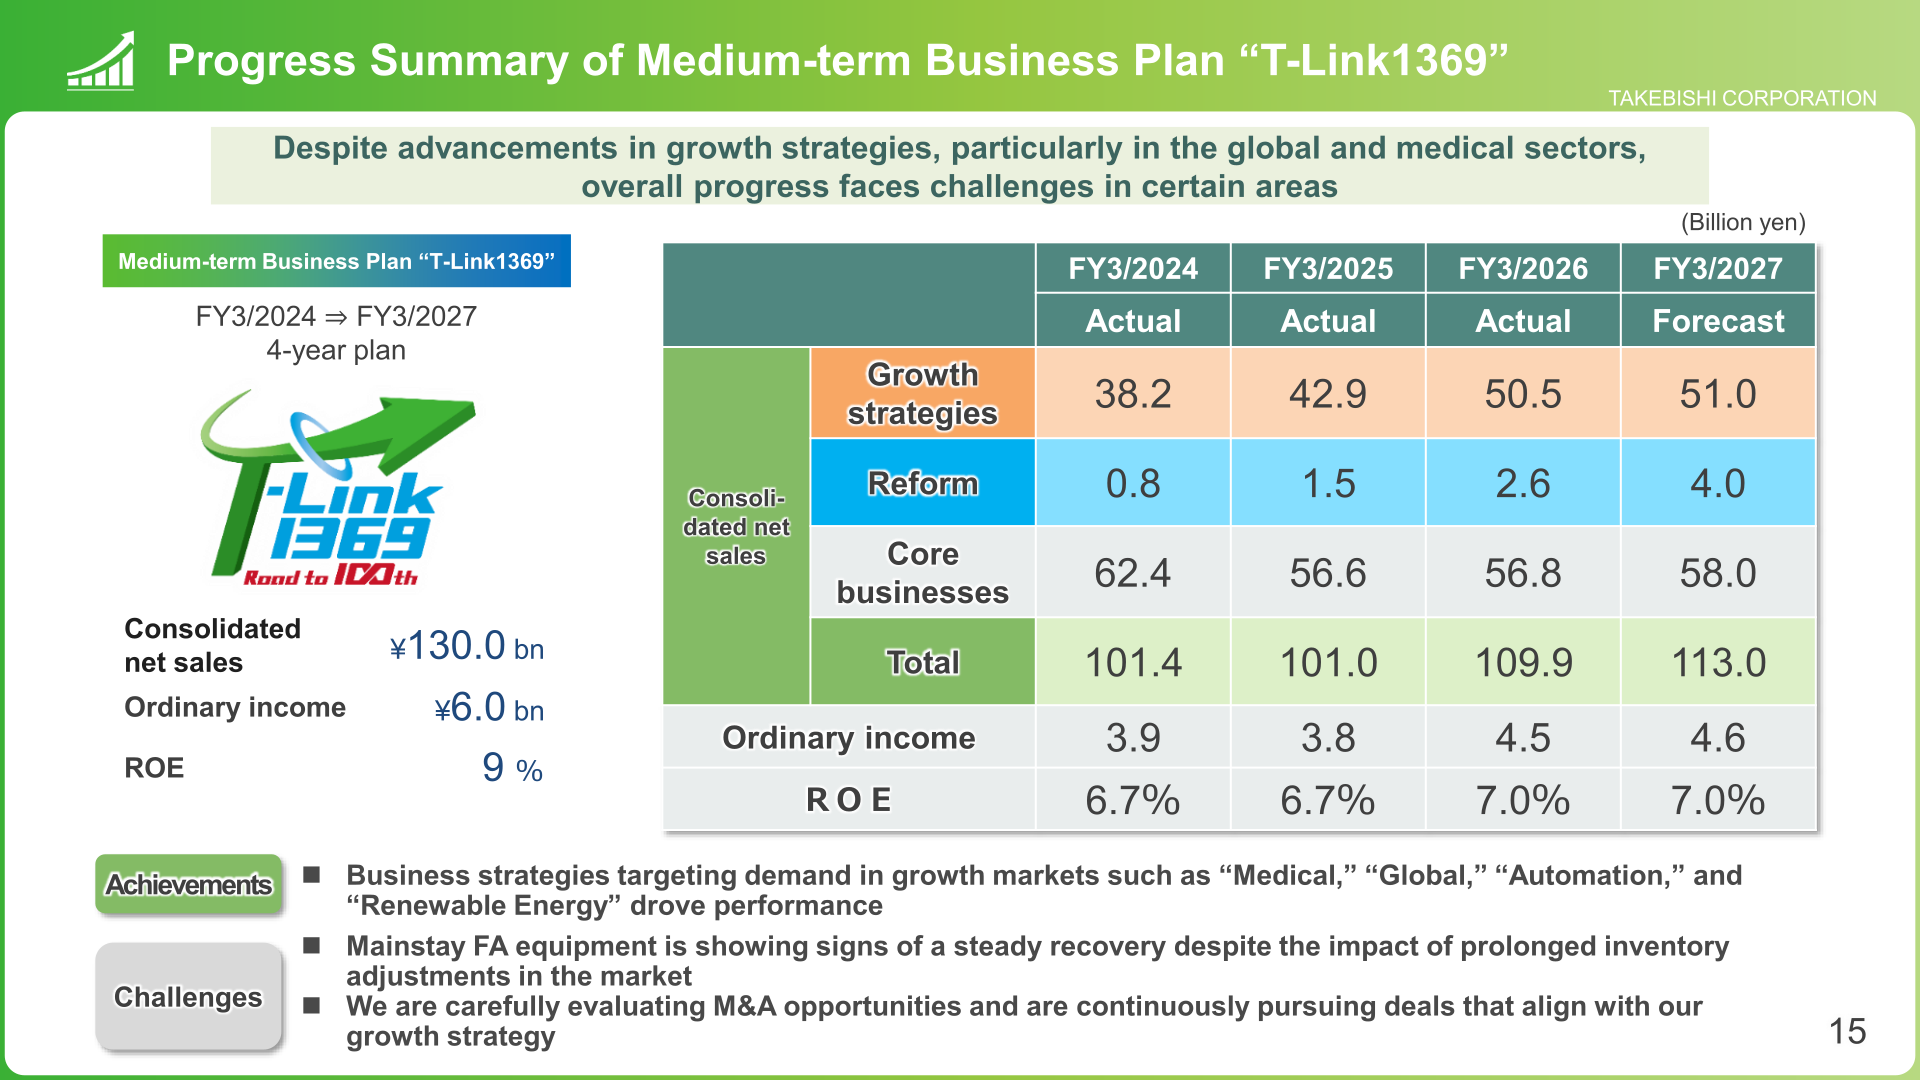
“T-Link1369” is a four-year plan running from FY3/2024 to FY3/2027, targeting consolidated net sales of ¥130.0 bn, ordinary income of ¥6.0 bn and ROE of 9%. Consolidated net sales are broken down into growth strategies, reform and core businesses: growth strategies rose from 38.2 in FY3/2024 to 42.9 in FY3/2025 and 50.5 in FY3/2026, with 51.0 forecast for FY3/2027; reform rose from 0.8 to 1.5 and 2.6, with 4.0 forecast; and core businesses moved from 62.4 to 56.6 and 56.8, with 58.0 forecast. Ordinary income was 3.9, 3.8 and 4.5 with 4.6 forecast, and ROE was 6.7%, 6.7% and 7.0% with 7.0% forecast. The company says business strategies targeting demand in growth markets such as “Medical,” “Global,” “Automation” and “Renewable Energy” drove performance, while it notes as challenges that mainstay FA equipment is showing signs of a steady recovery despite prolonged inventory adjustments in the market, and that it is carefully evaluating M&A opportunities.
Under the four priority measures, Global net sales were 25.8 in FY3/2026 against 22.9 in FY3/2025, with 26.5 forecast for FY3/2027; within that, business in India was 7.8 in FY3/2026 versus 5.7 in FY3/2025, with 8.3 forecast for FY3/2027, and the company aims for net sales of ¥10 billion in India in FY3/2029. Medical net sales reached 16.7 in FY3/2026 from 12.6 in FY3/2025, achieving the initial sales target of ¥13 billion ahead of schedule, with 15.5 forecast for FY3/2027. Automation net sales were 6.2 in FY3/2026 versus 5.9 in FY3/2025, with 7.0 forecast for FY3/2027. Original products recorded net sales of 1.5 in FY3/2026 against 1.3 in FY3/2025, with 1.7 forecast for FY3/2027, and cumulative actual sales of the original products reached 62,000 units across 76 countries worldwide. In focus businesses for AI and semiconductor-related markets, the company forecasts ¥20 bn in net sales for FY3/2027 and targets ¥30 bn in net sales in total for FY3/2031.
This article is an analysis based on publicly available information and is not a recommendation to buy or sell any specific securities. Investment decisions are your own responsibility.
















