
This article is based on publicly available IR materials and is not a recommendation to buy or sell any specific securities.
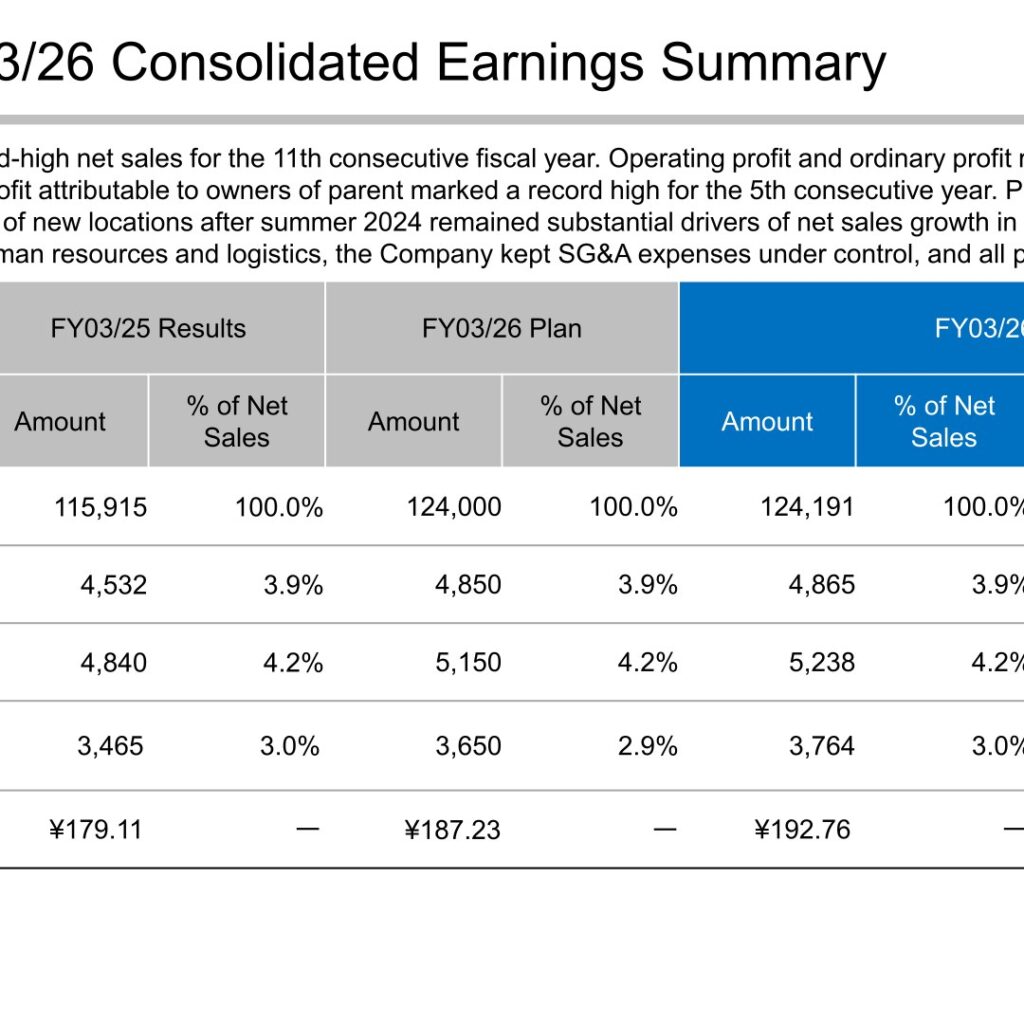
Note: KOHSOKU CORPORATION labels the fiscal year ended March 31, 2026 as “FY03/26”; this site classifies that year as FY2025, and all labels below follow the company’s own materials. KOHSOKU, a trading company specializing in food packaging, reported net sales of 124,191 million yen for FY03/26, up 107.1% year on year, achieving record-high net sales for the 11th consecutive fiscal year. Operating profit and ordinary profit reached record highs for the 8th consecutive year, and profit attributable to owners of parent marked a record high for the 5th consecutive year. All profit categories exceeded the company’s initial plan for the year.
Consolidated Results (Full-Year Actual)
According to the materials, price revisions and business expansion from new locations opened after the summer of 2024 remained substantial drivers of net sales growth in 1H FY03/26. Despite upfront spending in areas such as human resources and logistics, the company kept SG&A expenses under control, and all profit categories exceeded initial projections. Net sales came in at 100.2% of plan and profit attributable to owners of parent at 103.1% of plan.
| Item (Millions of Yen) | FY03/25 Results | FY03/26 Plan | FY03/26 Results | YoY | Versus Plan |
|---|---|---|---|---|---|
| Net Sales | 115,915 | 124,000 | 124,191 | 107.1% | 100.2% |
| Operating Profit | 4,532 | 4,850 | 4,865 | 107.4% | 100.3% |
| Ordinary Profit | 4,840 | 5,150 | 5,238 | 108.2% | 101.7% |
| Profit Attributable to Owners of Parent | 3,465 | 3,650 | 3,764 | 108.6% | 103.1% |
| Earnings Per Share | ¥179.11 | ¥187.23 | ¥192.76 | 107.6% | 103.0% |
Cost Structure and Operating Profit Drivers
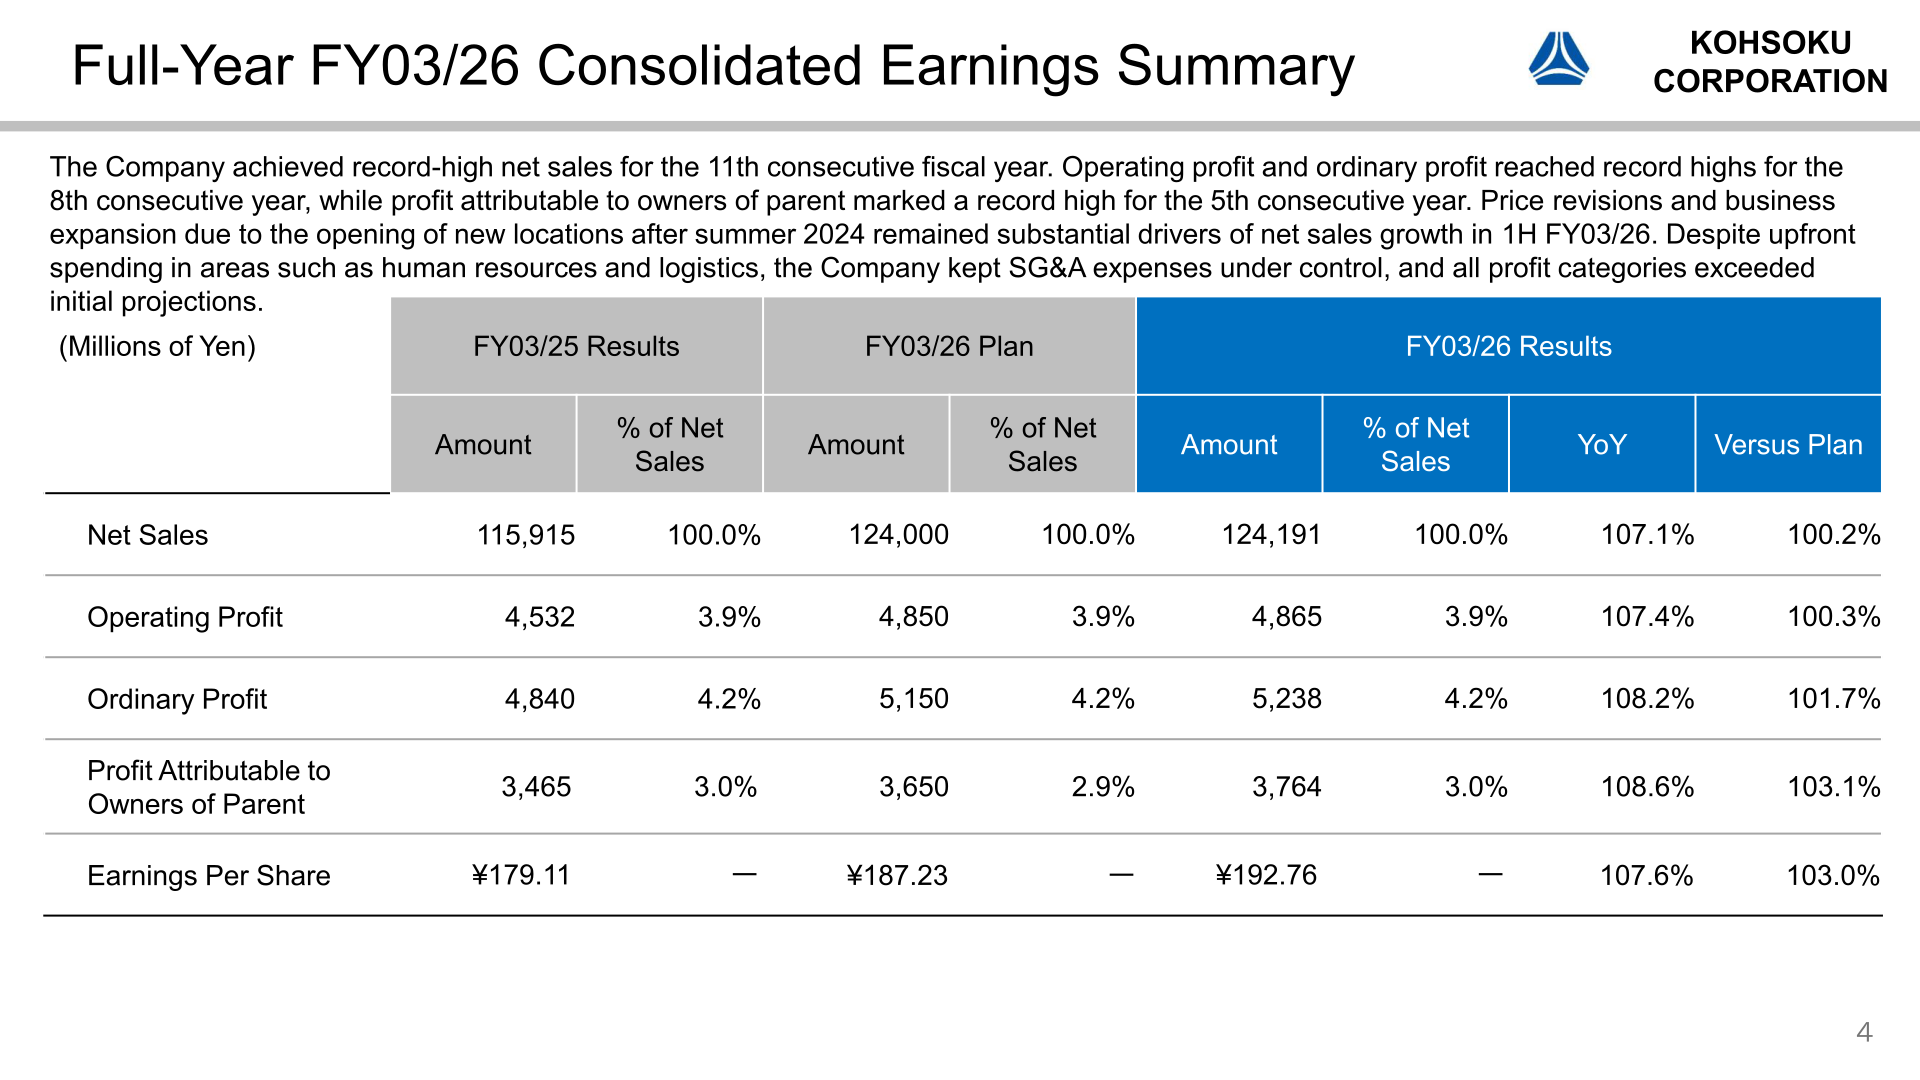
Net sales rose to 107.1% YoY while gross profit increased to 107.4% YoY, and overall SG&A expenses also rose to 107.4% YoY. The materials attribute the gross profit gain to higher net sales, including at group companies, driven by value-added proposals. Personnel expenses increased on higher headcount at the Hiroshima and Himeji sales offices together with base pay increases; freight and packing costs rose with shipment volumes; rent expenses increased slightly on expansion of operations at existing warehouses; depreciation rose slightly on routine investments; and other expenses increased on outsourcing fees in line with higher net sales plus a temporary increase in advertising and promotional expenses for recruitment and other purposes.
The company’s operating profit bridge from FY03/25 to FY03/26 shows operating profit of 4,532 million yen rising to 4,865 million yen, with gross profit contributing 1,708 million yen and negative contributions from personnel expenses (854), freight and packing costs (194), rent expenses on real estate (38), depreciation (36) and other (251), all in millions of yen as presented in the materials.
| Item (Millions of Yen) | FY03/24 | FY03/25 | FY03/26 | FY03/26 YoY | FY03/26 % of Net Sales |
|---|---|---|---|---|---|
| Net Sales | 106,216 | 115,915 | 124,191 | 107.1% | 100.0% |
| SG&A Expenses | 16,660 | 18,508 | 19,883 | 107.4% | 16.0% |
| Personnel Expenses | 8,386 | 9,259 | 10,113 | 109.2% | 8.1% |
| Freight and Packing Costs | 2,676 | 2,970 | 3,165 | 106.5% | 2.5% |
| Rent expenses on real estate | 625 | 688 | 726 | 105.6% | 0.6% |
| Depreciation | 668 | 680 | 716 | 105.3% | 0.6% |
| Other | 4,303 | 4,909 | 5,160 | 105.1% | 4.2% |
Sales Mix by Product Group
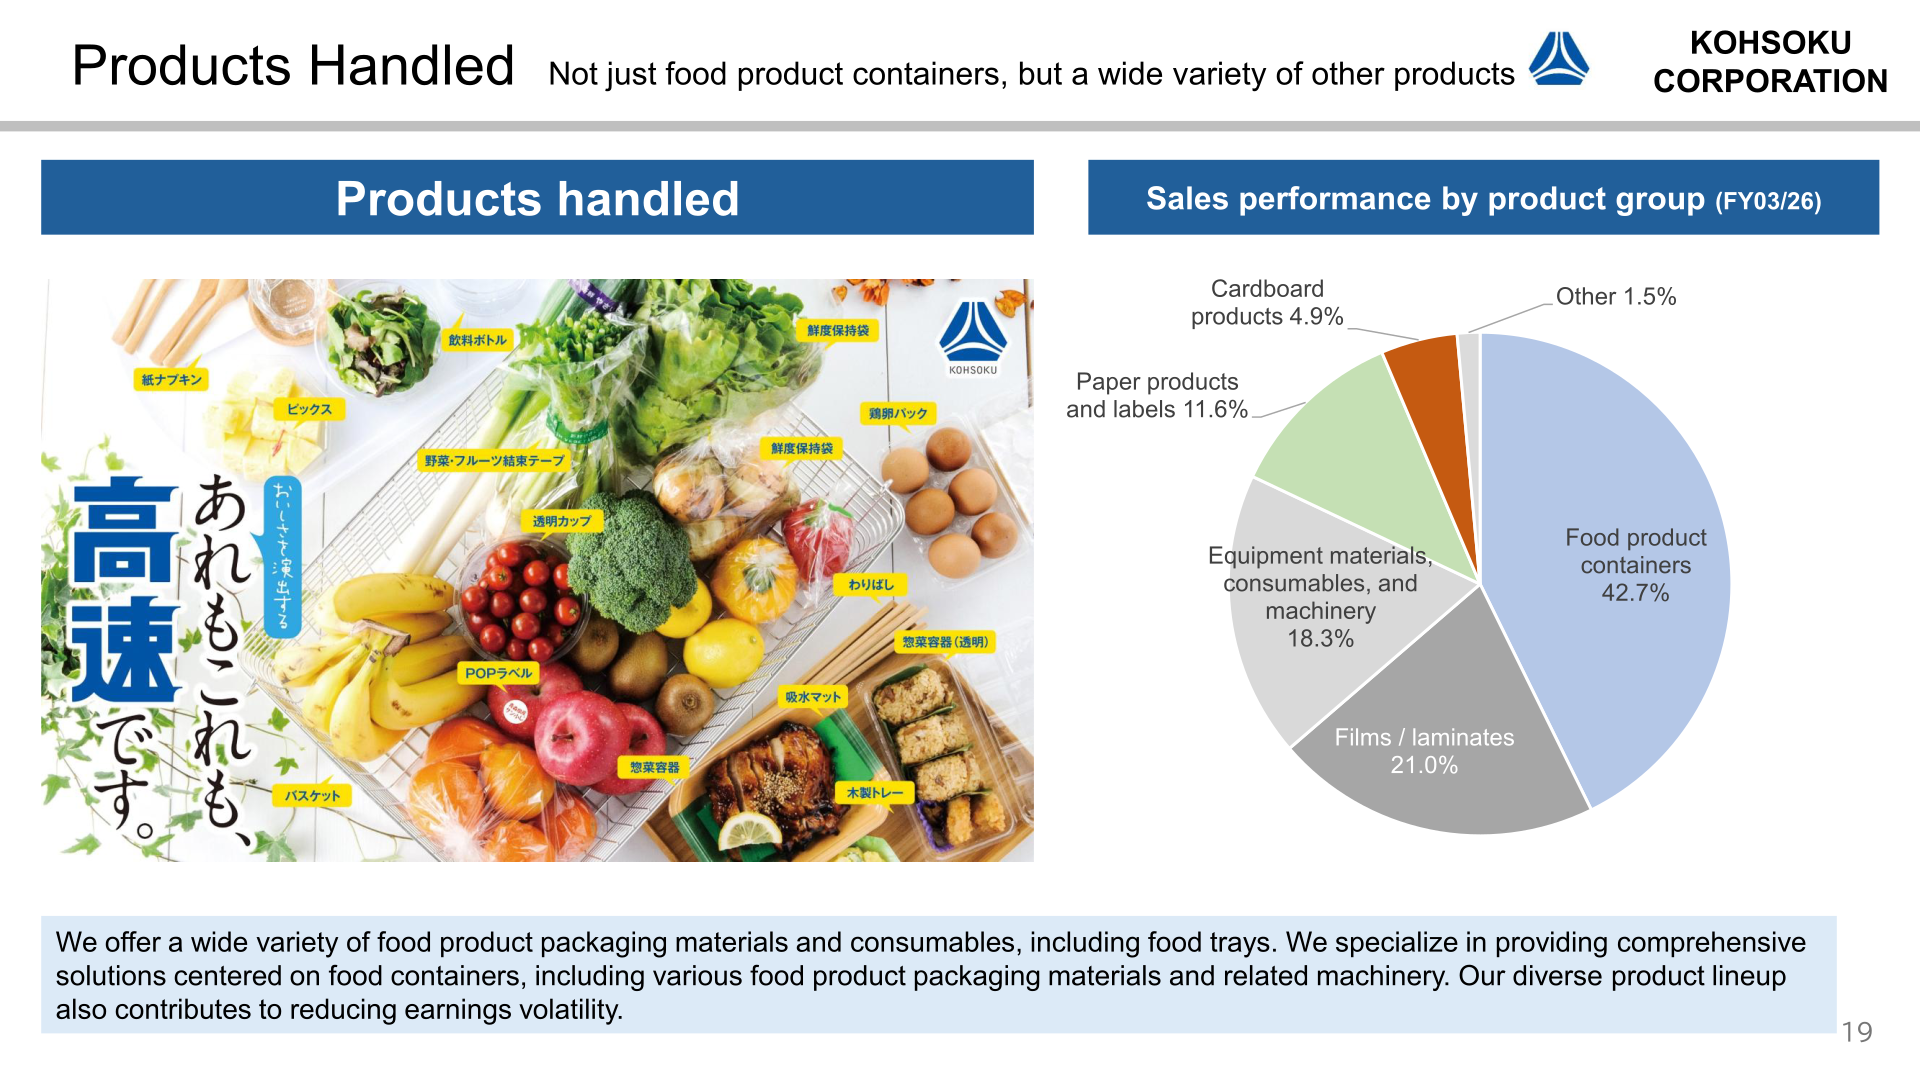
KOHSOKU does not present a segment breakdown in these materials; instead it discloses sales performance by product group. The company describes itself as a food packaging specialist trading company connecting supermarket and food factory customers with manufacturers, offering food product packaging materials and consumables including food trays as well as related machinery, and states that its diverse product lineup also contributes to reducing earnings volatility. The FY03/26 sales composition by product group is as follows.
| Product Group | Share of Sales (FY03/26) |
|---|---|
| Food product containers | 42.7% |
| Films / laminates | 21.0% |
| Equipment materials, consumables, and machinery | 18.3% |
| Paper products and labels | 11.6% |
| Cardboard products | 4.9% |
| Other | 1.5% |
Balance Sheet and Capital Investment
Total assets stood at 63,178 million yen at end-March 2026, up 1,931 million yen from end-March 2025. Property, plant and equipment expanded significantly to 24,340 million yen from 20,491 million yen following the acquisition of a sales location in Western Japan. In addition, changes to accounts payable payment terms in response to legal revisions have been completed, resulting in a decrease in accounts payable compared to the previous period, and as a result cash and deposits declined from previously reported levels, to 4,678 million yen from 8,178 million yen. Net assets rose to 42,516 million yen, or 67.3% of total liabilities and net assets, from 39,769 million yen and 64.9% a year earlier. The materials note that cash and deposits are at a level of 0.5 months of monthly sales.
| Item (Millions of Yen) | End-March 2025 | End-March 2026 | Change |
|---|---|---|---|
| Current Assets | 32,987 | 30,726 | (2,261) |
| Cash and Deposits | 8,178 | 4,678 | (3,499) |
| Accounts Receivable – Trade | 17,609 | 18,020 | 411 |
| Inventories | 6,729 | 7,229 | 500 |
| Non-Current Assets | 28,259 | 32,452 | 4,193 |
| Property, Plant and Equipment | 20,491 | 24,340 | 3,848 |
| Total Assets | 61,246 | 63,178 | 1,931 |
| Total Liabilities | 21,477 | 20,662 | (814) |
| Net Assets | 39,769 | 42,516 | 2,746 |
The Western Japan sales location was acquired to strengthen shipping and inventory-holding capacity in response to business expansion in Western Japan. It is located in Nagaotanimachi, Hirakata, Osaka, was acquired in June 2025 for a capital investment of ¥3.201 billion covering land and buildings, has a total floor area of approximately 11,000 sqm, and is scheduled to commence operations in January 2027; it is currently leased by the company to another company.
FY03/27 Forecast
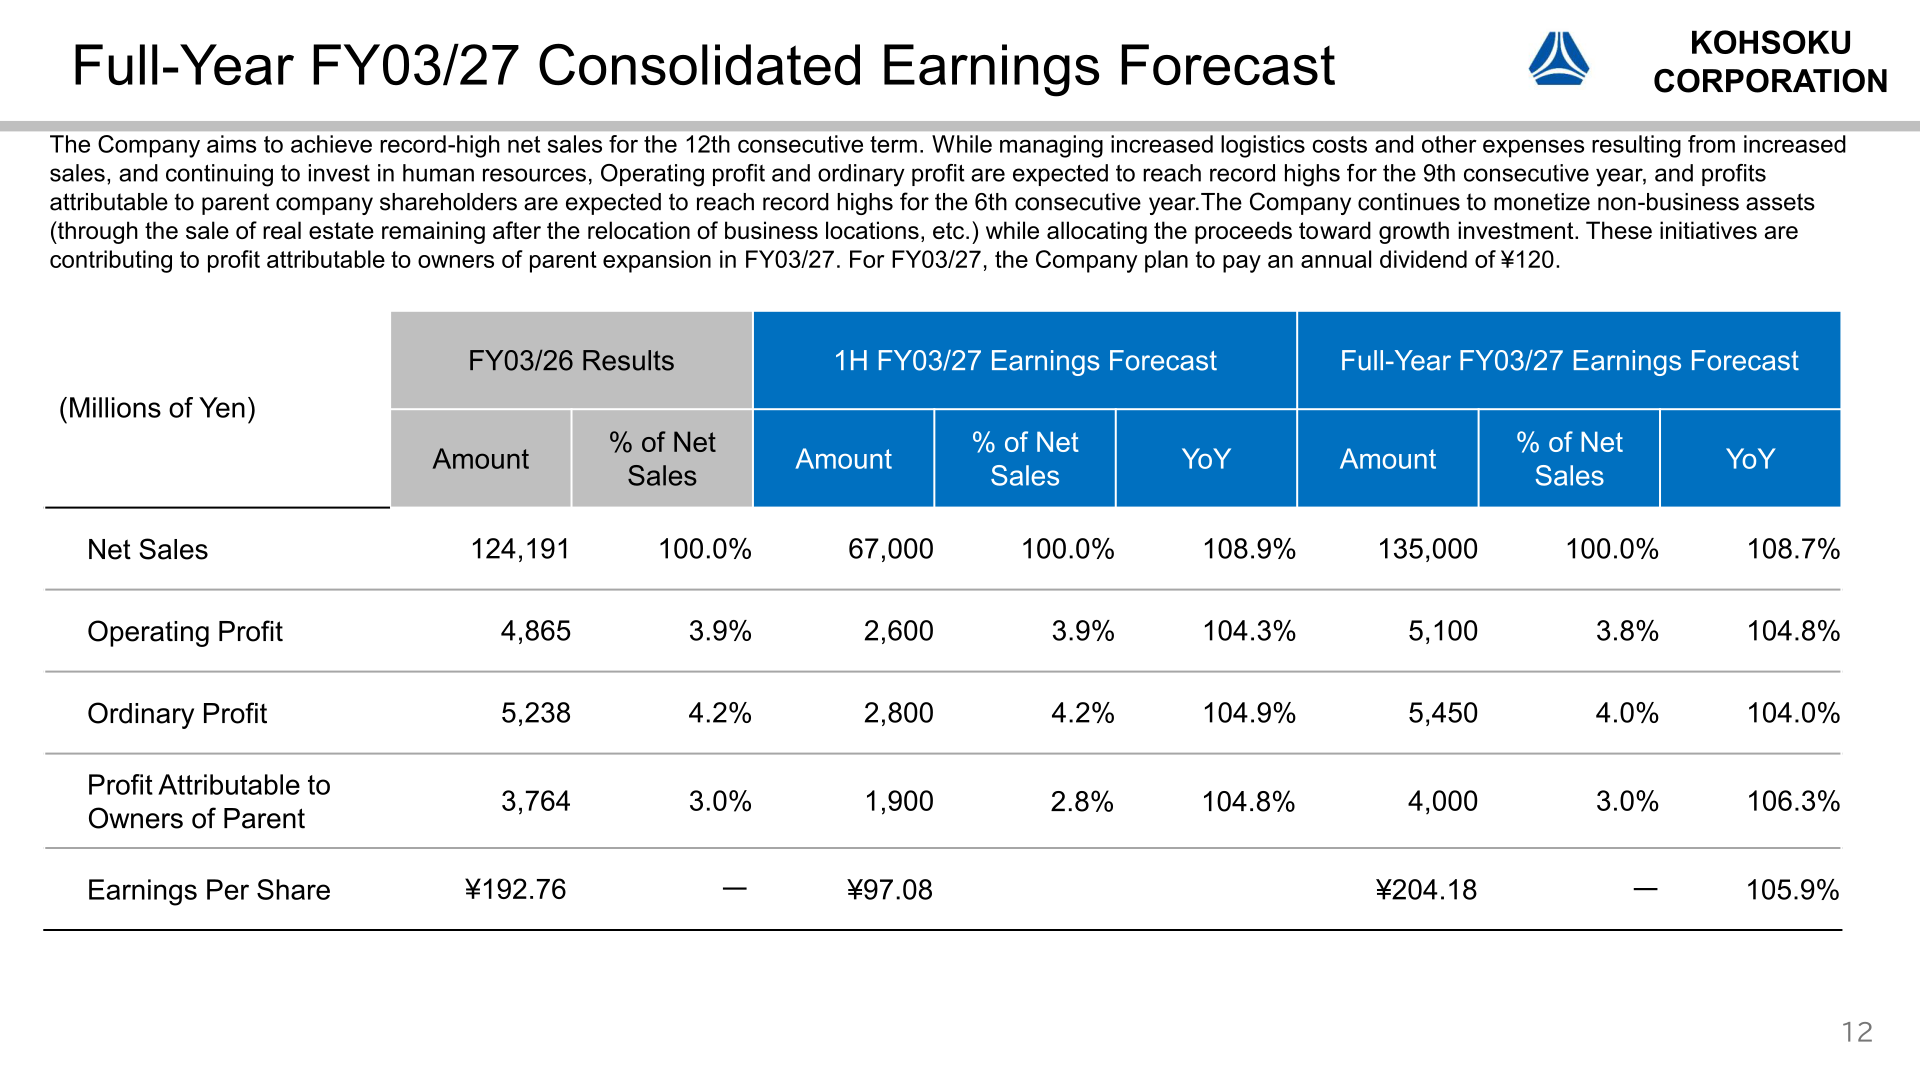
For FY03/27 the company forecasts net sales of 135,000 million yen (108.7% YoY) and profit attributable to owners of parent of 4,000 million yen (106.3% YoY), aiming for record-high net sales for the 12th consecutive term. While managing increased logistics costs and other expenses resulting from increased sales and continuing to invest in human resources, operating profit and ordinary profit are expected to reach record highs for the 9th consecutive year and profit attributable to owners of parent for the 6th consecutive year. The materials add that the company continues to monetize non-business assets, through the sale of real estate remaining after the relocation of business locations and similar actions, while allocating the proceeds toward growth investment, and that these initiatives are contributing to profit attributable to owners of parent expansion in FY03/27.
| Item (Millions of Yen) | FY03/26 Results | 1H FY03/27 Forecast | 1H YoY | Full-Year FY03/27 Forecast | Full-Year YoY |
|---|---|---|---|---|---|
| Net Sales | 124,191 | 67,000 | 108.9% | 135,000 | 108.7% |
| Operating Profit | 4,865 | 2,600 | 104.3% | 5,100 | 104.8% |
| Ordinary Profit | 5,238 | 2,800 | 104.9% | 5,450 | 104.0% |
| Profit Attributable to Owners of Parent | 3,764 | 1,900 | 104.8% | 4,000 | 106.3% |
| Earnings Per Share | ¥192.76 | ¥97.08 | ー | ¥204.18 | 105.9% |
Shareholder Returns
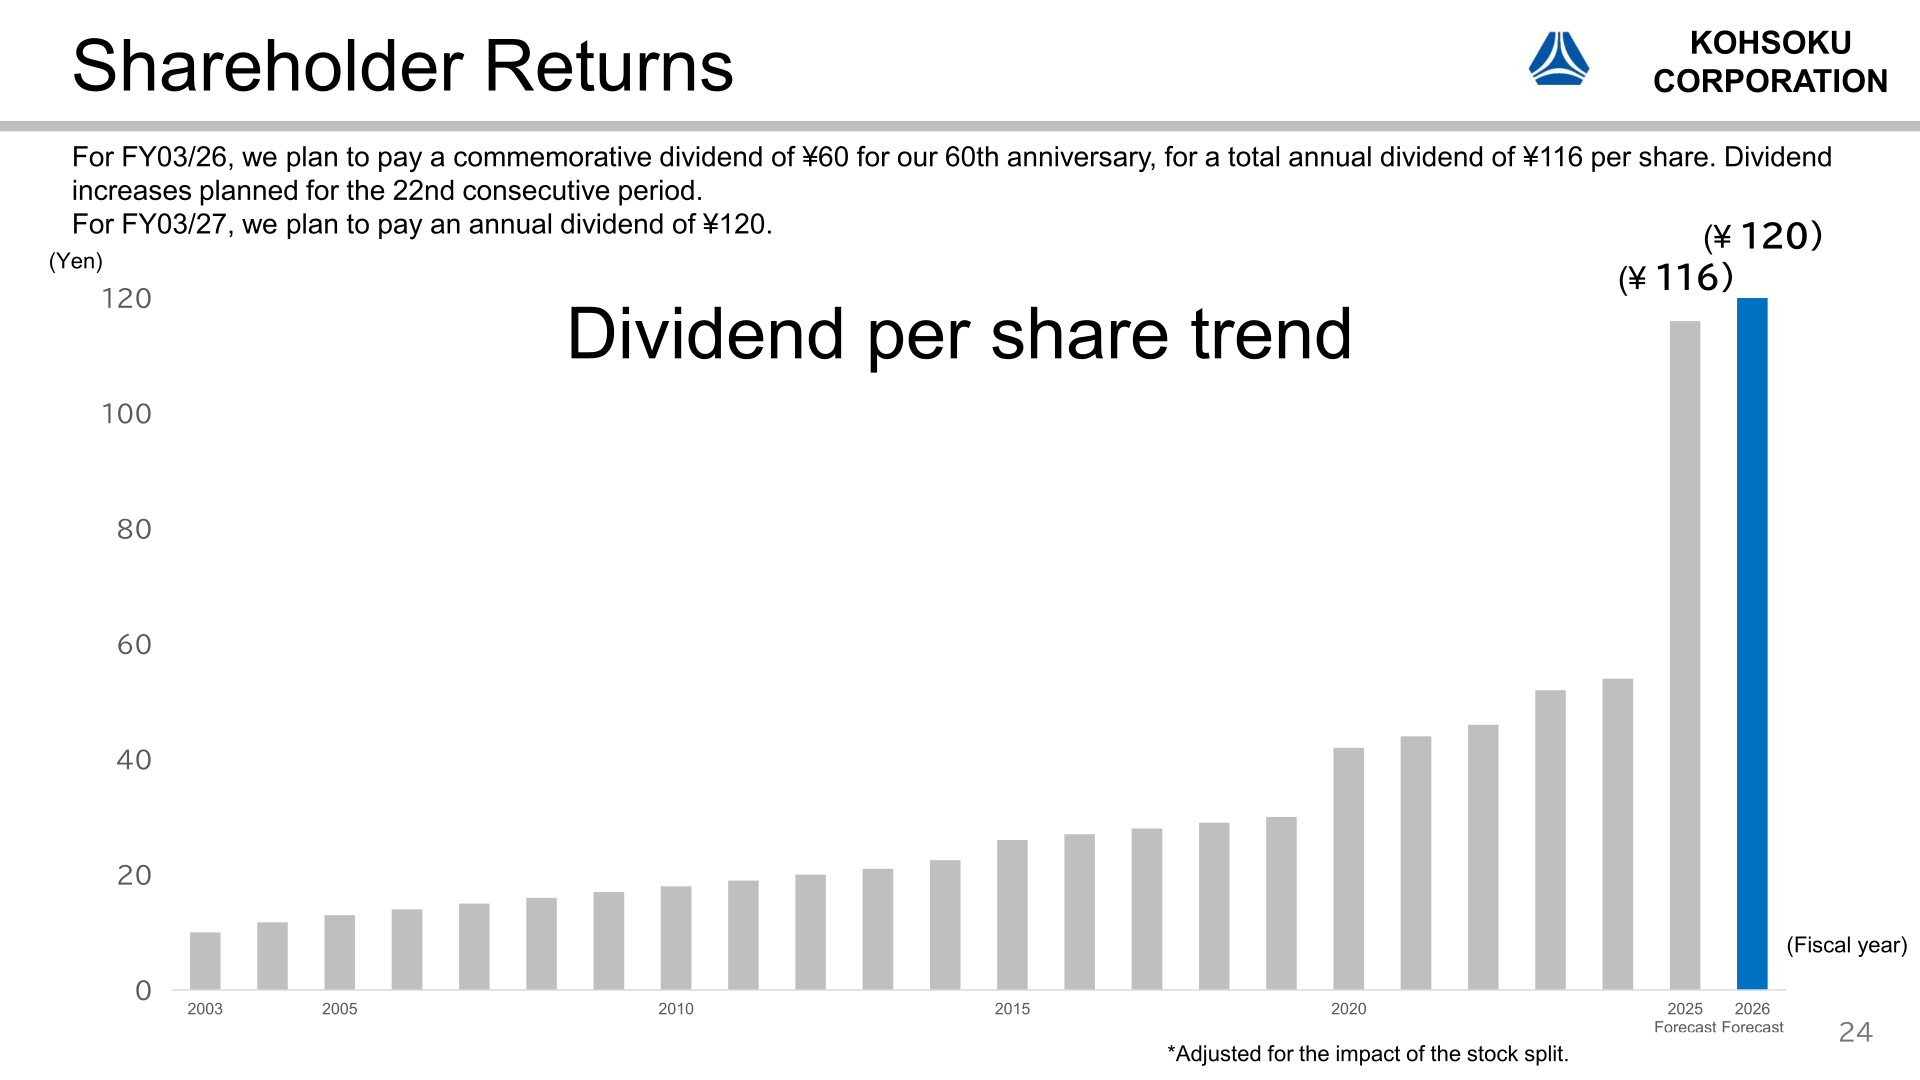
For FY03/26 the company plans to pay a commemorative dividend of ¥60 for its 60th anniversary, for a total annual dividend of ¥116 per share, marking planned dividend increases for the 22nd consecutive period. For FY03/27 the company plans to pay an annual dividend of ¥120. The materials state that earnings per share, which also serves as a source of shareholder returns, has risen from ¥179.11 in FY03/25 to ¥192.76 in FY03/26 and is projected at ¥204.18 for FY03/27, and that the company will continue working to increase it while balancing growth investments and shareholder returns.
TOPIX Constituent Selection and Other Topics
The materials devote a section to revisions to the TOPIX constituent selection rules. Under the next-generation selection criteria, free-float market capitalization is calculated as share price multiplied by the number of listed shares (20,990,920) multiplied by the Free-Float Weight, averaged over each business day in August. For the first TOPIX periodic review in October 2026 the assessment will use the Free-Float Weight indicated by the Annual Securities Report for FY03/25, which for the company is 0.45; for the October 2027 review and re-evaluation it will use the FY03/26 Annual Securities Report figure, which the company expects to be 0.5. The company states it will continue striving to increase its free-float market capitalization and remain a TOPIX constituent.
On external recognition, the company has responded to CDP since 2025 and received a C score in both the Climate Change and Water Security categories, and it has been selected as a constituent of the Nikkei Consecutive Dividend Growth Stock Index for three consecutive years since the index began calculation and publication in 2023.
This article is an analysis based on publicly available information and is not a recommendation to buy or sell any specific securities. Investment decisions are your own responsibility.
















