
This article is based on publicly available IR materials and is not a recommendation to buy or sell any specific securities.
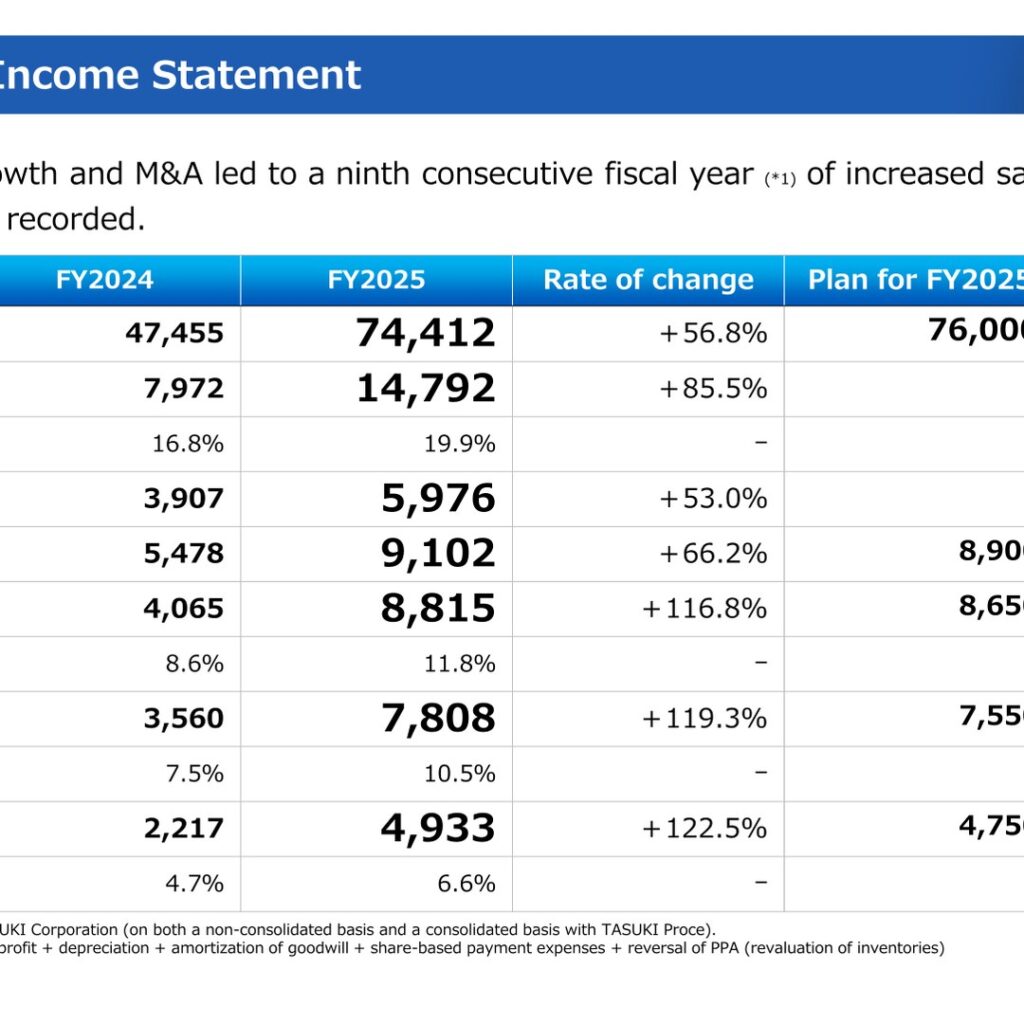
TASUKI Holdings Inc. (TSE Growth Market, Securities Code: 166A) reported net sales of 74,412 million yen for FY2025, the fiscal year ended September 2025, up 56.8% year on year, and operating profit of 8,815 million yen, up 116.8%. The company states that strong business growth and M&A led to a ninth consecutive fiscal year of increased sales and profits, with the highest profits ever recorded. Profit attributable to owners of the parent was 4,933 million yen, up 122.5% and equal to 103.9% of the plan for FY2025. The year-end dividend was set at 36 yen per share, an increase of 1 yen from the initial plan.
Consolidated Results (Full-Year Actual)
Net sales reached 97.9% of the 76,000 million yen plan for FY2025, while every profit line exceeded plan: EBITDA at 102.3%, operating profit at 101.9%, ordinary profit at 103.4% and profit attributable to owners of the parent at 103.9%. Gross profit rose 85.5% to 14,792 million yen and the gross profit margin improved to 19.9% from 16.8%. The operating profit margin rose to 11.8% from 8.6%, and the net profit margin to 6.6% from 4.7%. The footnote to the slide explains that the ninth-consecutive-year comparison is combined with the results of TASUKI Corporation on both a non-consolidated basis and a consolidated basis with TASUKI Proce, and that EBITDA is calculated as operating profit + depreciation + amortization of goodwill + share-based payment expenses + reversal of PPA (revaluation of inventories).
| Item (Millions of yen) | FY2024 | FY2025 | Rate of change | Plan for FY2025 | Achievement Rate |
|---|---|---|---|---|---|
| Net sales | 47,455 | 74,412 | +56.8% | 76,000 | 97.9% |
| Gross profit | 7,972 | 14,792 | +85.5% | – | – |
| Gross profit margin | 16.8% | 19.9% | – | – | – |
| SG&A Expenses | 3,907 | 5,976 | +53.0% | – | – |
| EBITDA | 5,478 | 9,102 | +66.2% | 8,900 | 102.3% |
| Operating profit | 4,065 | 8,815 | +116.8% | 8,650 | 101.9% |
| Operating profit margin | 8.6% | 11.8% | – | – | – |
| Ordinary profit | 3,560 | 7,808 | +119.3% | 7,550 | 103.4% |
| Ordinary profit margin | 7.5% | 10.5% | – | – | – |
| Profit attributable to owners of the parent | 2,217 | 4,933 | +122.5% | 4,750 | 103.9% |
| Net profit margin | 4.7% | 6.6% | – | – | – |
On the balance sheet, total assets grew 40.1% to 83,248 million yen, with cash and deposits up 81.6% to 26,203 million yen and real estate for sale (in process) and advance payments up 27.9% to 46,394 million yen. Net assets increased 50.5% to 33,005 million yen on business growth and equity financing, lifting the equity ratio to 38.3% from 35.9% and keeping it above the 30% KPI level. The company reports ROE of 18.5% for FY2025 against 10.4% for FY2024.
Segment Results
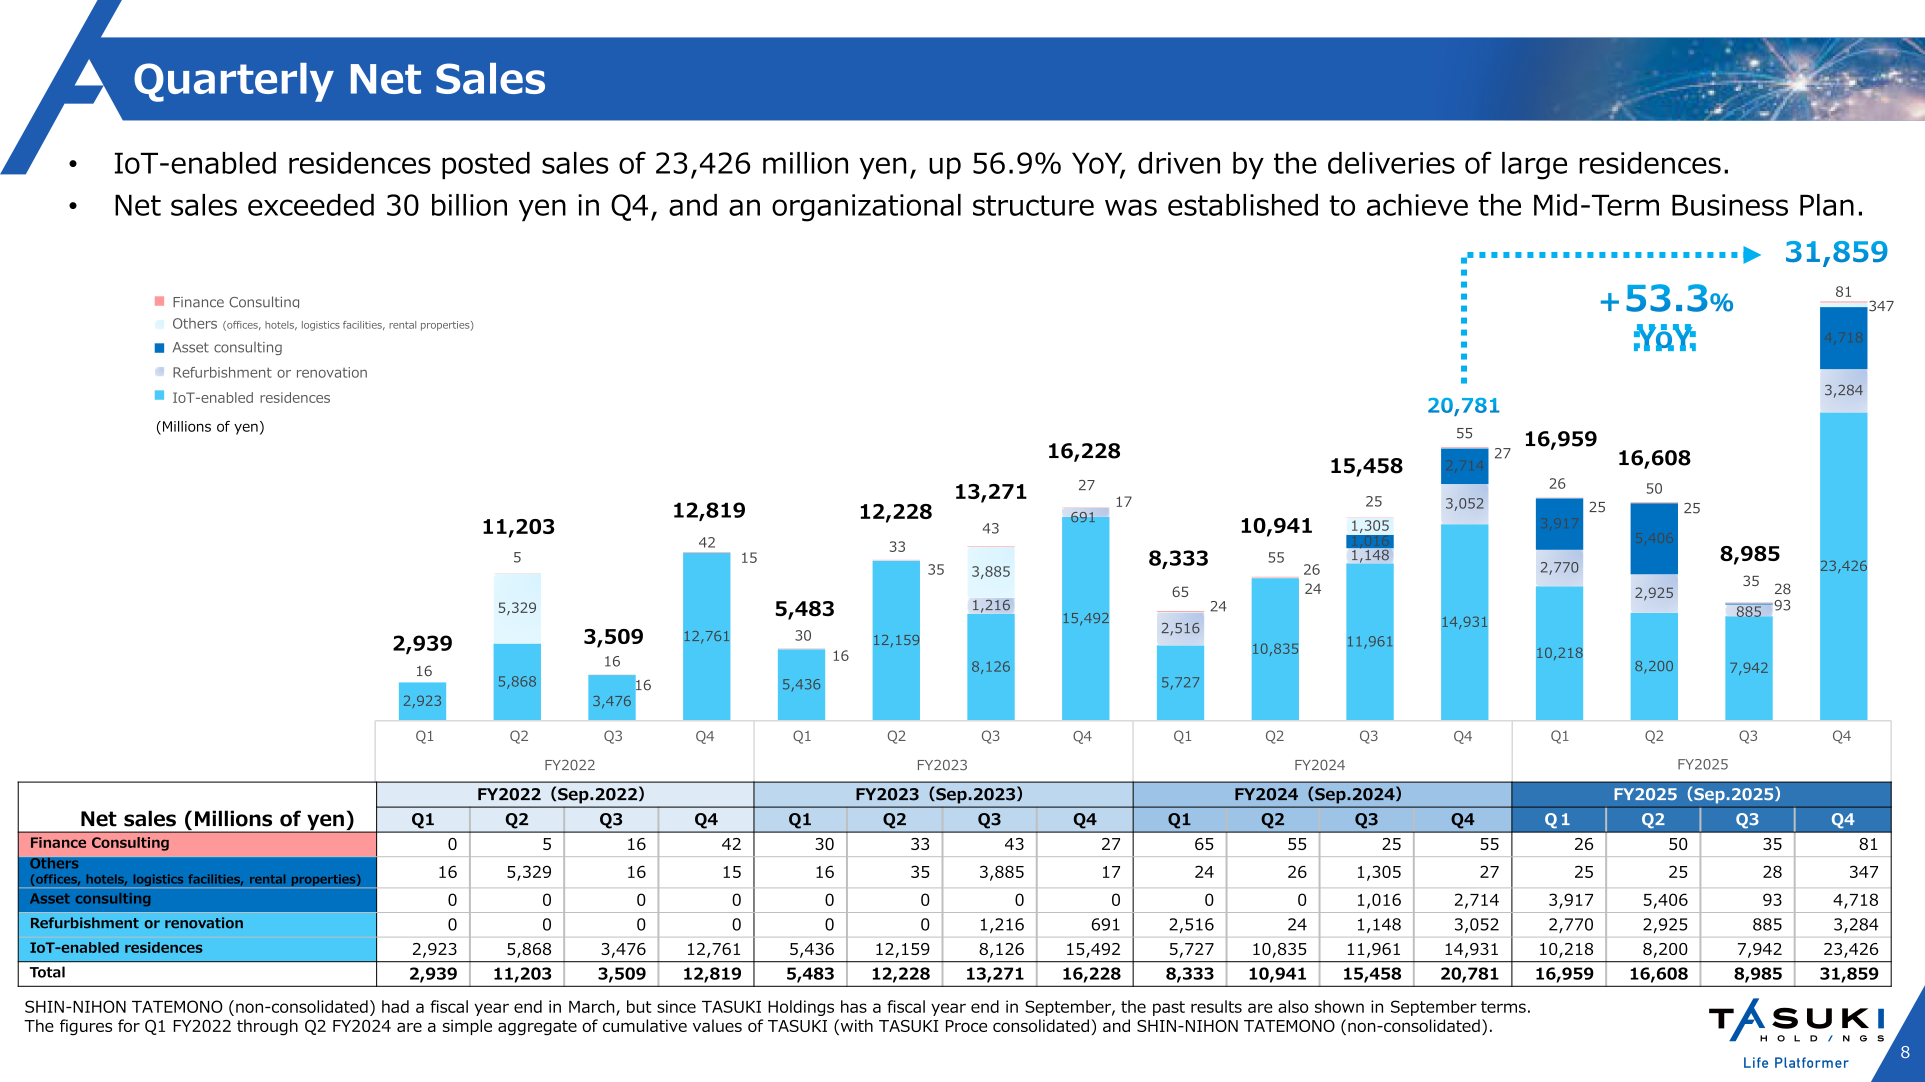
Following the business integration, the group discloses results in the financial results briefing material according to an intermediate classification: IoT-enabled residences, Refurbishment or renovation, Asset consulting, Finance Consulting, and Others (offices, hotels, logistics facilities, rental properties). Fourth-quarter net sales came to 31,859 million yen, up 53.3% year on year, with the company noting that net sales exceeded 30 billion yen in Q4 and that IoT-enabled residences posted Q4 sales of 23,426 million yen, up 56.9% year on year, driven by the deliveries of large residences.
| Net sales (Millions of yen) | FY2025 Q1 | FY2025 Q2 | FY2025 Q3 | FY2025 Q4 |
|---|---|---|---|---|
| IoT-enabled residences | 10,218 | 8,200 | 7,942 | 23,426 |
| Refurbishment or renovation | 2,770 | 2,925 | 885 | 3,284 |
| Asset consulting | 3,917 | 5,406 | 93 | 4,718 |
| Others (offices, hotels, logistics facilities, rental properties) | 25 | 25 | 28 | 347 |
| Finance Consulting | 26 | 50 | 35 | 81 |
| Total | 16,959 | 16,608 | 8,985 | 31,859 |
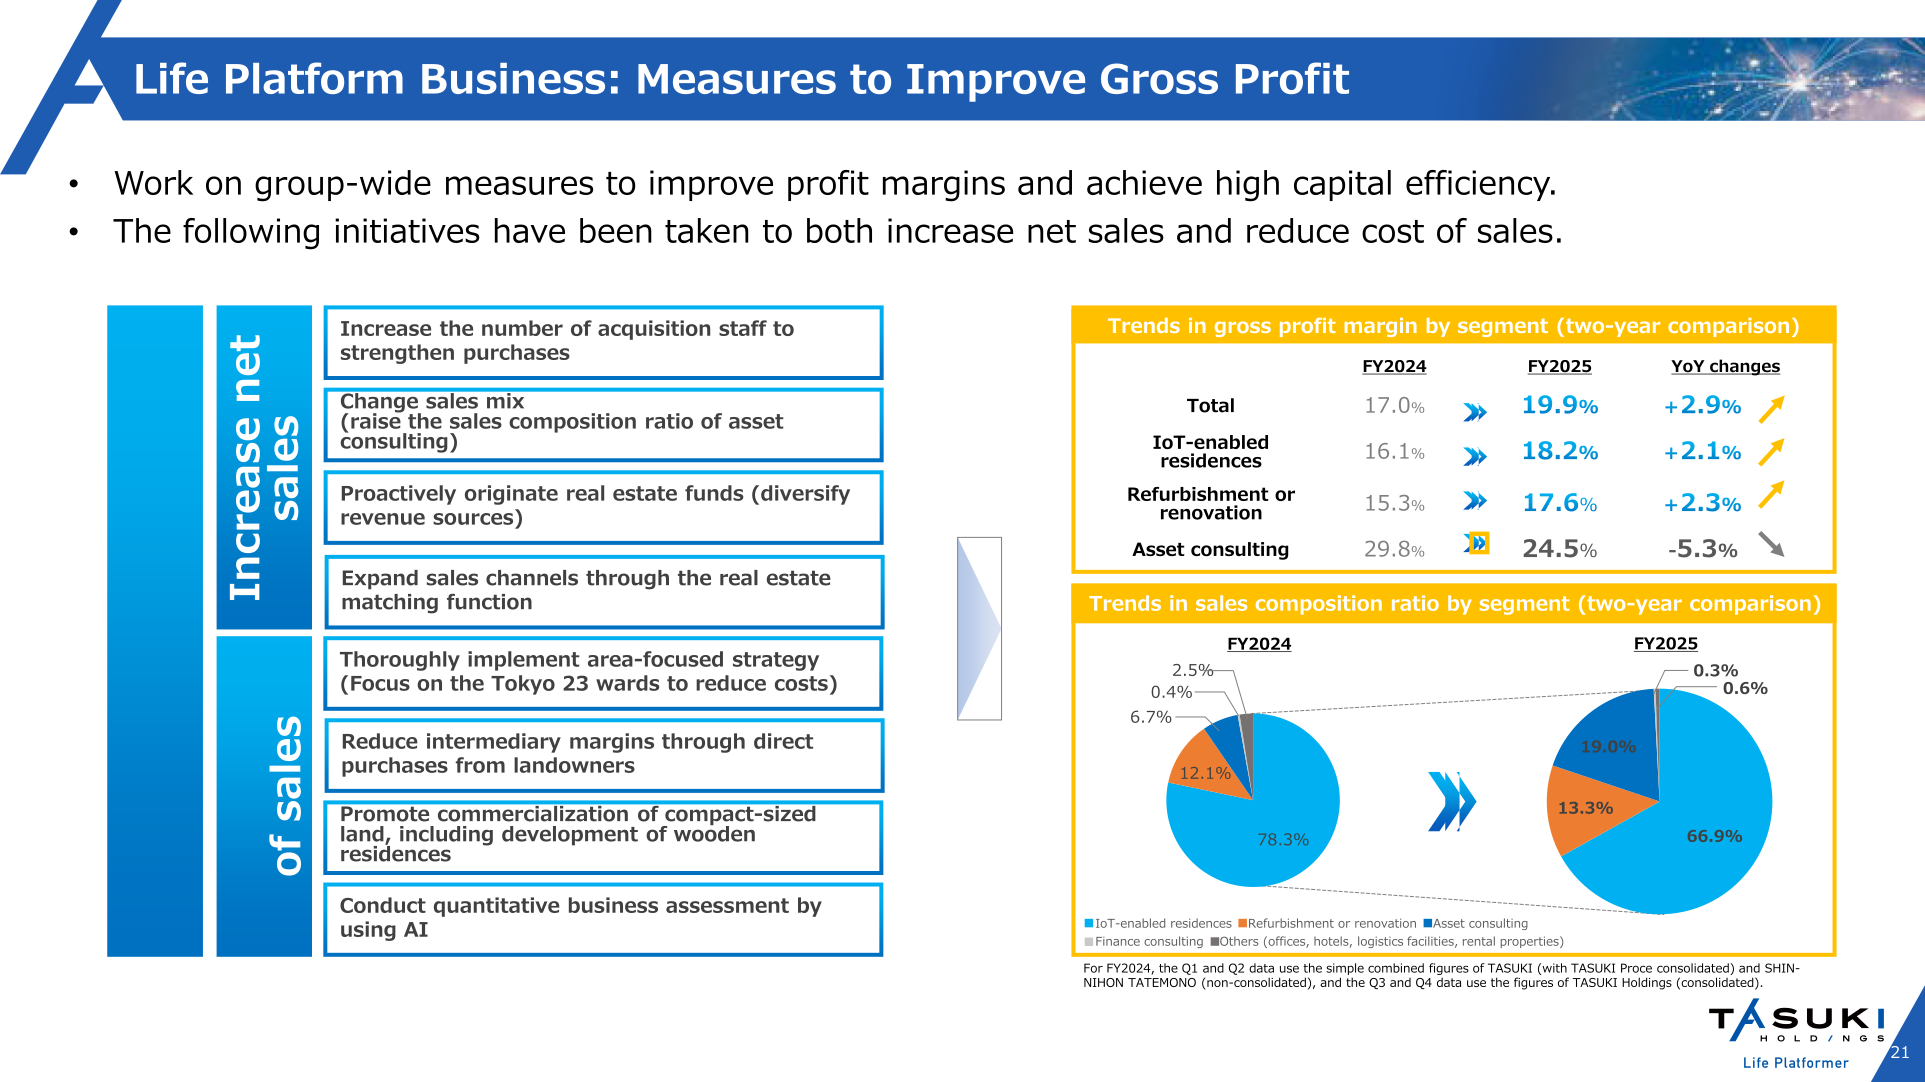
The company links the profit improvement to group-wide measures to raise gross profit margins, including an area-focused strategy centred on the Tokyo 23 wards, direct purchases from landowners to reduce intermediary margins, and a change in the sales mix that raises the composition ratio of asset consulting. The gross profit margin improved year on year in every category except asset consulting.
| Segment | Metric | FY2025 | FY2024 | YoY change |
|---|---|---|---|---|
| Total | Gross profit margin | 19.9% | 17.0% | +2.9% |
| IoT-enabled residences | Gross profit margin | 18.2% | 16.1% | +2.1% |
| Refurbishment or renovation | Gross profit margin | 17.6% | 15.3% | +2.3% |
| Asset consulting | Gross profit margin | 24.5% | 29.8% | -5.3% |
| IoT-enabled residences | Sales composition ratio | 66.9% | 78.3% | – |
| Refurbishment or renovation | Sales composition ratio | 13.3% | 12.1% | – |
| Asset consulting | Sales composition ratio | 19.0% | 6.7% | – |
| Finance consulting | Sales composition ratio | 0.3% | 0.4% | – |
| Others (offices, hotels, logistics facilities, rental properties) | Sales composition ratio | 0.6% | 2.5% | – |
On project sourcing, the company acquired 44 new projects in Q4 for IoT-enabled residences and properties for refurbishment or renovation, totalling 162 for FY2025, an achievement rate of 118.2% against the annual plan of 137. In the SaaS business, the number of companies adopting ZISEDAI LAND reached 231, up 127 year on year and 11 above the FY2025 KPI of 220.
Full-Year Plan for FY2026
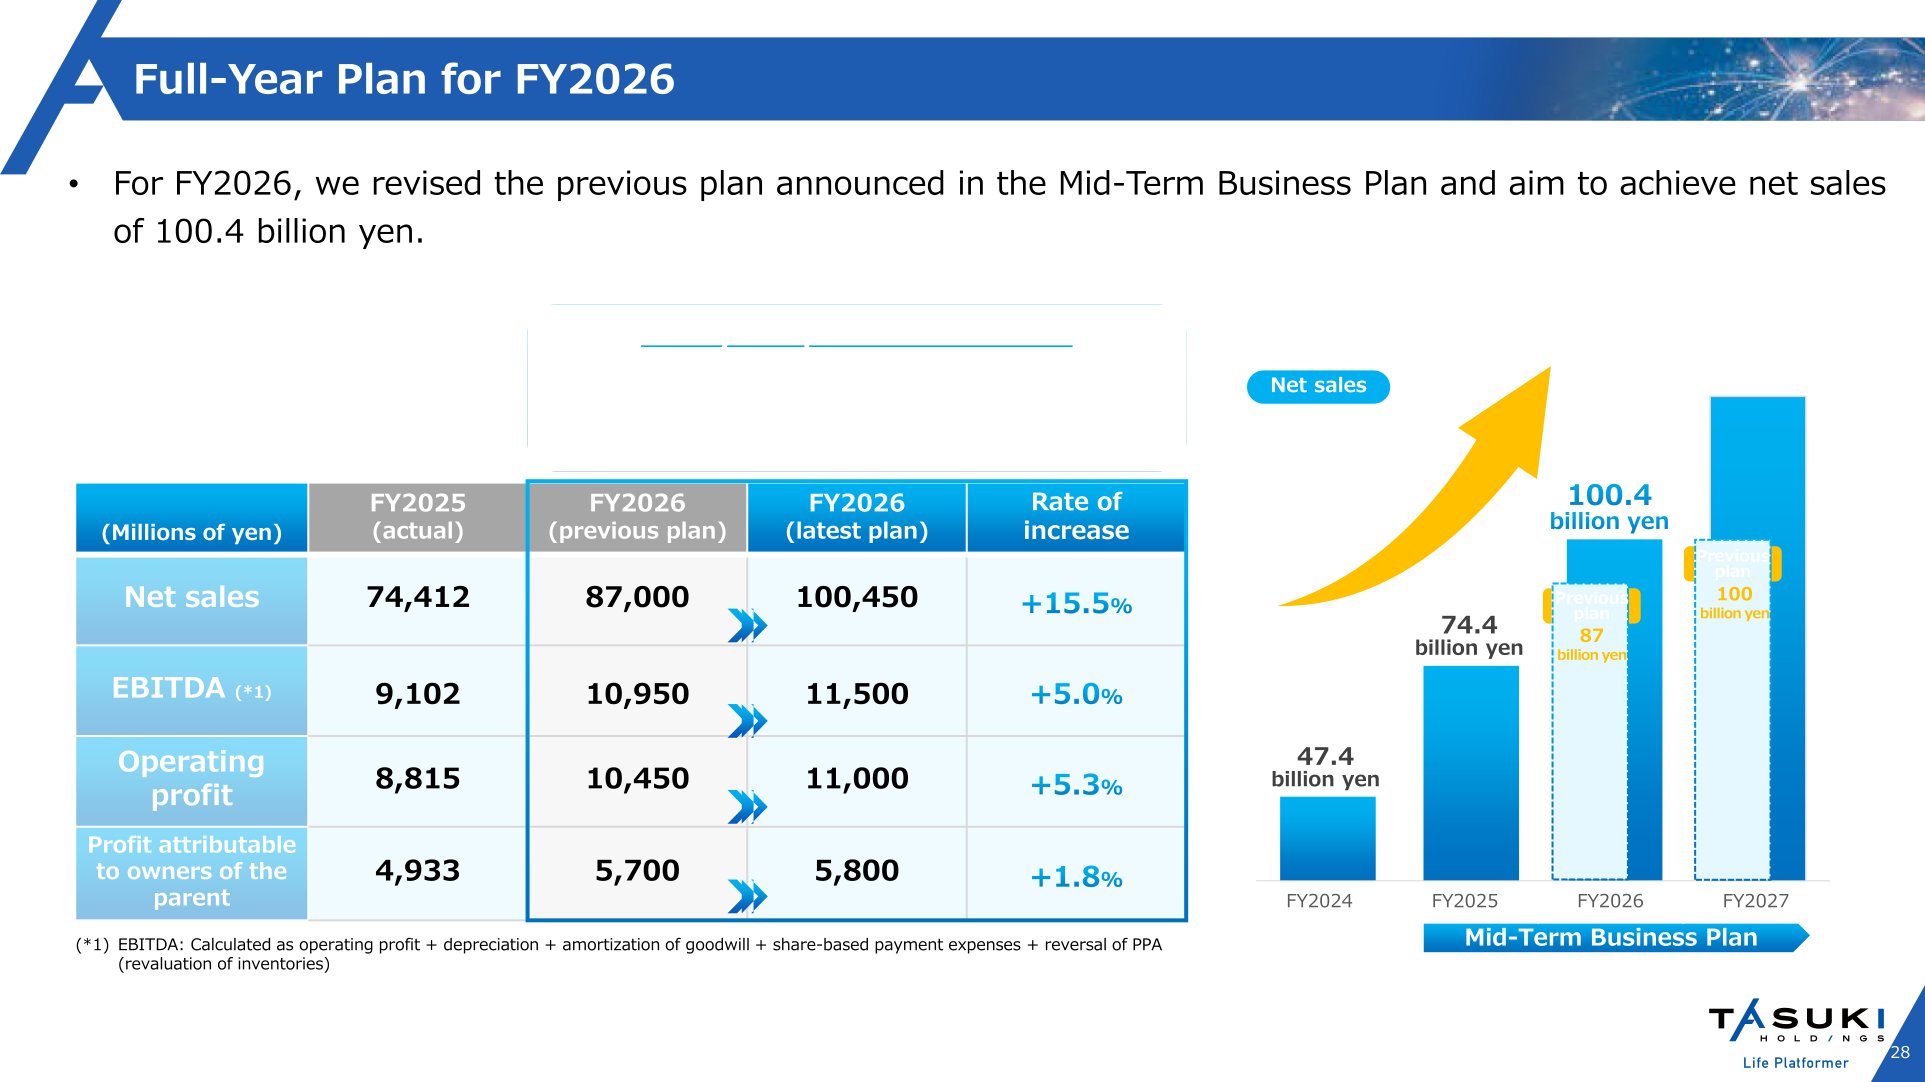
For FY2026, the fiscal year ending September 2026, the company revised upward the previous plan announced in the Mid-Term Business Plan and aims to achieve net sales of 100.4 billion yen. The latest plan puts net sales at 100,450 million yen, EBITDA at 11,500 million yen, operating profit at 11,000 million yen and profit attributable to owners of the parent at 5,800 million yen. The rate of increase shown in the slide compares the latest plan with the previous plan.
| Item (Millions of yen) | FY2025 (actual) | FY2026 (previous plan) | FY2026 (latest plan) | Rate of increase |
|---|---|---|---|---|
| Net sales | 74,412 | 87,000 | 100,450 | +15.5% |
| EBITDA | 9,102 | 10,950 | 11,500 | +5.0% |
| Operating profit | 8,815 | 10,450 | 11,000 | +5.3% |
| Profit attributable to owners of the parent | 4,933 | 5,700 | 5,800 | +1.8% |
Shareholder Returns
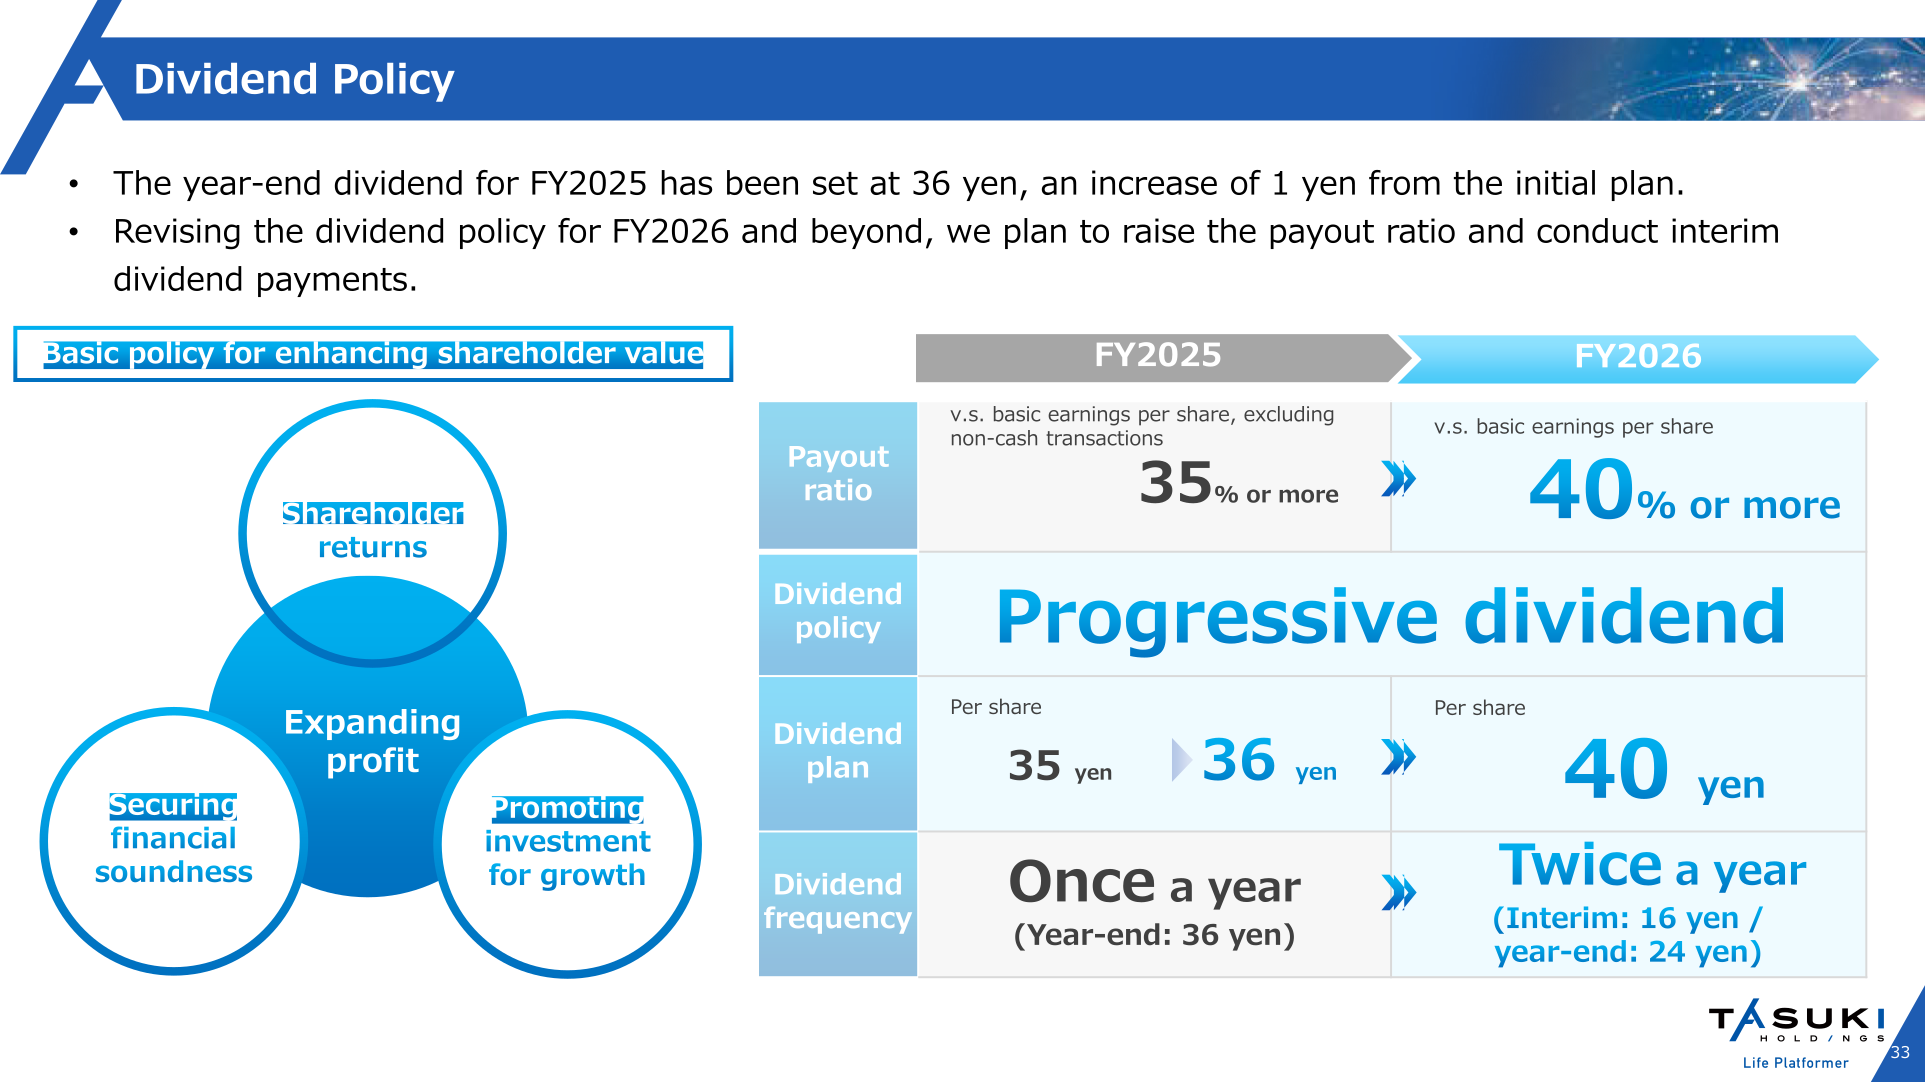
The year-end dividend for FY2025 has been set at 36 yen per share, an increase of 1 yen from the initial plan of 35 yen, reflecting an upside gain in profit. Revising the dividend policy for FY2026 and beyond, the company plans to raise the payout ratio and to conduct interim dividend payments. The FY2025 payout ratio standard was 35% or more measured against basic earnings per share excluding non-cash transactions; from FY2026 the standard becomes 40% or more measured against basic earnings per share. The dividend policy is described as a progressive dividend, and the basic policy for enhancing shareholder value balances shareholder returns, securing financial soundness and promoting investment for growth.
| Item | FY2025 | FY2026 |
|---|---|---|
| Payout ratio | 35% or more (v.s. basic earnings per share, excluding non-cash transactions) | 40% or more (v.s. basic earnings per share) |
| Dividend policy | Progressive dividend | Progressive dividend |
| Dividend plan (per share) | 36 yen | 40 yen |
| Dividend frequency | Once a year (Year-end: 36 yen) | Twice a year (Interim: 16 yen / year-end: 24 yen) |
Mid-Term Business Plan and Long-Term Vision
The Mid-Term Business Plan KPIs for FY2027 target 470 companies adopting the group’s SaaS Business services, up from 104 companies in FY2024 and 231 companies in FY2025; an inventory balance of the Life Platform Business of 80.0 billion yen, described as more than double the FY2024 level, against 36.2 billion yen in FY2024 and 46.3 billion yen in FY2025; and an EBITDA growth rate (CAGR) raised from over 35% to over 40%. The financial KPIs for the FY2027 plan are EPS of 140.00 yen, against 53.39 yen in FY2024 and 90.99 yen in FY2025, ROE of 20% or more, against 10.4% in FY2024 and 18.5% in FY2025, and an equity ratio of 30% or more. EPS is calculated using the number of shares outstanding at the end of FY2025, excluding treasury shares. Beyond the Mid-Term Business Plan, the Long-Term Vision targets net sales of 200 billion yen in FY2033.
The materials also cover the group’s progress toward upgrading to the Tokyo Stock Exchange Prime Market, with a preparation period for the review running through FY2026, and the launch of a vacant house revitalization business at TASUKI Partners Inc. alongside the existing IoT-enabled residences and asset consulting approaches to the vacant house market.
This article is an analysis based on publicly available information and is not a recommendation to buy or sell any specific securities. Investment decisions are your own responsibility.
![[Obayashi] Investors’ Guide 2026 — The Complete 24-Article Breakdown](https://japan-equity.com/wp-content/uploads/2026/07/hub_cover-1024x1024.png)
![[Obayashi] IR & SR Policy — Feeding Dialogue Back into Management](https://japan-equity.com/wp-content/uploads/2026/07/p32_sq-1024x1024.jpg)
![[Obayashi] Real Estate Development — 18.7% Margin, ¥287.7bn Unrealized Gains](https://japan-equity.com/wp-content/uploads/2026/07/p20_sq-1024x1024.jpg)
![[Obayashi] Domestic Civil Engineering — Resilience Spending Supports 9.6% Margin](https://japan-equity.com/wp-content/uploads/2026/07/p11_sq-1024x1024.jpg)
![[Obayashi] Share Price & External Ratings — vs TOPIX, ESG Index Inclusion](https://japan-equity.com/wp-content/uploads/2026/07/p40_sq-1024x1024.jpg)
![[Construction] ¥75.5tn Investment, Shrinking Workforce — Big-5 Market Share](https://japan-equity.com/wp-content/uploads/2026/07/p12_sq-1024x1024.jpg)



![[Obayashi] Capital Policy & Shareholder Returns — ROE 10%+, DOE ~5%, ¥100bn Buyback](https://japan-equity.com/wp-content/uploads/2026/07/p27_sq-1024x1024.jpg)
![[Obayashi] Reducing Cross-Shareholdings — ¥285.2bn Sold in Five Years](https://japan-equity.com/wp-content/uploads/2026/07/p29_sq-1024x1024.jpg)
![[Obayashi] ¥750bn Investment Plan — ¥300bn to Development, ¥190bn to Tech/DX](https://japan-equity.com/wp-content/uploads/2026/07/p30_sq-1024x1024.jpg)
![[Obayashi] MTP2022 KPIs — Operating Profit ~2x Target, ROE 14.4%](https://japan-equity.com/wp-content/uploads/2026/07/p25_sq-1024x1024.jpg)
![[Obayashi] Cash Allocation — ¥420bn Investment CF Over Five Years](https://japan-equity.com/wp-content/uploads/2026/07/p26_sq-1024x1024.jpg)
![[Obayashi] Green Energy — 44 Plants, 344MW, and the Green Hydrogen Challenge](https://japan-equity.com/wp-content/uploads/2026/07/p21_sq-1024x1024.jpg)
![[Obayashi] Tackling the Labor Shortage — Robotics Construction®](https://japan-equity.com/wp-content/uploads/2026/07/p14_sq-1024x1024.jpg)
