
This article is based on publicly available IR materials and is not a recommendation to buy or sell any specific securities.
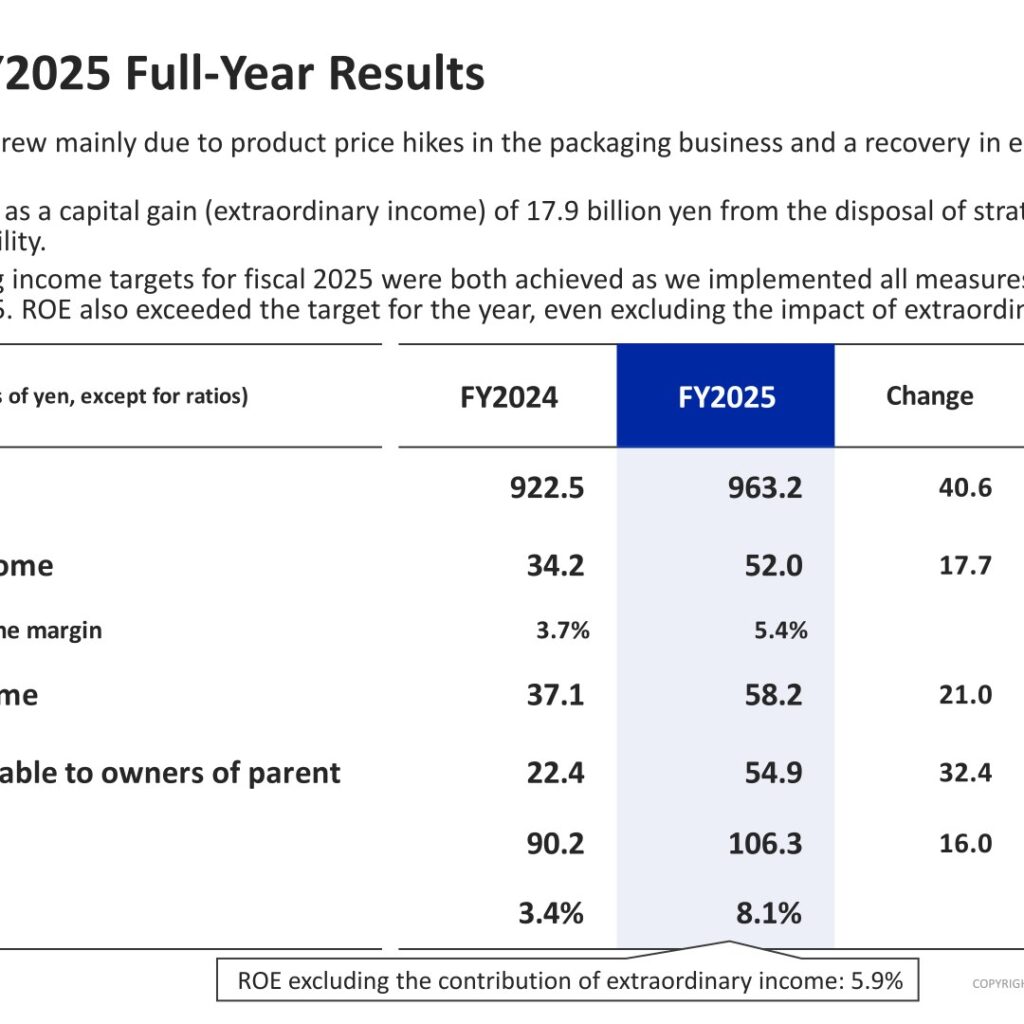
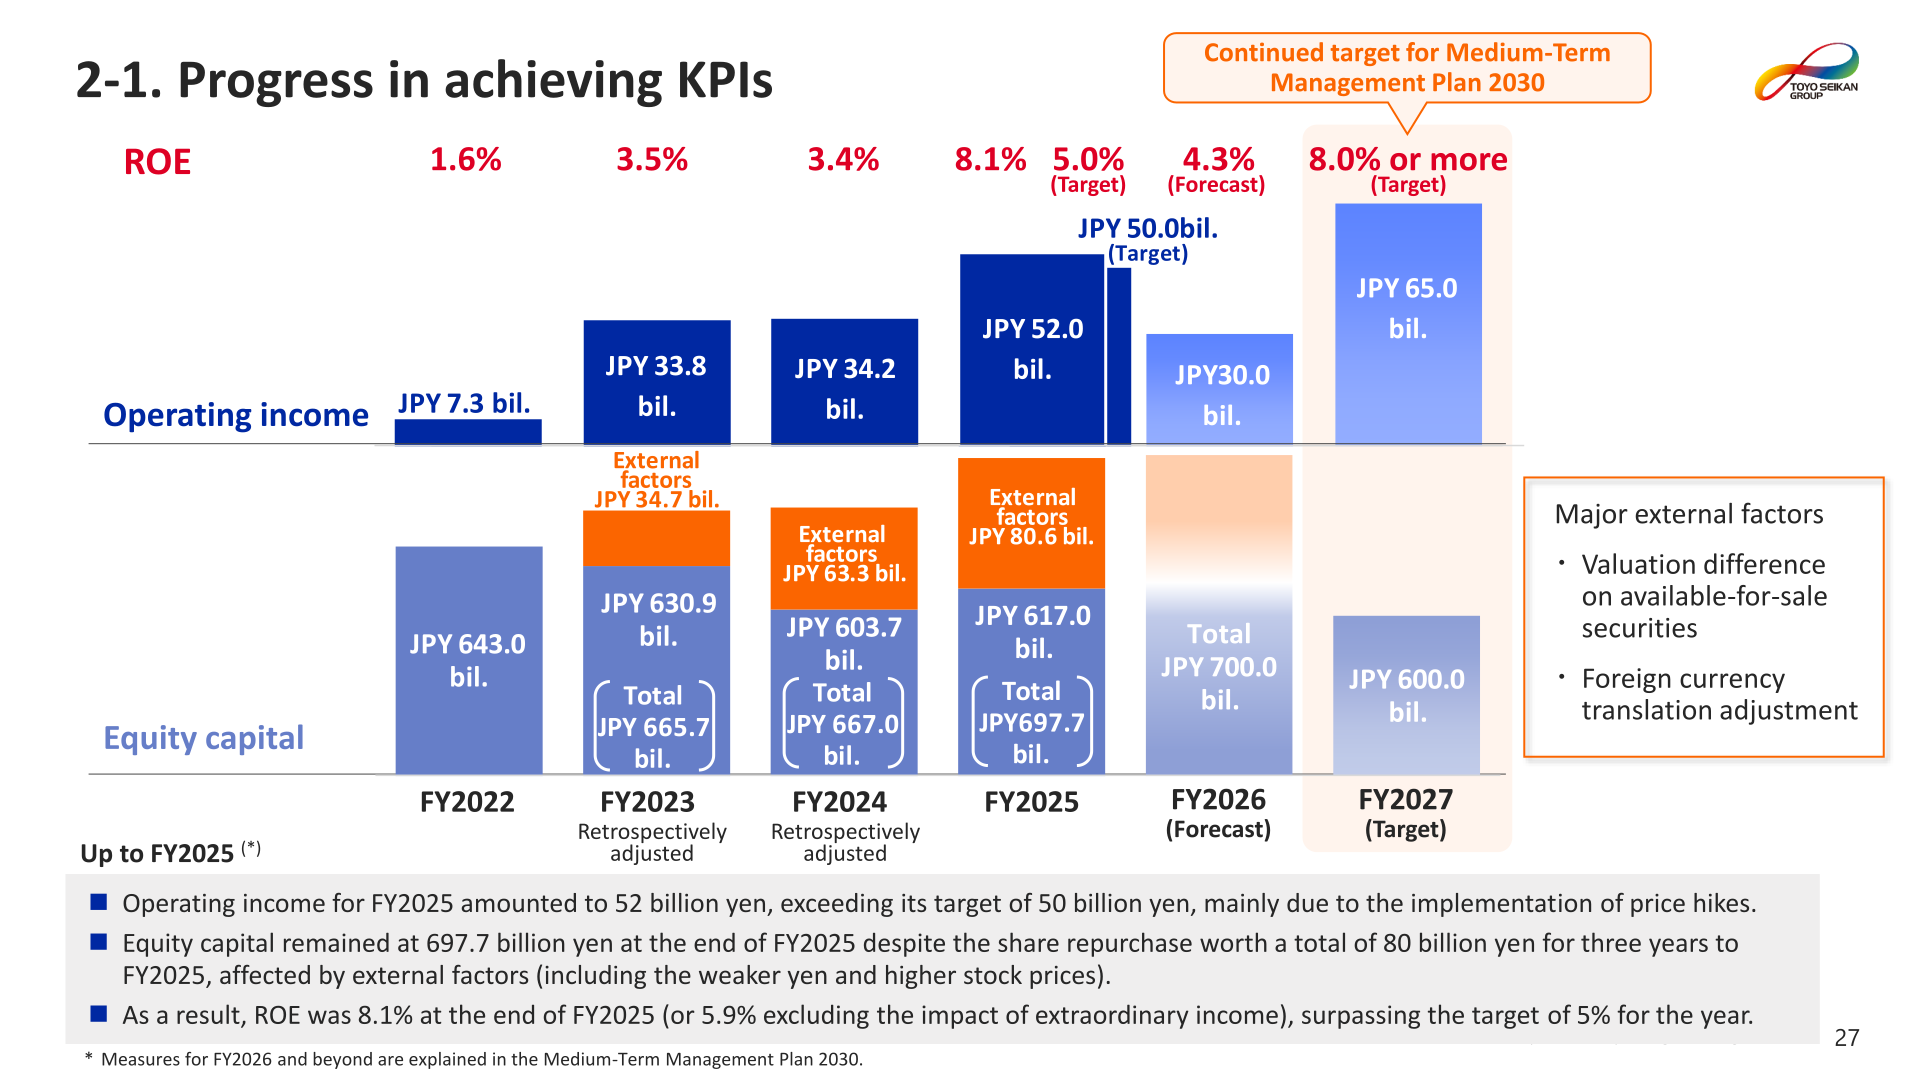
Toyo Seikan Group Holdings, Ltd. reported net sales of 963.2 billion yen for FY2025 (from April 2025 to March 2026), up 40.6 billion yen or 4.4% year on year, while operating income rose 17.7 billion yen or 51.8% to 52.0 billion yen. Profit attributable to owners of parent increased 144.5% to 54.9 billion yen, and ROE improved to 8.1% from 3.4%. The company states that both sales and profits grew mainly due to product price hikes in the packaging business and a recovery in engineering operations in North America. For FY2026 the company forecasts higher net sales of 1,030.0 billion yen but lower operating income of 30.0 billion yen. All yen amounts in the source document are rounded down to the nearest hundred million yen.
Consolidated Results (Full-Year Actual)
Ordinary income rose 21.0 billion yen or 56.7% to 58.2 billion yen and EBITDA rose 16.0 billion yen or 17.8% to 106.3 billion yen. ROE increased to 8.1%, as a capital gain (extraordinary income) of 17.9 billion yen from the disposal of strategic shareholdings also contributed to profitability; ROE excluding the contribution of extraordinary income was 5.9%. The company states that the sales and operating income targets for fiscal 2025 were both achieved as it implemented all measures set in the Medium-Term Management Plan 2025, and that ROE also exceeded the target for the year even excluding the impact of extraordinary income. The accounting of a business consolidation that was provisionally recorded in the consolidated financial statements for fiscal 2024 was finalized in the first quarter of fiscal 2025, and the finalized accounts have been reflected in the amounts for fiscal 2024.
| Item (in billions of yen, except for ratios) | FY2024 | FY2025 | Change | %Change |
|---|---|---|---|---|
| Net sales | 922.5 | 963.2 | 40.6 | 4.4% |
| Operating income | 34.2 | 52.0 | 17.7 | 51.8% |
| Operating income margin | 3.7% | 5.4% | ||
| Ordinary income | 37.1 | 58.2 | 21.0 | 56.7% |
| Profit attributable to owners of parent | 22.4 | 54.9 | 32.4 | 144.5% |
| EBITDA | 90.2 | 106.3 | 16.0 | 17.8% |
| ROE | 3.4% | 8.1% |
By region, Japan recorded net sales of 777.3 billion yen (FY2024: 772.6 billion yen) and operating income of 41.6 billion yen (32.6 billion yen); Asia recorded 96.2 billion yen (83.0 billion yen) and 12.8 billion yen (9.8 billion yen); and the U.S. and other regions recorded 89.6 billion yen (66.8 billion yen) and an operating loss of 2.5 billion yen (loss of 8.5 billion yen). On the balance sheet, total assets stood at 1,240.6 billion yen as of March 31, 2026 versus 1,202.9 billion yen a year earlier, and equity capital was 697.7 billion yen versus 667.0 billion yen.
Segment Results
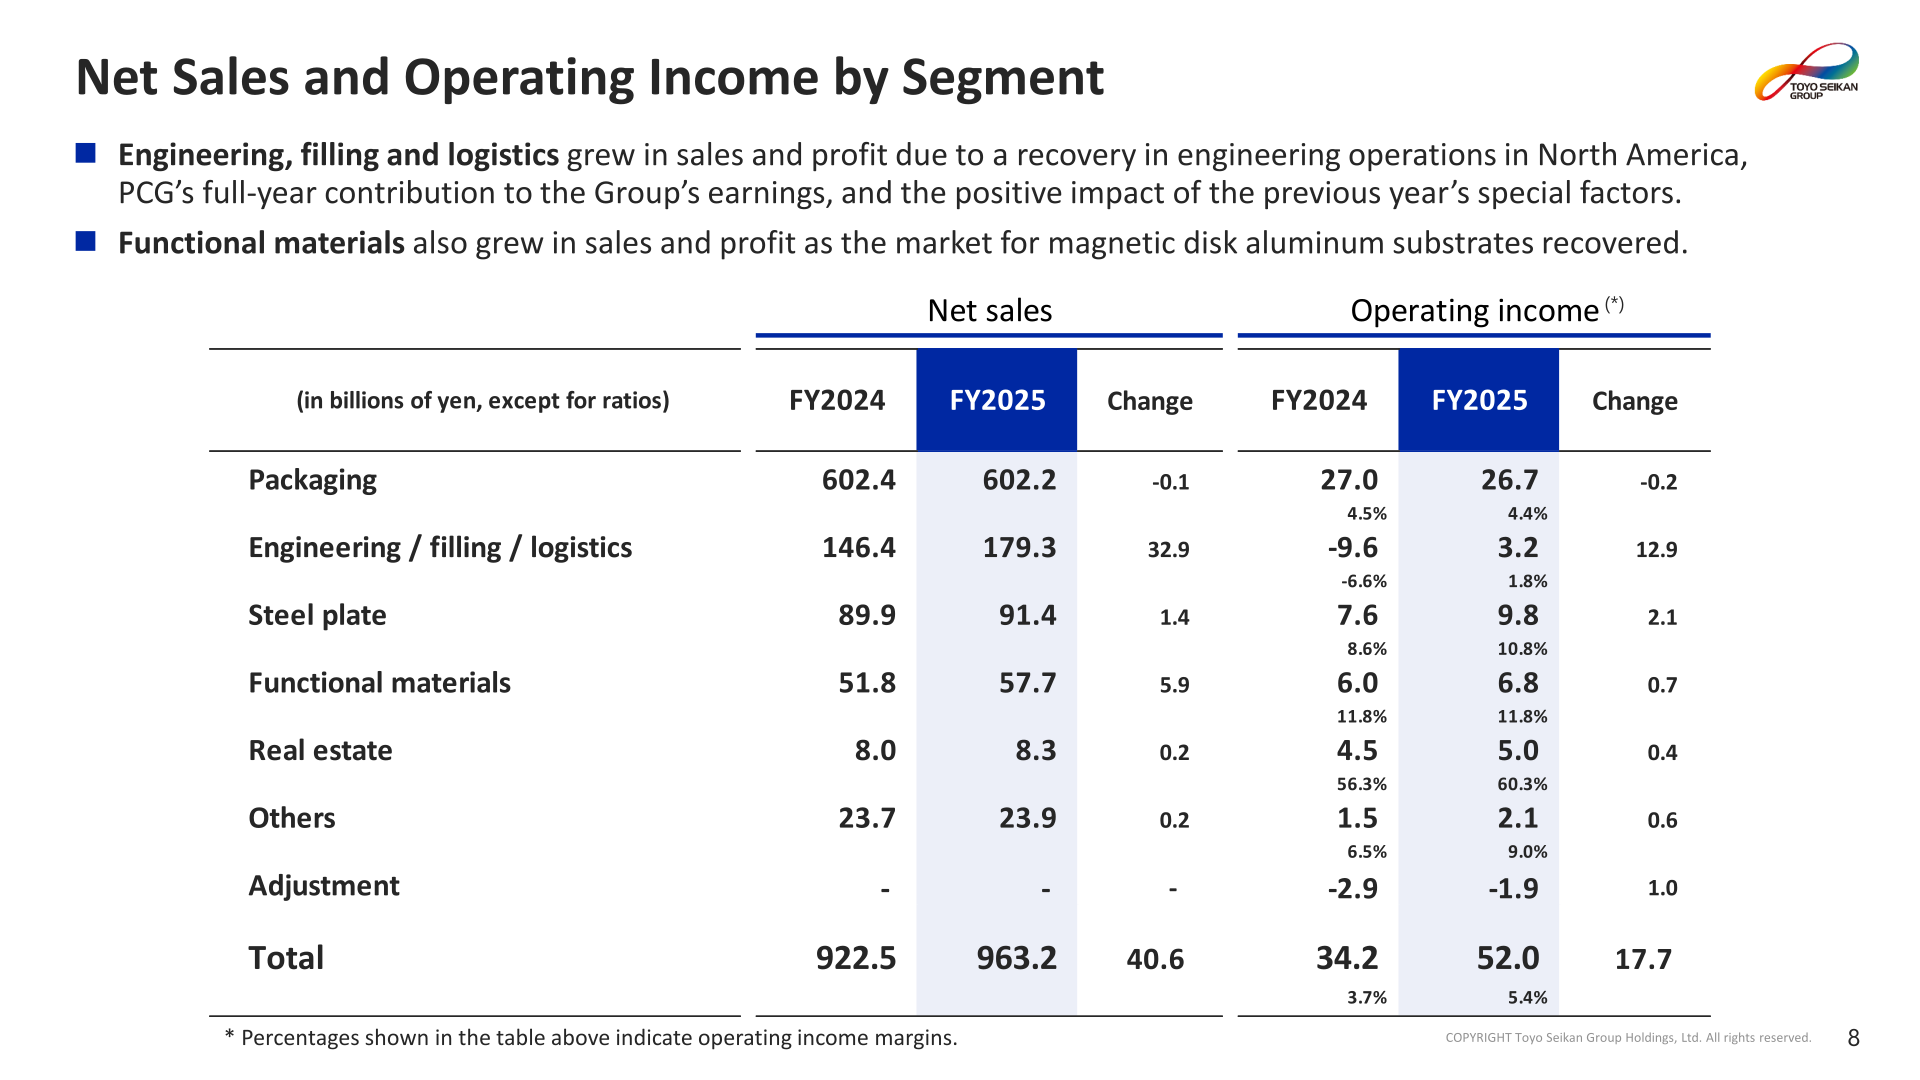
Engineering, filling and logistics grew in sales and profit due to a recovery in engineering operations in North America, the full-year contribution of PREMIER CENTRE GROUP SDN. BHD. (PCG) to the Group’s earnings, and the positive impact of the previous year’s special factors. Functional materials also grew in sales and profit as the market for magnetic disk aluminum substrates recovered. Percentages shown in the source table indicate operating income margins.
| Segment (in billions of yen) | Net sales FY2024 | Net sales FY2025 | Change | Operating income FY2024 | Operating income FY2025 | Change |
|---|---|---|---|---|---|---|
| Packaging | 602.4 | 602.2 | -0.1 | 27.0 | 26.7 | -0.2 |
| Engineering / filling / logistics | 146.4 | 179.3 | 32.9 | -9.6 | 3.2 | 12.9 |
| Steel plate | 89.9 | 91.4 | 1.4 | 7.6 | 9.8 | 2.1 |
| Functional materials | 51.8 | 57.7 | 5.9 | 6.0 | 6.8 | 0.7 |
| Real estate | 8.0 | 8.3 | 0.2 | 4.5 | 5.0 | 0.4 |
| Others | 23.7 | 23.9 | 0.2 | 1.5 | 2.1 | 0.6 |
| Adjustment | – | – | – | -2.9 | -1.9 | 1.0 |
| Total | 922.5 | 963.2 | 40.6 | 34.2 | 52.0 | 17.7 |
FY2026 Forecast
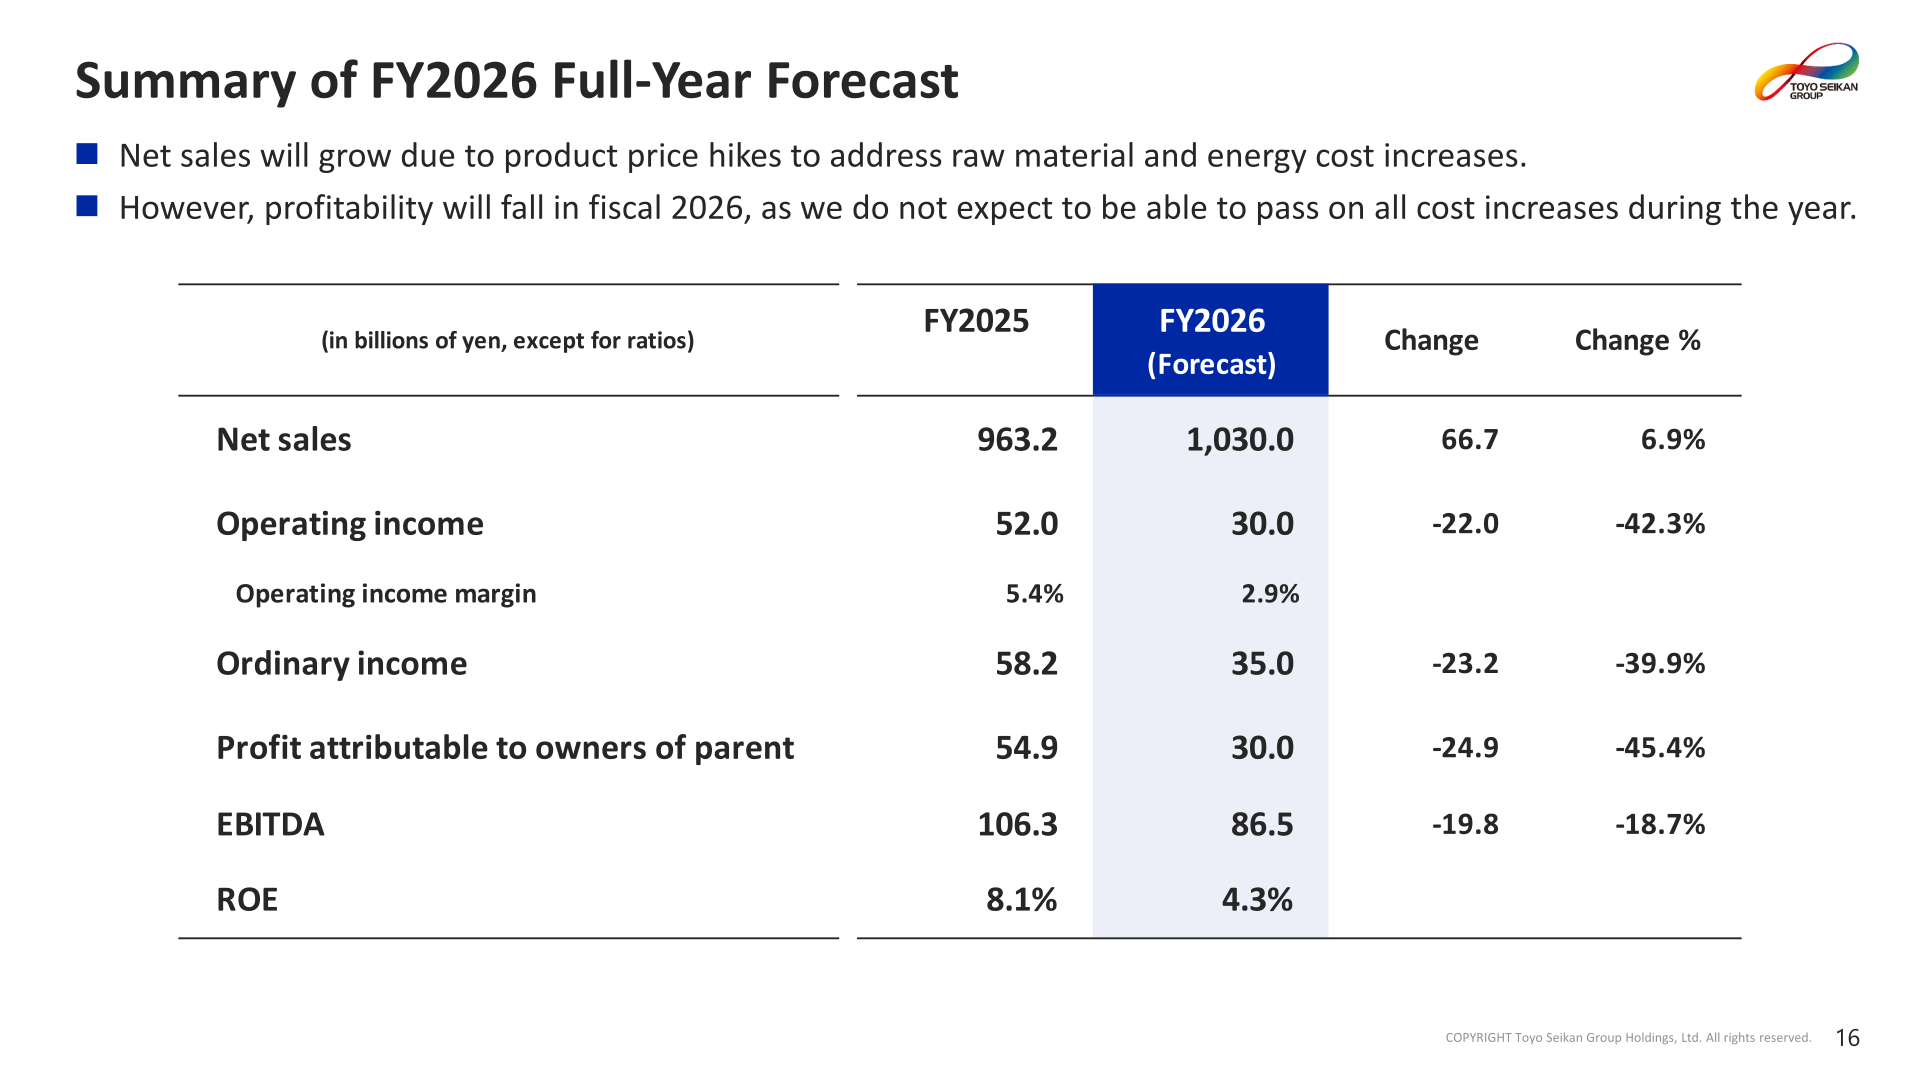
The company forecasts that net sales will grow due to product price hikes to address raw material and energy cost increases, but that profitability will fall in fiscal 2026 as it does not expect to be able to pass on all cost increases during the year. The forecast takes account of surges in raw material and energy prices and the possible impact of the ongoing conflict in the Middle East, based on price levels assumed from information available as of April 30, 2026; supply chain disruptions and a decline in consumer confidence are identified as risks but are not factored into the forecast. In the operating income bridge the company shows a negative impact of 13.5 billion yen from the Middle East conflict. Expected capital investment for FY2026 is 70.0 billion yen and depreciation 56.5 billion yen, against FY2025 capital investment of 54.8 billion yen and depreciation of 53.9 billion yen.
| Item (in billions of yen, except for ratios) | FY2025 | FY2026 (Forecast) | Change | %Change |
|---|---|---|---|---|
| Net sales | 963.2 | 1,030.0 | 66.7 | 6.9% |
| Operating income | 52.0 | 30.0 | -22.0 | -42.3% |
| Operating income margin | 5.4% | 2.9% | ||
| Ordinary income | 58.2 | 35.0 | -23.2 | -39.9% |
| Profit attributable to owners of parent | 54.9 | 30.0 | -24.9 | -45.4% |
| EBITDA | 106.3 | 86.5 | -19.8 | -18.7% |
| ROE | 8.1% | 4.3% |
By segment, the company forecasts that packaging will see higher sales but lower operating income due to the impact of the Middle East conflict, with net sales of 625.0 billion yen and operating income of 8.5 billion yen, while engineering, filling and logistics will record higher sales and operating income of 207.0 billion yen and 5.5 billion yen due to sales expansion in engineering operations in North America. Steel plate is forecast at 98.0 billion yen in sales and 6.5 billion yen in operating income, and functional materials at 64.5 billion yen and 7.0 billion yen.
Shareholder Returns
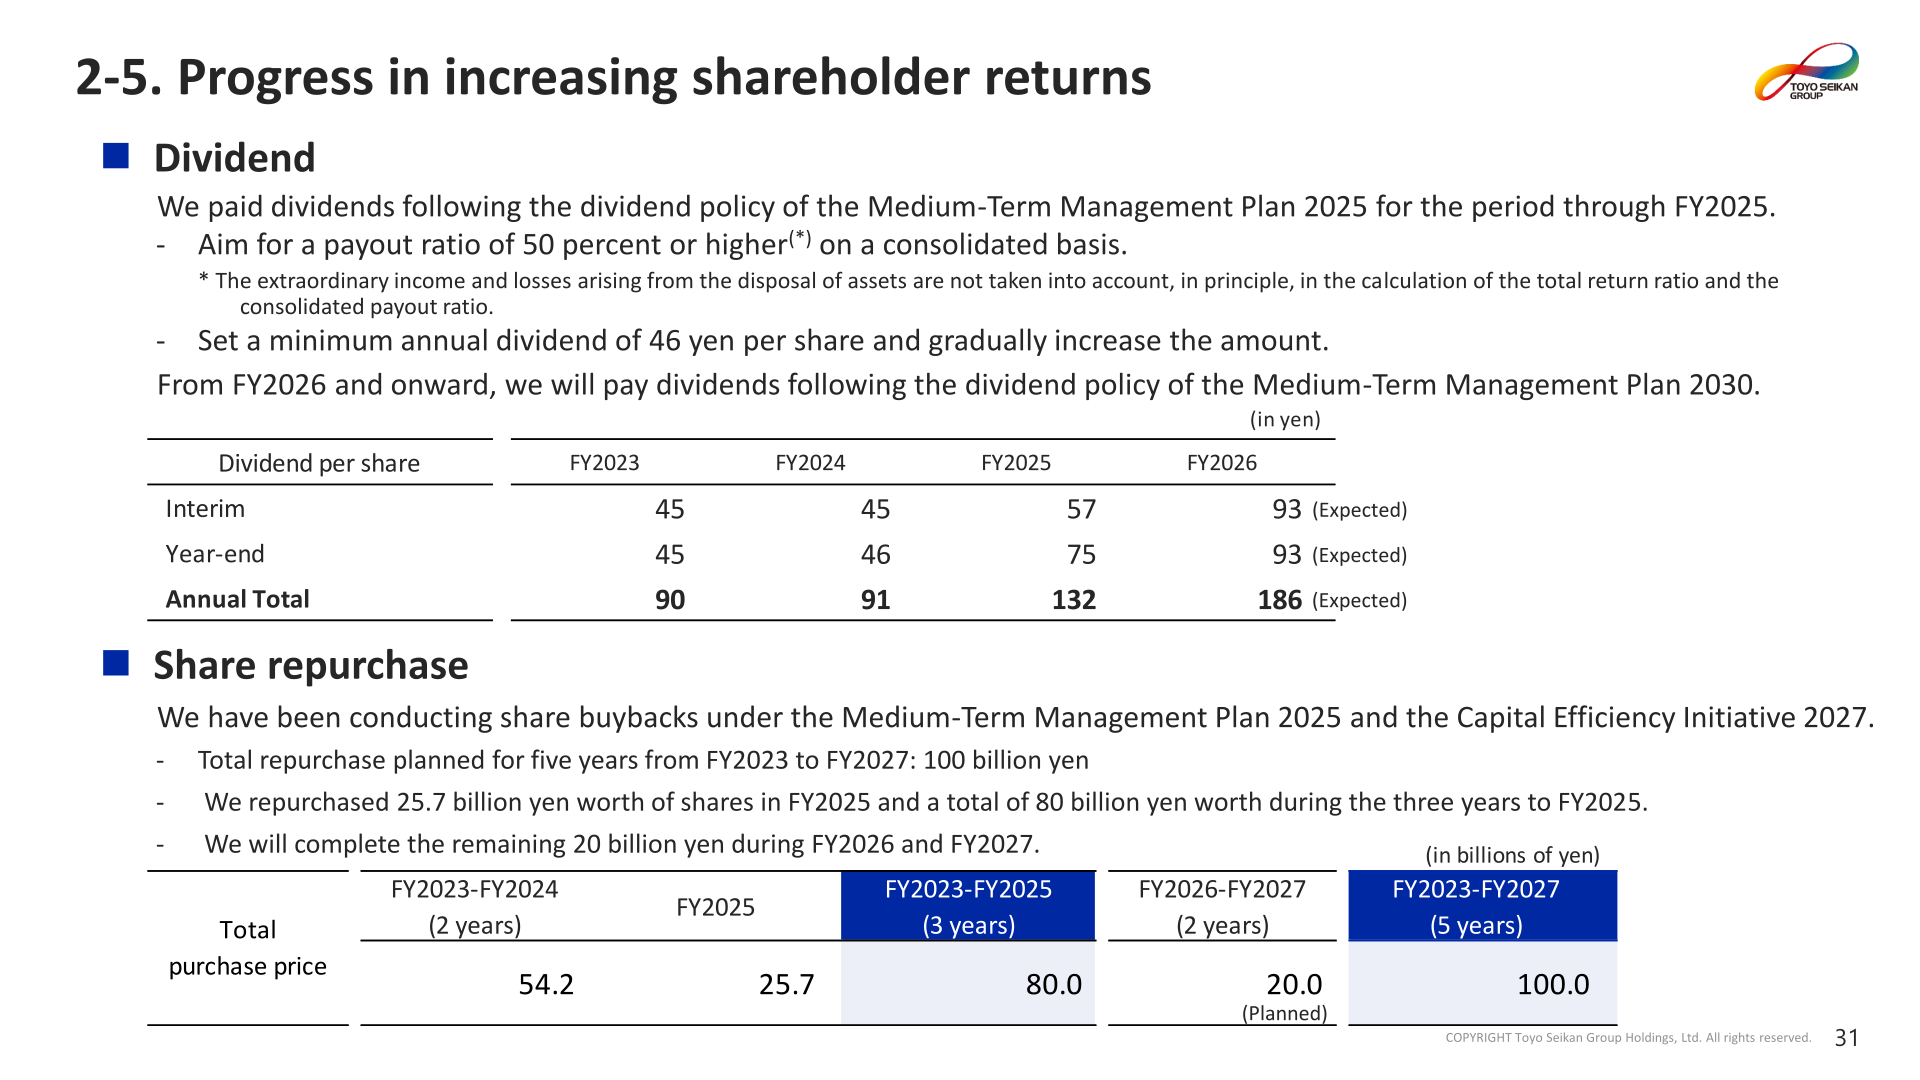
The annual dividend per share for FY2025 was 132 yen (interim 57 yen, year-end 75 yen), up from 91 yen in FY2024. For FY2026 the company shows an expected annual dividend of 186 yen per share (interim 93 yen, year-end 93 yen). Dividends through FY2025 were paid following the dividend policy of the Medium-Term Management Plan 2025, which aims for a consolidated payout ratio of 50 percent or higher and sets a minimum annual dividend of 46 yen per share to be gradually increased; from FY2026 onward the company will pay dividends following the dividend policy of the Medium-Term Management Plan 2030. On share repurchases, the company repurchased 25.7 billion yen worth of shares in FY2025 and a total of 80.0 billion yen worth during the three years to FY2025, and will complete the remaining 20.0 billion yen during FY2026 and FY2027, for a total of 100.0 billion yen planned over the five years from FY2023 to FY2027.
| Dividend per share (in yen) | FY2023 | FY2024 | FY2025 | FY2026 (Expected) |
|---|---|---|---|---|
| Interim | 45 | 45 | 57 | 93 |
| Year-end | 45 | 46 | 75 | 93 |
| Annual Total | 90 | 91 | 132 | 186 |
Medium-Term Plan / Topics
Reviewing the Medium-Term Management Plan 2025, the company notes that the operating income target of 50 billion yen for the final year was achieved at 52.0 billion yen, a difference of 2.0 billion yen, and that net sales of 963.2 billion yen exceeded the 850 billion yen target by 113.2 billion yen. EBITDA of 106.3 billion yen fell 3.7 billion yen short of the 110 billion yen target, while ROE of 8.1% exceeded the 5.0% target by 3.1 points. Five-year cumulative investment was 269.1 billion yen against a 330 billion yen target and cumulative operating cash flow was 304.2 billion yen against a 380 billion yen target, while sales of strategic shareholdings totaled 51.4 billion yen against a 40 billion yen target.
On the Capital Efficiency Initiative 2027, equity capital remained at 697.7 billion yen at the end of FY2025 despite the share repurchase worth a total of 80 billion yen for three years to FY2025, affected by external factors including the weaker yen and higher stock prices; the FY2027 targets are operating income of 65.0 billion yen and ROE of 8.0% or more. For the disposal of strategic shareholdings including cross-shareholdings, the company plans to sell a total of 60 billion yen worth of shares, having sold 24.5 billion yen worth in FY2025 and 51.4 billion yen worth over the five years to FY2025, with the remaining 8.5 billion yen or more to be completed during FY2026 and FY2027. The price-to-book ratio was 0.84 times as of March 31, 2026, compared with 0.64 times a year earlier. Measures for FY2026 and beyond are explained in the Medium-Term Management Plan 2030.
This article is an analysis based on publicly available information and is not a recommendation to buy or sell any specific securities. Investment decisions are your own responsibility.
![[Obayashi] Investors’ Guide 2026 — The Complete 24-Article Breakdown](https://japan-equity.com/wp-content/uploads/2026/07/hub_cover-1024x1024.png)
![[Obayashi] IR & SR Policy — Feeding Dialogue Back into Management](https://japan-equity.com/wp-content/uploads/2026/07/p32_sq-1024x1024.jpg)
![[Obayashi] Real Estate Development — 18.7% Margin, ¥287.7bn Unrealized Gains](https://japan-equity.com/wp-content/uploads/2026/07/p20_sq-1024x1024.jpg)
![[Obayashi] Domestic Civil Engineering — Resilience Spending Supports 9.6% Margin](https://japan-equity.com/wp-content/uploads/2026/07/p11_sq-1024x1024.jpg)
![[Obayashi] Share Price & External Ratings — vs TOPIX, ESG Index Inclusion](https://japan-equity.com/wp-content/uploads/2026/07/p40_sq-1024x1024.jpg)
![[Construction] ¥75.5tn Investment, Shrinking Workforce — Big-5 Market Share](https://japan-equity.com/wp-content/uploads/2026/07/p12_sq-1024x1024.jpg)



![[Obayashi] Capital Policy & Shareholder Returns — ROE 10%+, DOE ~5%, ¥100bn Buyback](https://japan-equity.com/wp-content/uploads/2026/07/p27_sq-1024x1024.jpg)
![[Obayashi] Reducing Cross-Shareholdings — ¥285.2bn Sold in Five Years](https://japan-equity.com/wp-content/uploads/2026/07/p29_sq-1024x1024.jpg)
![[Obayashi] ¥750bn Investment Plan — ¥300bn to Development, ¥190bn to Tech/DX](https://japan-equity.com/wp-content/uploads/2026/07/p30_sq-1024x1024.jpg)
![[Obayashi] MTP2022 KPIs — Operating Profit ~2x Target, ROE 14.4%](https://japan-equity.com/wp-content/uploads/2026/07/p25_sq-1024x1024.jpg)
![[Obayashi] Cash Allocation — ¥420bn Investment CF Over Five Years](https://japan-equity.com/wp-content/uploads/2026/07/p26_sq-1024x1024.jpg)
![[Obayashi] Green Energy — 44 Plants, 344MW, and the Green Hydrogen Challenge](https://japan-equity.com/wp-content/uploads/2026/07/p21_sq-1024x1024.jpg)
![[Obayashi] Tackling the Labor Shortage — Robotics Construction®](https://japan-equity.com/wp-content/uploads/2026/07/p14_sq-1024x1024.jpg)
