
This article is based on publicly available IR materials and is not a recommendation to buy or sell any specific securities.
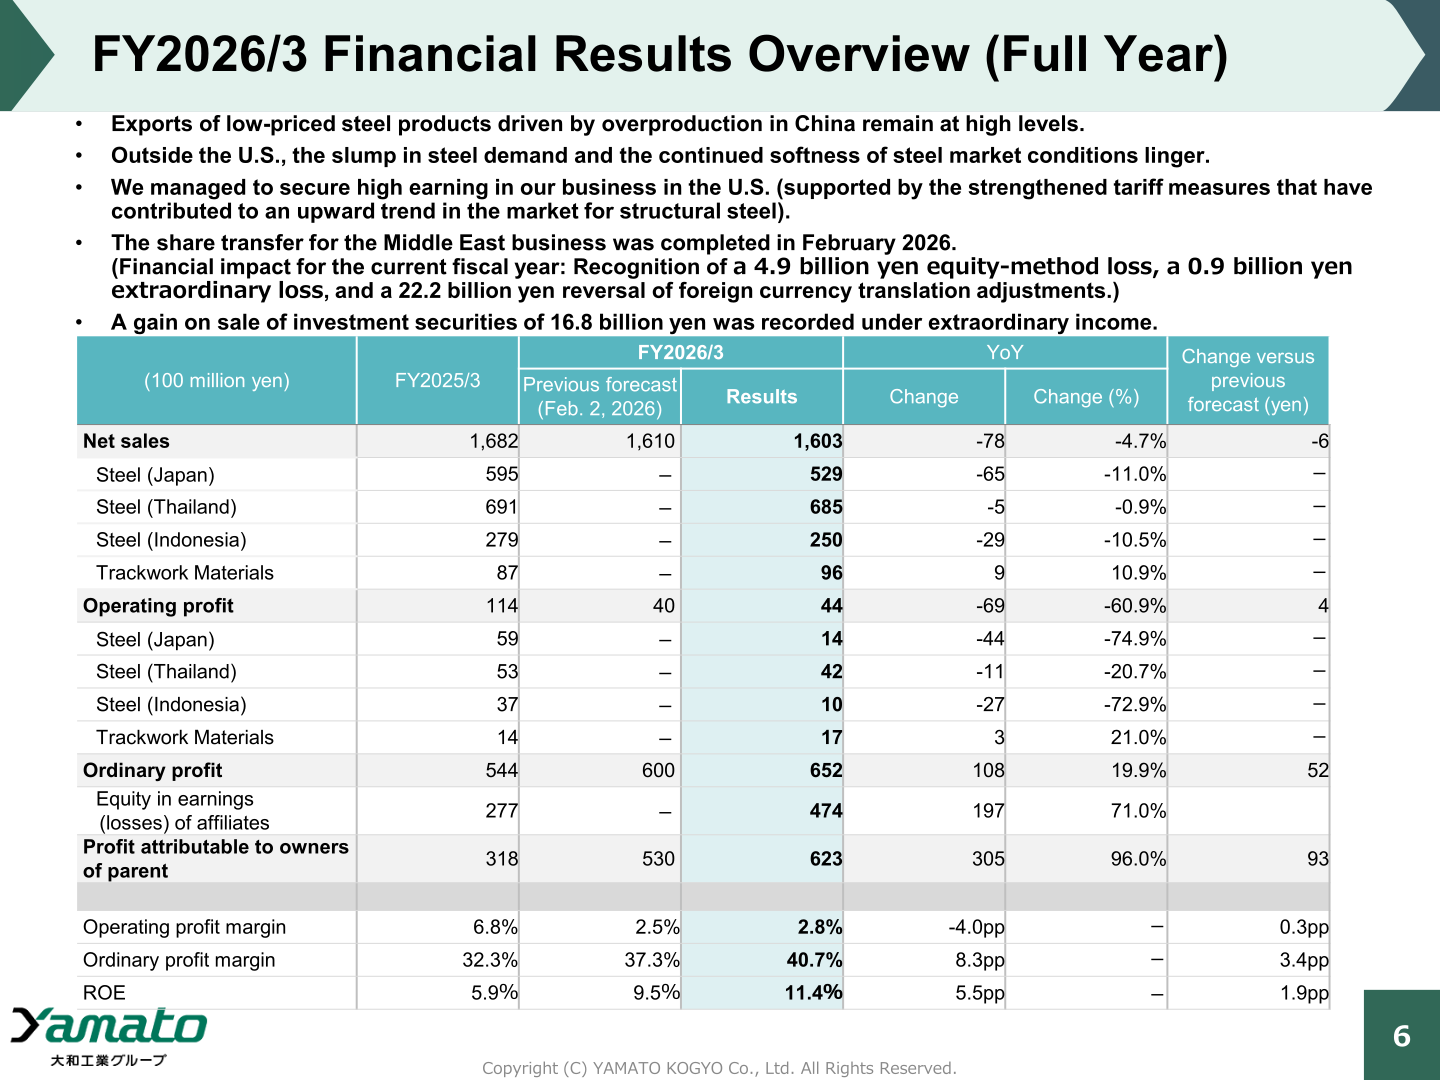
Note: This article covers the fiscal year ended March 31, 2026, which this site classifies as FY2025. Yamato Kogyo labels the same period “FY2026/3,” and the company’s own labels are retained in the body text and tables below. Net sales came to 1,603 (100 million yen), down 4.7% year on year, and operating profit fell 60.9% to 44. Ordinary profit rose 19.9% to 652 and profit attributable to owners of parent rose 96.0% to 623, as equity in earnings of affiliates increased 71.0% to 474. ROE was 11.4% and the capital adequacy ratio was 85.5%.
Consolidated Results (Full-Year Actual)
The materials state that exports of low-priced steel products driven by overproduction in China remain at high levels, and that outside the U.S. the slump in steel demand and the continued softness of steel market conditions linger. The company says it managed to secure high earnings in its business in the U.S., supported by the strengthened tariff measures that have contributed to an upward trend in the market for structural steel.
The share transfer for the Middle East business was completed in February 2026. The financial impact for the current fiscal year was recognition of a 4.9 billion yen equity-method loss, a 0.9 billion yen extraordinary loss, and a 22.2 billion yen reversal of foreign currency translation adjustments. A gain on sale of investment securities of 16.8 billion yen was recorded under extraordinary income. Results also came in above the previous forecast of February 2, 2026: ordinary profit exceeded it by 52 and profit attributable to owners of parent by 93.
| Item (100 million yen) | FY2025/3 | FY2026/3 | Change | Change (%) |
|---|---|---|---|---|
| Net sales | 1,682 | 1,603 | -78 | -4.7% |
| Steel (Japan) | 595 | 529 | -65 | -11.0% |
| Steel (Thailand) | 691 | 685 | -5 | -0.9% |
| Steel (Indonesia) | 279 | 250 | -29 | -10.5% |
| Trackwork Materials | 87 | 96 | 9 | 10.9% |
| Operating profit | 114 | 44 | -69 | -60.9% |
| Ordinary profit | 544 | 652 | 108 | 19.9% |
| Equity in earnings (losses) of affiliates | 277 | 474 | 197 | 71.0% |
| Profit attributable to owners of parent | 318 | 623 | 305 | 96.0% |
| Operating profit margin | 6.8% | 2.8% | -4.0pp | - |
| Ordinary profit margin | 32.3% | 40.7% | 8.3pp | - |
| ROE | 5.9% | 11.4% | 5.5pp | - |
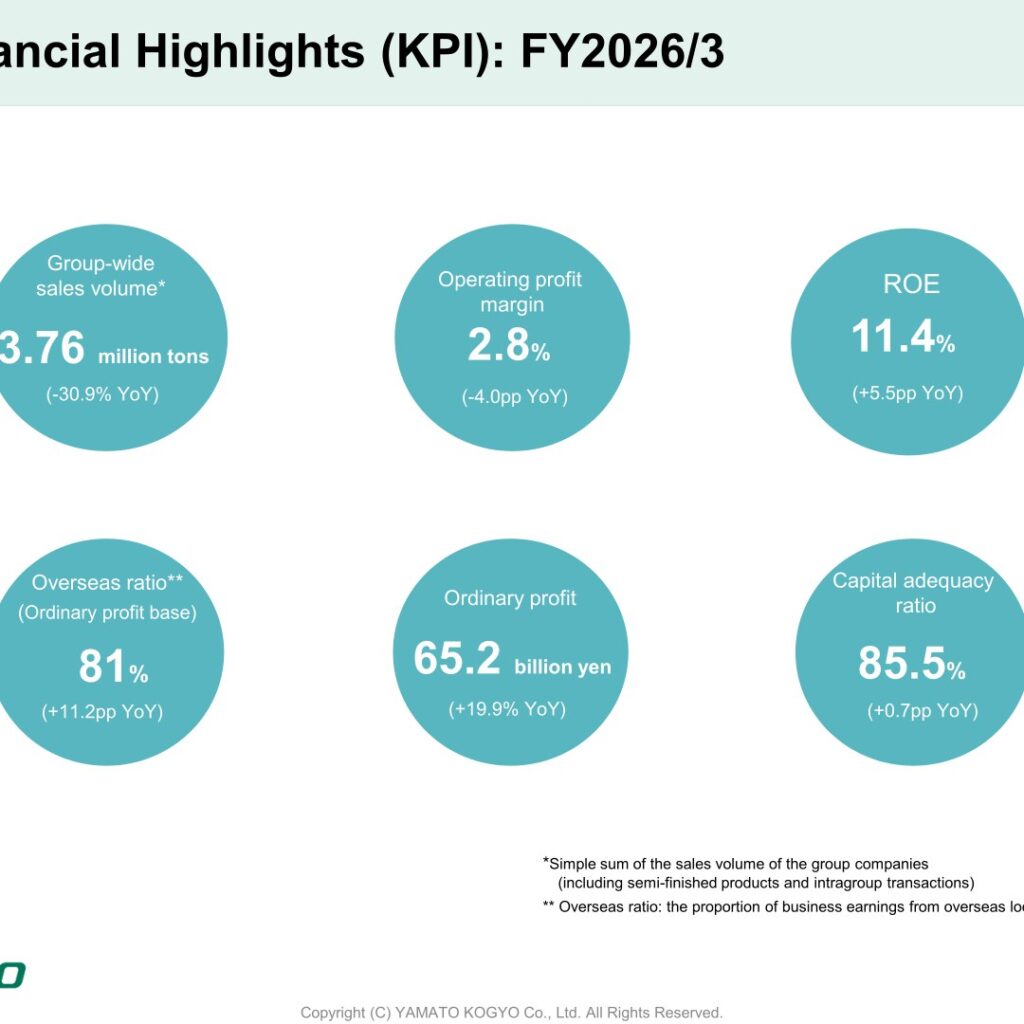
Key performance indicators disclosed for FY2026/3 were ordinary profit of 65.2 billion yen (+19.9% YoY), an operating profit margin of 2.8% (-4.0pp YoY), ROE of 11.4% (+5.5pp YoY), a capital adequacy ratio of 85.5% (+0.7pp YoY), group-wide sales volume of 3.76 million tons (-30.9% YoY), and an overseas ratio on an ordinary profit base of 81% (+11.2pp YoY). Group-wide sales volume for the full fiscal year decreased 30.9% year on year to 3,769,000 tons, including the impact of the withdrawal from the Middle East business.
Segment Results
In Steel (Japan), the stagnation in demand for structural steel has been prolonged resulting from shortage of construction capacity and persistently high construction costs. Yamato Steel’s sales volume remained at 439,000 tons, partly due to the impact of preliminary construction for the renewal of the rolling line, and metal margins worsened further due to rising steel scrap prices as well as increases in various costs such as electricity costs; sales and profit declined year on year.
In Steel (Thailand), Siam Yamato Steel’s sales volume reached 638,000 tons, exceeding the previous period, driven by a recovery in domestic demand and stronger exports, but sales and profit declined due to a narrowing of metal margins caused by a drop in selling prices. An anti-dumping duty measure of 30.86% to 54.19% for a period of five years took effect on H-beams imported from China in November 2025. In March 2026 the company acquired additional shares of SYS, increasing the equity interest to 70%.
In Steel (Indonesia), infrastructure investment budgets were significantly reduced as a result of budget revisions under the new administration. PT Garuda Yamato Steel’s sales volume remained at 190,000 tons for the full year, and although sales and profit declined year on year, segment income amounted to 1.0 billion yen, including 1.2 billion yen in amortization of goodwill and other expenses. Consolidation of GYS began at the end of FY2025/3 Q1.
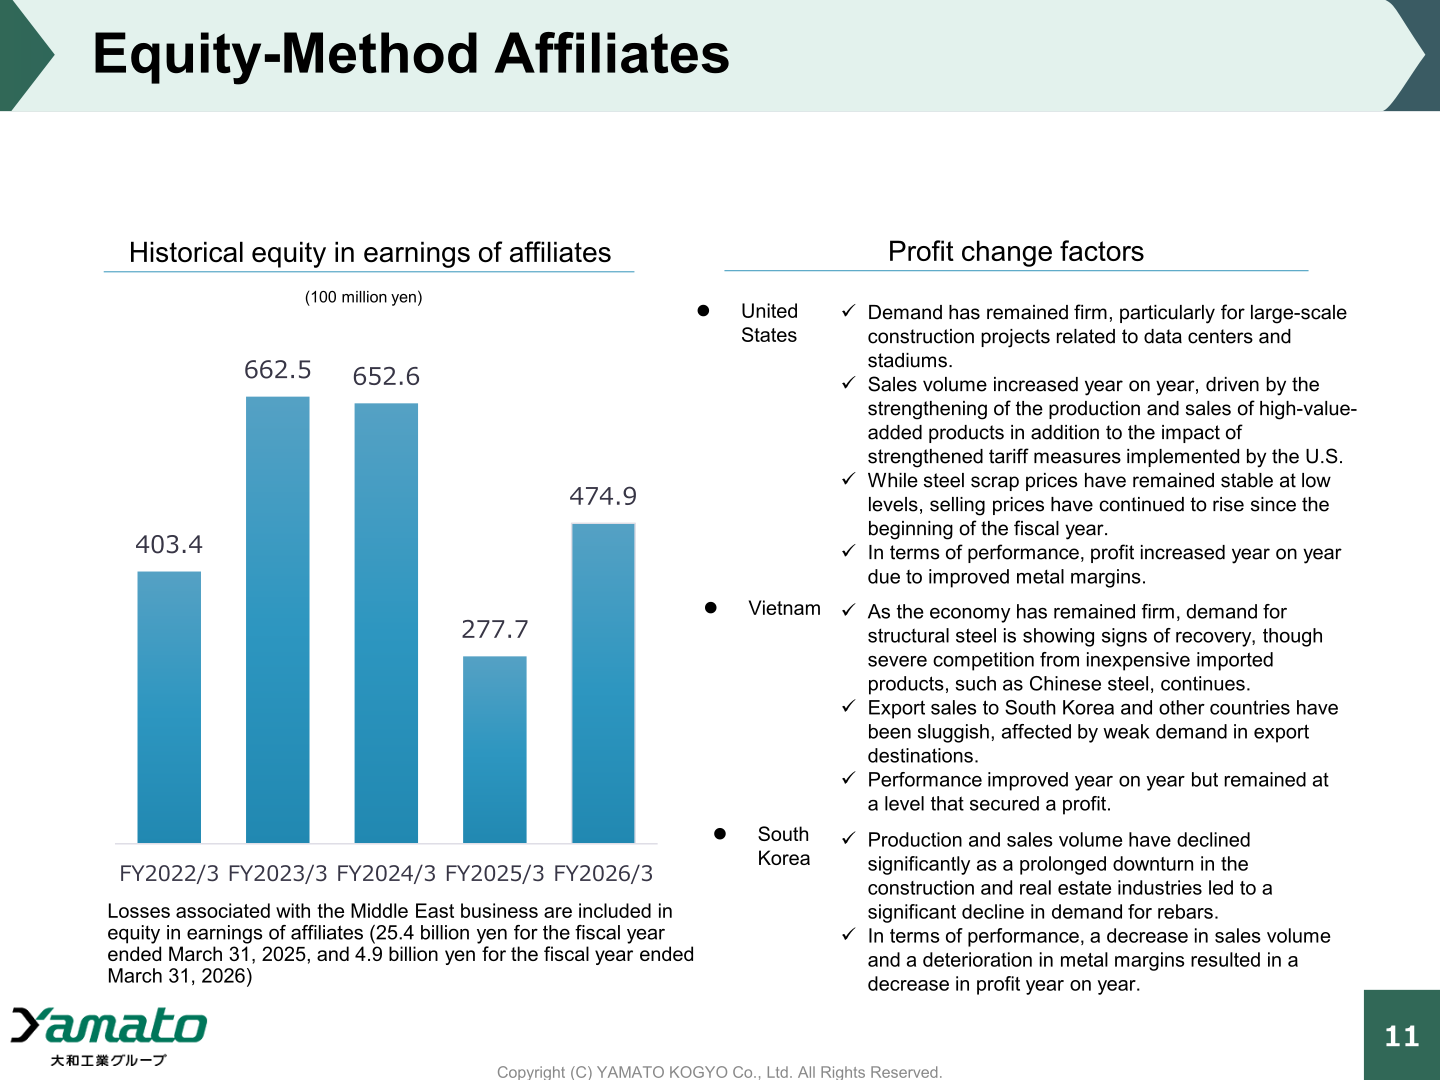
Equity in earnings of affiliates rose to 474 from 277. In the United States, demand has remained firm, particularly for large-scale construction projects related to data centers and stadiums, and profit increased year on year due to improved metal margins. In Vietnam, performance improved year on year but remained at a level that secured a profit. In South Korea, production and sales volume declined significantly as a prolonged downturn in the construction and real estate industries led to a significant decline in demand for rebars, and profit decreased year on year. Losses associated with the Middle East business are included in equity in earnings of affiliates: 25.4 billion yen for the fiscal year ended March 31, 2025, and 4.9 billion yen for the fiscal year ended March 31, 2026.
| Segment | Metric (100 million yen) | FY2025/3 | FY2026/3 |
|---|---|---|---|
| Steel (Japan) | Net sales | 595 | 529 |
| Steel (Japan) | Operating profit | 59 | 14 |
| Steel (Thailand) | Net sales | 691 | 685 |
| Steel (Thailand) | Operating profit | 53 | 42 |
| Steel (Indonesia) | Net sales | 279 | 250 |
| Steel (Indonesia) | Operating profit | 37 | 10 |
| Trackwork Materials | Net sales | 87 | 96 |
| Trackwork Materials | Operating profit | 14 | 17 |
| Consolidated | Equity in earnings (losses) of affiliates | 277 | 474 |
Balance Sheet and Cash Flows
Total assets stood at 6,335 (100 million yen) at the end of FY2026/3, down 239 from the end of FY2025/3, and net assets were 5,814, down 215. Cash and deposits were 2,193 and investment securities 468. The capital adequacy ratio was 85.5% and net assets per share were 9,066 yen. Major changes in shareholders’ equity were profit attributable to owners of parent of +62.3 billion yen, dividends from surplus of -24.5 billion yen, and purchase of treasury shares of -25.3 billion yen.
Operating cash flow was 52.0 billion yen, partly due to cash distributions from a U.S. equity-method affiliate. Investing cash flow was 2.3 billion yen, mainly due to the purchase of property, plant and equipment, and the sale of investment securities. Financing cash flow was minus 57.7 billion yen, an increase in outflow of 14.7 billion yen year on year, partly due to shareholder returns. Free cash flow, defined as operating CF plus investing CF excluding changes in time deposits, was 544 (100 million yen).
FY2027/3 Forecast
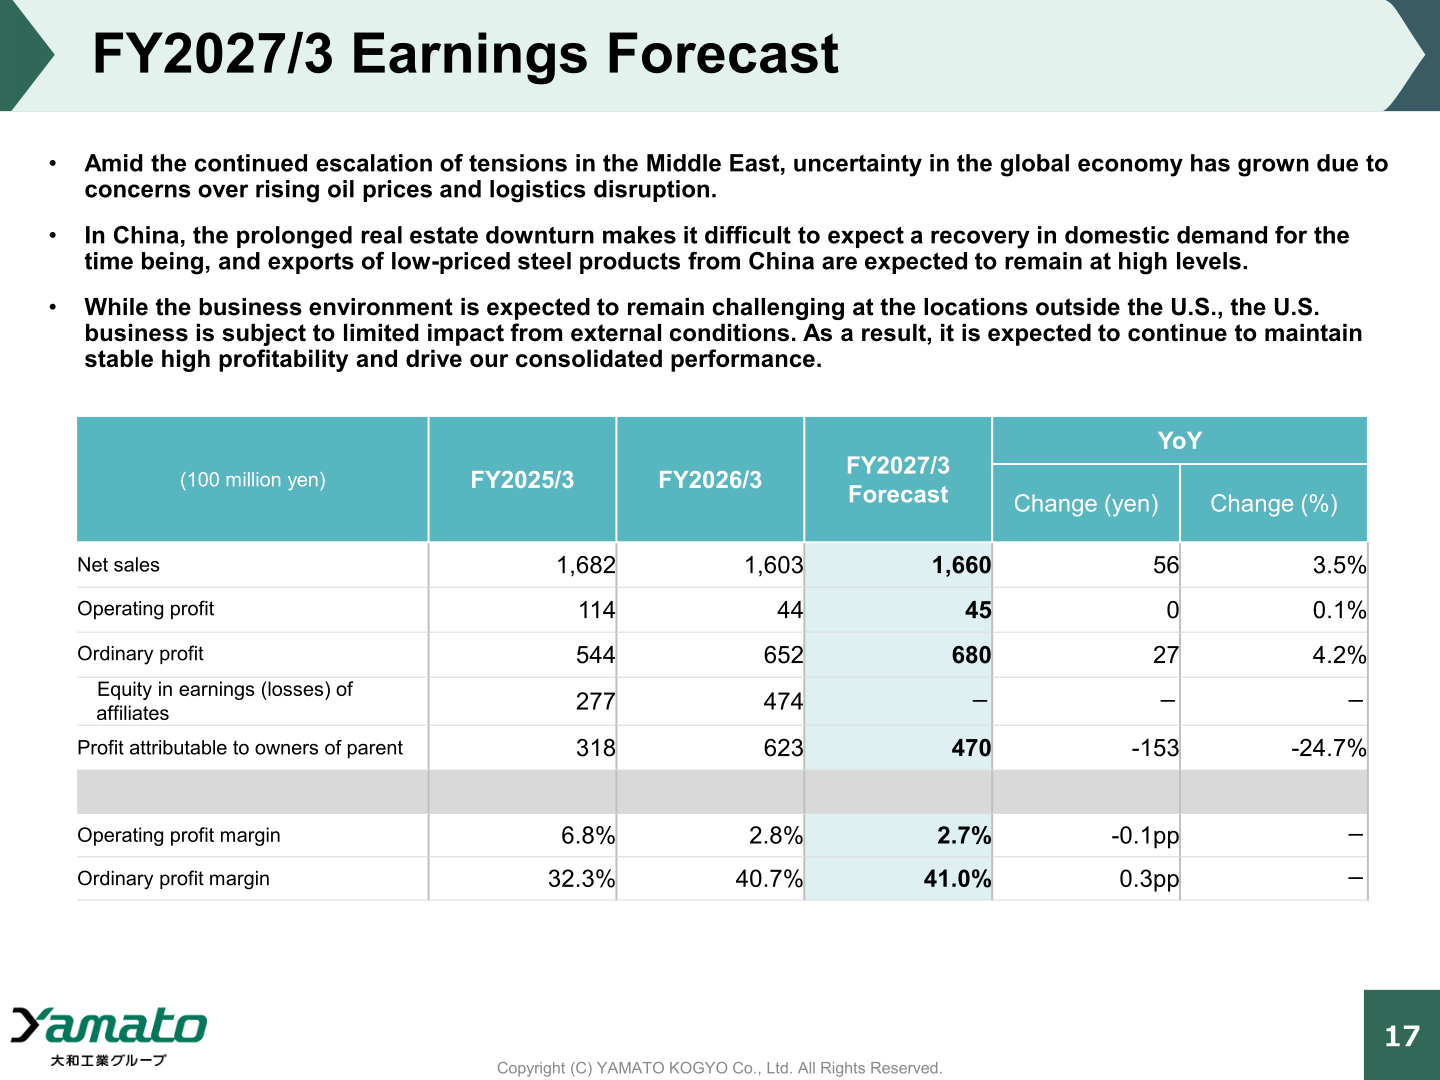
The company expects the business environment to remain challenging at locations outside the U.S., while the U.S. business is subject to limited impact from external conditions and is expected to continue to maintain stable high profitability and drive consolidated performance. In China, the prolonged real estate downturn makes it difficult to expect a recovery in domestic demand for the time being, and exports of low-priced steel products from China are expected to remain at high levels. By segment, profit is expected to decrease year on year in Steel (Japan) — operations are scheduled to be suspended for two months, from May through June, as part of the preliminary construction for the renewal of the rolling line — to increase in Steel (Thailand), and to be comparable to the previous fiscal year in Steel (Indonesia). Capital investment is expected to increase by 5.2 billion yen year on year to 18.0 billion yen.
| Item (100 million yen) | FY2025/3 | FY2026/3 | FY2027/3 Forecast | Change | Change (%) |
|---|---|---|---|---|---|
| Net sales | 1,682 | 1,603 | 1,660 | 56 | 3.5% |
| Operating profit | 114 | 44 | 45 | 0 | 0.1% |
| Ordinary profit | 544 | 652 | 680 | 27 | 4.2% |
| Equity in earnings (losses) of affiliates | 277 | 474 | - | - | - |
| Profit attributable to owners of parent | 318 | 623 | 470 | -153 | -24.7% |
| Operating profit margin | 6.8% | 2.8% | 2.7% | -0.1pp | - |
| Ordinary profit margin | 32.3% | 40.7% | 41.0% | 0.3pp | - |
Shareholder Returns
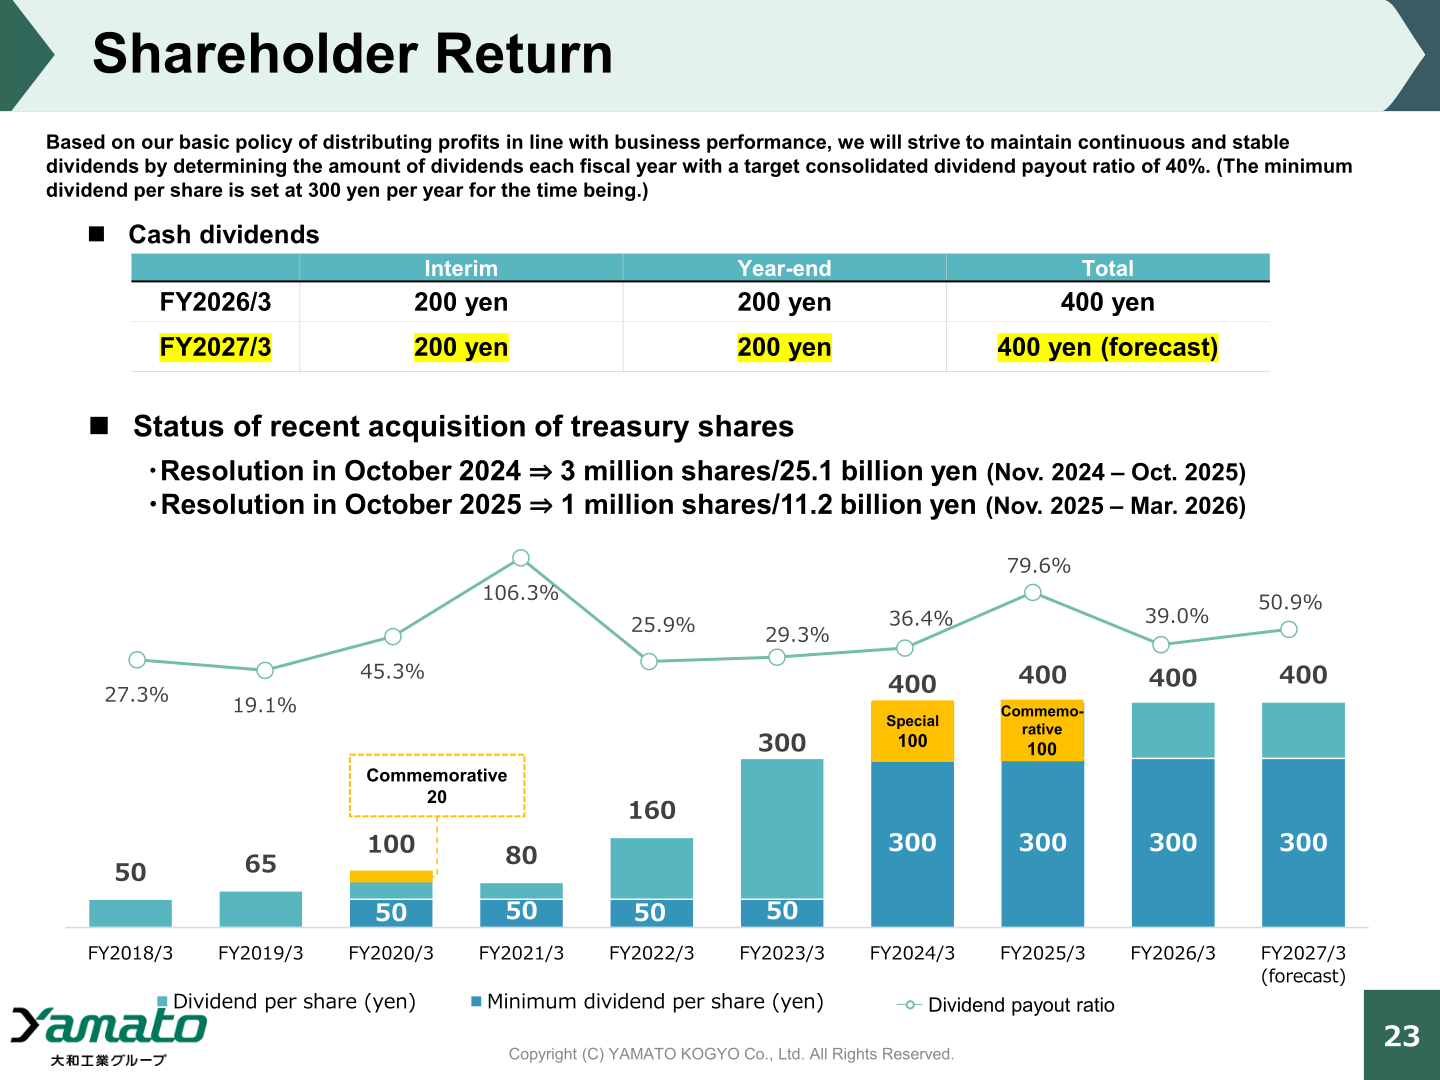
Based on its basic policy of distributing profits in line with business performance, the company states that it will strive to maintain continuous and stable dividends by determining the amount of dividends each fiscal year with a target consolidated dividend payout ratio of 40%, with the minimum dividend per share set at 300 yen per year for the time being. On treasury shares, a resolution in October 2024 covered 3 million shares / 25.1 billion yen (November 2024 to October 2025), and a resolution in October 2025 covered 1 million shares / 11.2 billion yen (November 2025 to March 2026).
| Dividend per share | FY2026/3 | FY2027/3 (Forecast) |
|---|---|---|
| Interim | 200 yen | 200 yen |
| Year-end | 200 yen | 200 yen |
| Total | 400 yen | 400 yen |
| Minimum dividend per share (policy) | 300 yen | 300 yen |
Medium- to Long-Term Plan (Vision 2030)
Vision 2030, announced in November 2023, targets a company that achieves and solidifies its position as the global leader in volume and profitability in structural steel and continues to embrace challenges in new business areas. The company states there is no change to the basic policy outlined in the road map to achieve Vision 2030; while having withdrawn from the Middle East, it is expanding production bases in India, emerging countries and other areas, and restructuring the business portfolio to achieve sustainable growth globally. The road map indicates total investment of 250 billion to 300 billion yen, with strengthening of the core structural steel business of 115 billion yen through FY26/3 and 85 billion yen for FY27/3 to FY30/3, and growth investment of 50 billion to 100 billion yen for FY27/3 to FY30/3 including a 4.0 billion yen investment in Salix. The financial strategy is to maintain ROE of 10% or more and support growth investments flexibly.
In ASEAN, the framework for a 3-million-ton structural steel strategy is centered on SYS as the ASEAN mother factory at 1.1 Mt, with PY VINA at 0.5 Mt or more and GYS at 0.9 Mt. Cash on hand as of March 31, 2026 was approximately 220 billion yen, including deposits of approximately 0.9 billion USD. The number of IR activities implemented in FY2026/3 was 201.
This article is an analysis based on publicly available information and is not a recommendation to buy or sell any specific securities. Investment decisions are your own responsibility.
![[Obayashi] Investors’ Guide 2026 — The Complete 24-Article Breakdown](https://japan-equity.com/wp-content/uploads/2026/07/hub_cover-1024x1024.png)
![[Obayashi] IR & SR Policy — Feeding Dialogue Back into Management](https://japan-equity.com/wp-content/uploads/2026/07/p32_sq-1024x1024.jpg)
![[Obayashi] Real Estate Development — 18.7% Margin, ¥287.7bn Unrealized Gains](https://japan-equity.com/wp-content/uploads/2026/07/p20_sq-1024x1024.jpg)
![[Obayashi] Domestic Civil Engineering — Resilience Spending Supports 9.6% Margin](https://japan-equity.com/wp-content/uploads/2026/07/p11_sq-1024x1024.jpg)
![[Obayashi] Share Price & External Ratings — vs TOPIX, ESG Index Inclusion](https://japan-equity.com/wp-content/uploads/2026/07/p40_sq-1024x1024.jpg)
![[Construction] ¥75.5tn Investment, Shrinking Workforce — Big-5 Market Share](https://japan-equity.com/wp-content/uploads/2026/07/p12_sq-1024x1024.jpg)



![[Obayashi] Capital Policy & Shareholder Returns — ROE 10%+, DOE ~5%, ¥100bn Buyback](https://japan-equity.com/wp-content/uploads/2026/07/p27_sq-1024x1024.jpg)
![[Obayashi] Reducing Cross-Shareholdings — ¥285.2bn Sold in Five Years](https://japan-equity.com/wp-content/uploads/2026/07/p29_sq-1024x1024.jpg)
![[Obayashi] ¥750bn Investment Plan — ¥300bn to Development, ¥190bn to Tech/DX](https://japan-equity.com/wp-content/uploads/2026/07/p30_sq-1024x1024.jpg)
![[Obayashi] MTP2022 KPIs — Operating Profit ~2x Target, ROE 14.4%](https://japan-equity.com/wp-content/uploads/2026/07/p25_sq-1024x1024.jpg)
![[Obayashi] Cash Allocation — ¥420bn Investment CF Over Five Years](https://japan-equity.com/wp-content/uploads/2026/07/p26_sq-1024x1024.jpg)
![[Obayashi] Green Energy — 44 Plants, 344MW, and the Green Hydrogen Challenge](https://japan-equity.com/wp-content/uploads/2026/07/p21_sq-1024x1024.jpg)
![[Obayashi] Tackling the Labor Shortage — Robotics Construction®](https://japan-equity.com/wp-content/uploads/2026/07/p14_sq-1024x1024.jpg)
