
This article is based on publicly available IR materials and is not a recommendation to buy or sell any specific securities.
Note: Lion Corporation closes its books in December, and the materials label the year under review “Fiscal 2025” (the fiscal year ended December 31, 2025); the labels used in the text and tables below follow the presentation. Lion posted net sales of ¥422.0 billion, up 2.2% year on year, and core operating income of ¥30.7 billion, up 16.8%, with operating profit of ¥36.3 billion, up 28.1%. The company states it achieved its targets for the second consecutive fiscal year, that profit structure reforms progressed faster than planned in Consumer Products, and that new products launched in the second half boosted sales momentum. EPS rose 30.4% to ¥99.74 and the EBITDA margin improved 0.8 points to 11.7%. For fiscal 2026 the company forecasts net sales of ¥430.0 billion and core operating income of ¥35.0 billion, and plans to raise the annual dividend by ¥4 to ¥34.
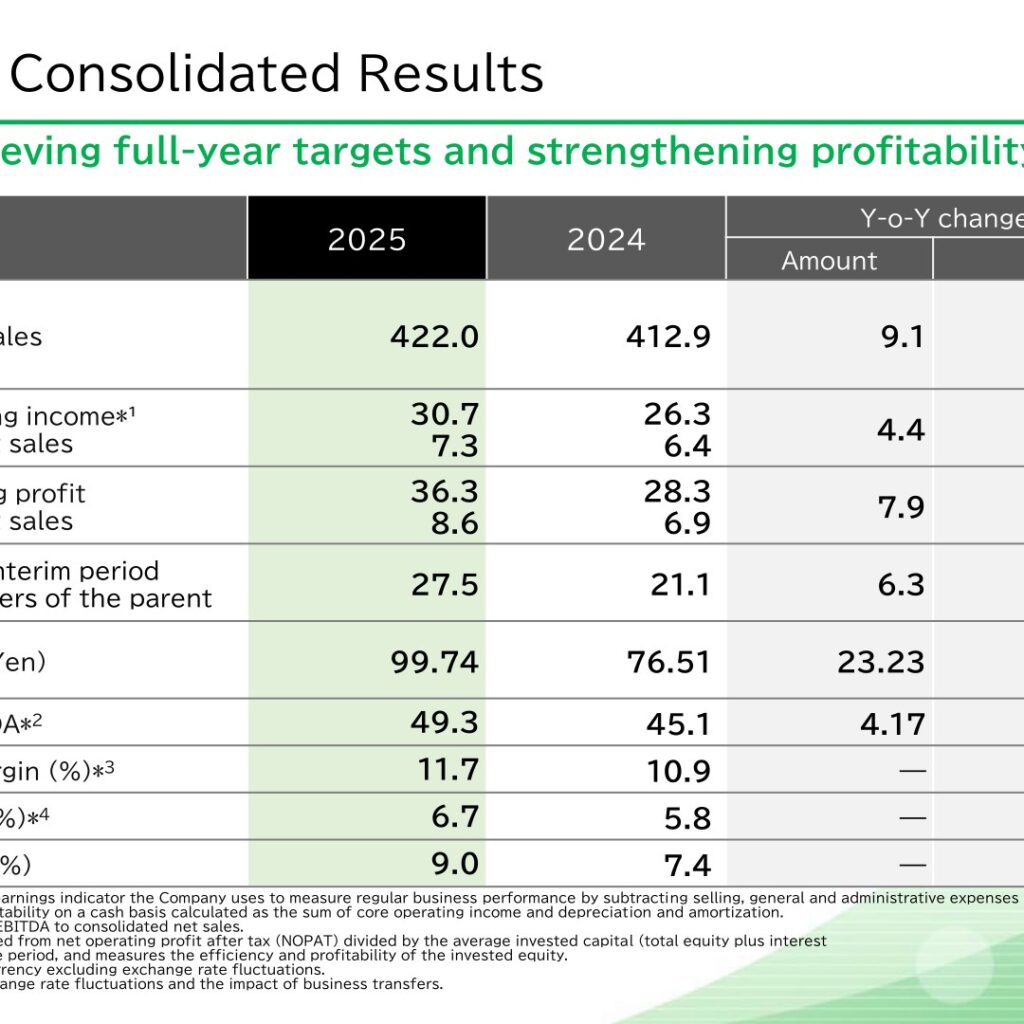
Consolidated Results (Full-Year Actual)
The presentation describes a firm start to achieving full-year targets, with strengthened profitability improving margins. Core operating income — the indicator Lion uses to measure regular business performance, calculated by subtracting selling, general and administrative expenses from gross profit — rose ¥4.4 billion to ¥30.7 billion, lifting the core operating income margin from 6.4% to 7.3%. Operating profit rose ¥7.9 billion to ¥36.3 billion. Profit attributable to owners of the parent increased ¥6.3 billion, or 30.1%, to ¥27.5 billion. ROIC improved 0.9 points to 6.7% and ROE improved 1.6 points to 9.0%. The Lion Group applies IFRS, and the materials note that monetary amounts are truncated after the last digit shown.
| Item (Billions of yen) | 2025 | 2024 | Change (Amount) | Change (%) |
|---|---|---|---|---|
| Net sales | 422.0 | 412.9 | 9.1 | 2.2 |
| Core operating income | 30.7 | 26.3 | 4.4 | 16.8 |
| Core operating income, % of net sales | 7.3 | 6.4 | ― | ― |
| Operating profit | 36.3 | 28.3 | 7.9 | 28.1 |
| Operating profit, % of net sales | 8.6 | 6.9 | ― | ― |
| Profit attributable to owners of the parent | 27.5 | 21.1 | 6.3 | 30.1 |
| EPS (Yen) | 99.74 | 76.51 | 23.23 | 30.4 |
| EBITDA | 49.3 | 45.1 | 4.17 | 9.2 |
| EBITDA margin (%) | 11.7 | 10.9 | 0.8PP | ― |
| ROIC (%) | 6.7 | 5.8 | 0.9PP | ― |
| ROE (%) | 9.0 | 7.4 | 1.6PP | ― |
On the consolidated statement of income, cost of sales was ¥228.1 billion against ¥224.1 billion a year earlier, gross profit was ¥193.9 billion (up 2.7%), and selling, general and administrative expenses were ¥163.1 billion (up 0.4%). Profit before tax was ¥39.4 billion, up 22.3%. Within SG&A, advertising expenses fell 6.7% to ¥17.4 billion and transportation and warehousing expenses fell 3.0% to ¥20.9 billion, while R&D expenses rose 4.3% to ¥11.9 billion. Total assets stood at ¥528.5 billion and equity at ¥348.4 billion at the end of the period. Cash flows from operating activities were ¥40.6 billion, cash flows from investing activities were (43.4) and cash flows from financing activities were (12.4), leaving cash and cash equivalents at ¥88.0 billion.
Segment Results
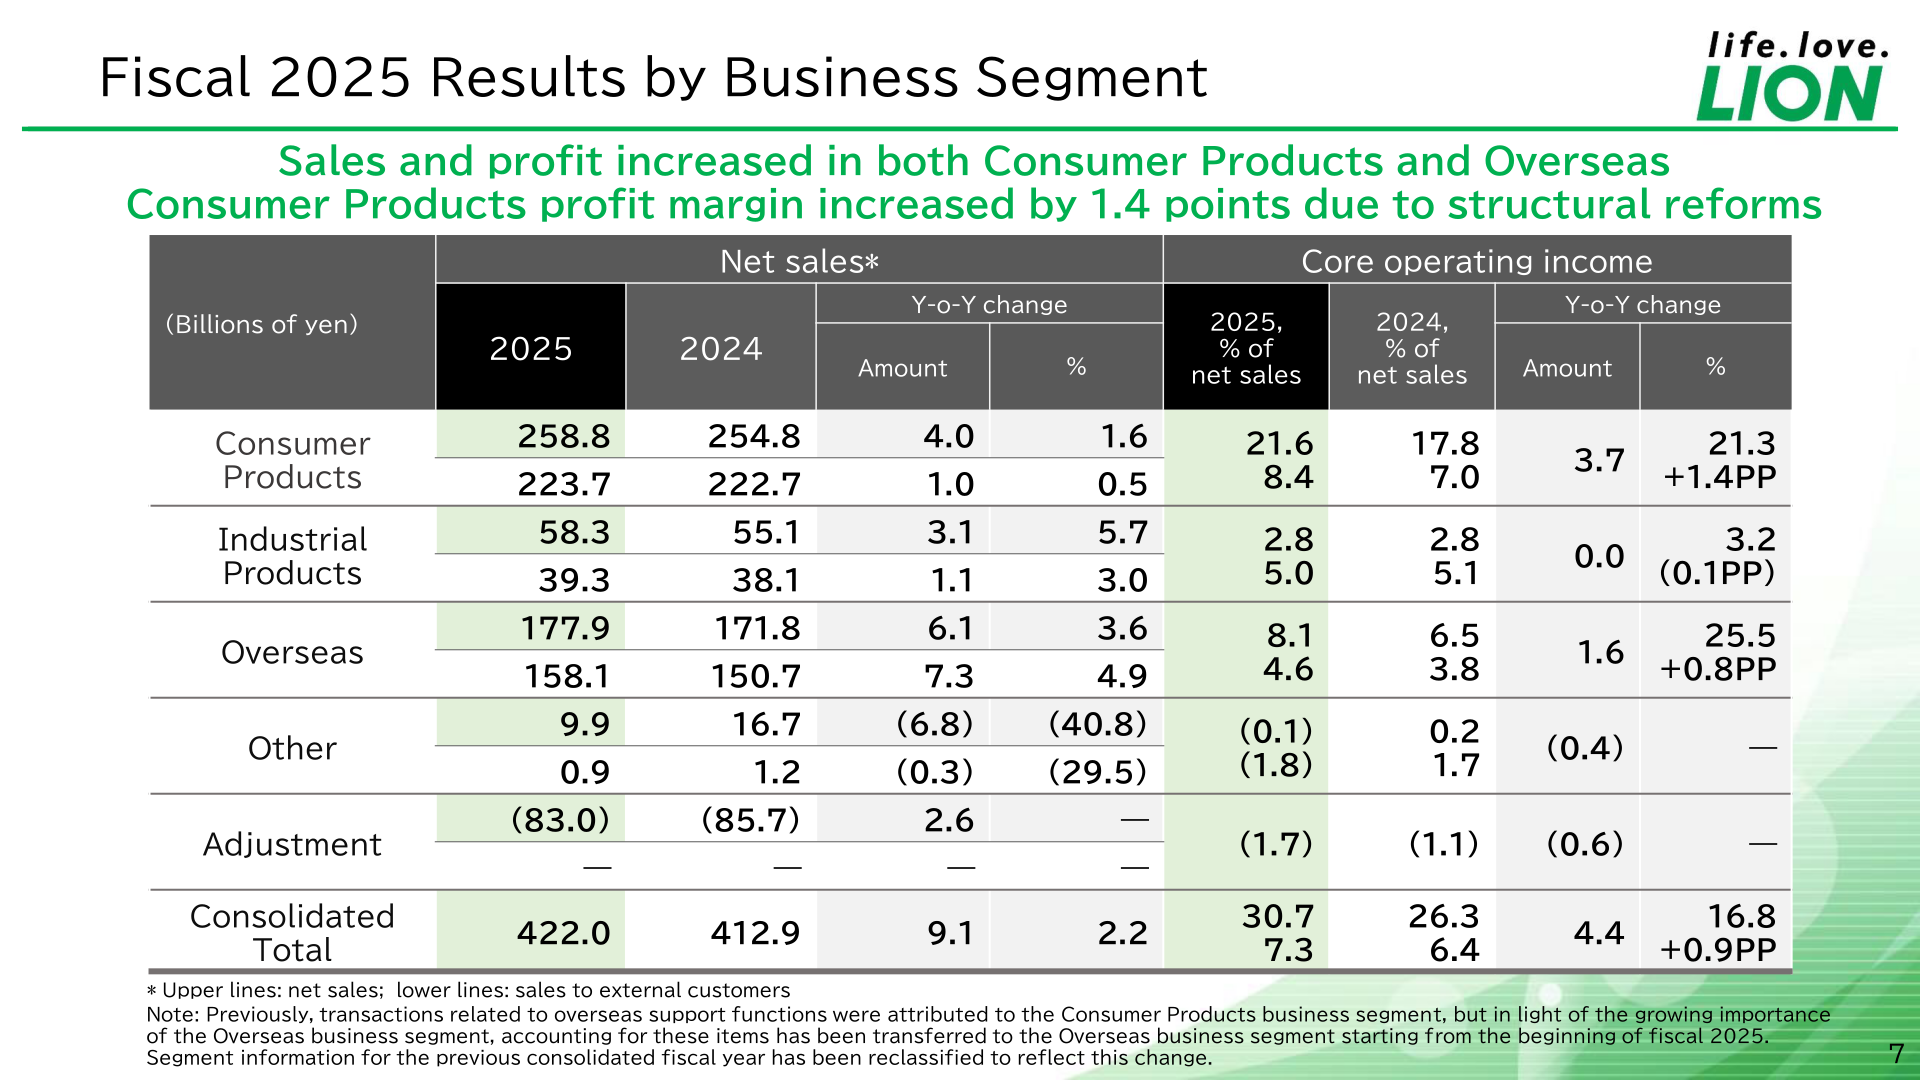
Sales and profit increased in both Consumer Products and Overseas, and the Consumer Products core operating income margin rose 1.4 points on structural reforms. The materials note that transactions related to overseas support functions, previously attributed to the Consumer Products segment, have been transferred to the Overseas segment from the beginning of fiscal 2025, and that prior-year segment information has been reclassified accordingly. In the table below, net sales are shown on the upper line and sales to external customers on the lower line, following the presentation.
| Segment (Billions of yen) | Net sales 2025 | Net sales 2024 | Core operating income 2025 | Core operating income 2024 | COI margin 2025 / 2024 |
|---|---|---|---|---|---|
| Consumer Products | 258.8 (external 223.7) | 254.8 (external 222.7) | 21.6 | 17.8 | 8.4 / 7.0 |
| Industrial Products | 58.3 (external 39.3) | 55.1 (external 38.1) | 2.8 | 2.8 | 5.0 / 5.1 |
| Overseas | 177.9 (external 158.1) | 171.8 (external 150.7) | 8.1 | 6.5 | 4.6 / 3.8 |
| Other | 9.9 (external 0.9) | 16.7 (external 1.2) | (0.1) | 0.2 | (1.8) / 1.7 |
| Adjustment | (83.0) | (85.7) | (1.7) | (1.1) | ― |
| Consolidated Total | 422.0 | 412.9 | 30.7 | 26.3 | 7.3 / 6.4 |
Within Consumer Products, Oral Healthcare — designated a Top Priority Business — grew 4.7% to ¥80.2 billion, driven by high-end toothpaste. Beauty Care rose 2.3% to ¥25.1 billion. Fabric Care declined 1.8% to ¥56.0 billion, though the materials state profitability improved significantly on structural reform measures. Living Care fell 2.2% to ¥20.9 billion and Pharmaceutical fell 3.9% to ¥24.1 billion, while Other rose 4.6% to ¥52.3 billion.
| Consumer Products category (Billions of yen) | 2025 | 2024 | Change (Amount) | Change (%) |
|---|---|---|---|---|
| Oral Healthcare | 80.2 | 76.5 | 3.6 | 4.7 |
| Beauty Care | 25.1 | 24.5 | 0.5 | 2.3 |
| Fabric Care | 56.0 | 57.1 | (1.0) | (1.8) |
| Living Care | 20.9 | 21.4 | (0.4) | (2.2) |
| Pharmaceutical | 24.1 | 25.1 | (0.9) | (3.9) |
| Other | 52.3 | 49.9 | 2.3 | 4.6 |
| Total | 258.8 | 254.8 | 4.0 | 1.6 |
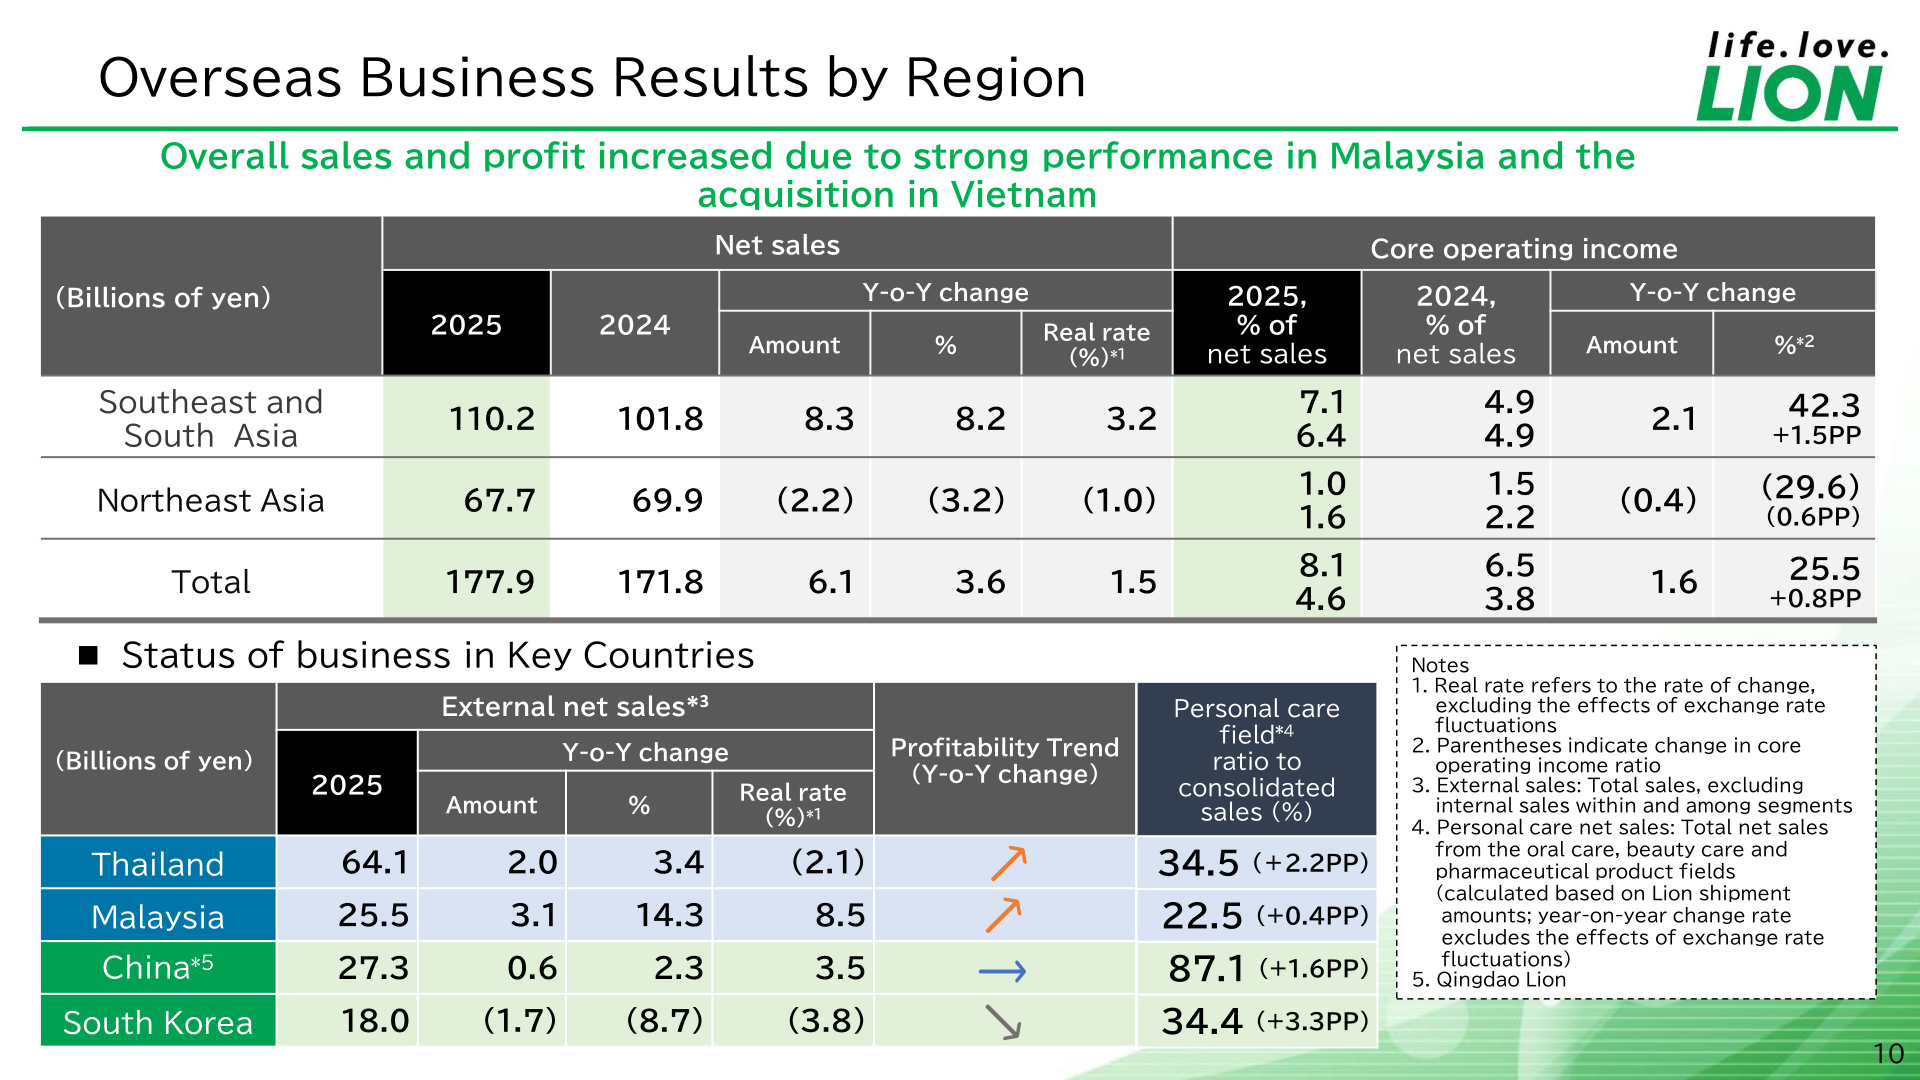
In the Overseas business, overall sales and profit increased on strong performance in Malaysia and the acquisition in Vietnam. Southeast and South Asia net sales rose 8.2% to ¥110.2 billion with core operating income up 42.3% to ¥7.1 billion, while Northeast Asia net sales fell 3.2% to ¥67.7 billion with core operating income down 29.6% to ¥1.0 billion. By key country, external net sales were ¥64.1 billion in Thailand (up 3.4%), ¥25.5 billion in Malaysia (up 14.3%), ¥27.3 billion in China (Qingdao Lion, up 2.3%) and ¥18.0 billion in South Korea (down 8.7%).
Fiscal 2026 Forecast
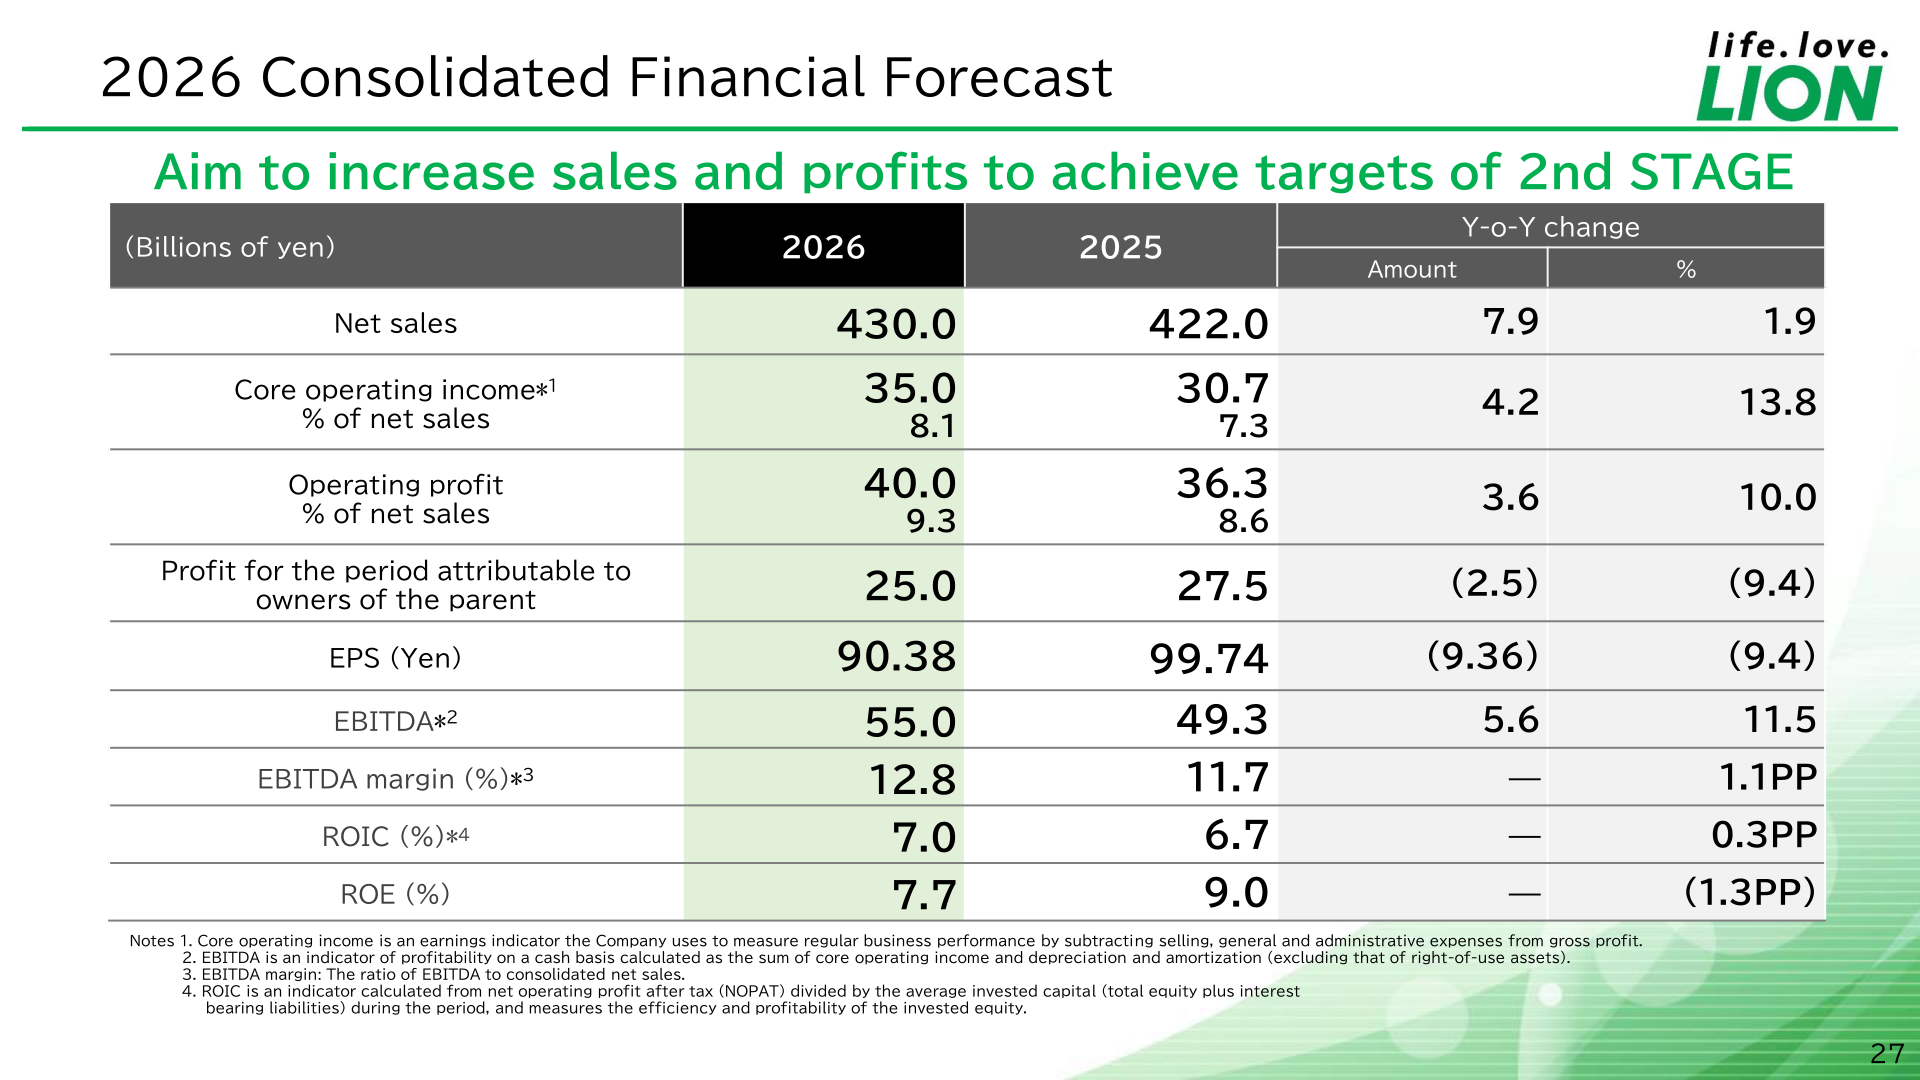
Lion forecasts higher sales and higher core operating income for fiscal 2026, aiming to achieve the targets of the 2nd STAGE plan. Net sales are projected at ¥430.0 billion (up 1.9%) and core operating income at ¥35.0 billion (up 13.8%), with the core operating income margin rising to 8.1%. Profit attributable to owners of the parent is forecast to decline 9.4% to ¥25.0 billion, with EPS of ¥90.38. EBITDA is forecast at ¥55.0 billion for an EBITDA margin of 12.8%, with ROIC of 7.0% and ROE of 7.7%. For the first half (January–June 2026), the company forecasts net sales of ¥210.0 billion, core operating income of ¥14.0 billion, operating profit of ¥19.0 billion and profit attributable to owners of the parent of ¥10.0 billion.
| Item (Billions of yen) | 2026 Forecast | 2025 (Actual) | Change (Amount) | Change (%) |
|---|---|---|---|---|
| Net sales | 430.0 | 422.0 | 7.9 | 1.9 |
| Core operating income | 35.0 | 30.7 | 4.2 | 13.8 |
| Core operating income, % of net sales | 8.1 | 7.3 | ― | ― |
| Operating profit | 40.0 | 36.3 | 3.6 | 10.0 |
| Operating profit, % of net sales | 9.3 | 8.6 | ― | ― |
| Profit attributable to owners of the parent | 25.0 | 27.5 | (2.5) | (9.4) |
| EPS (Yen) | 90.38 | 99.74 | (9.36) | (9.4) |
| EBITDA | 55.0 | 49.3 | 5.6 | 11.5 |
| EBITDA margin (%) | 12.8 | 11.7 | 1.1PP | ― |
| ROIC (%) | 7.0 | 6.7 | 0.3PP | ― |
| ROE (%) | 7.7 | 9.0 | (1.3PP) | ― |
By segment, external sales for fiscal 2026 are forecast at ¥227.0 billion for Consumer Products (up 1.5%), ¥25.0 billion for Industrial Products (down 36.4%), ¥177.0 billion for Overseas (up 11.9%) and ¥1.0 billion for Other. The materials state that Overseas is expected to post significantly higher sales due to contribution from newly entered countries. The company also expects core operating income to increase by ¥4.3 billion on solid growth, improved profitability in overseas businesses and ongoing reform of the Consumer Products profit structure. Assumptions for fiscal 2026 include Dubai crude at US$70/BBL, domestic naphtha at ¥66,000/KL, crude palm oil at 4,400 RM/ton, and exchange rates of ¥155 to the U.S. dollar and ¥4.7 to the Thai baht.
| External sales by segment (Billions of yen) | 2026 Forecast | 2025 | Change (Amount) | Change (%) |
|---|---|---|---|---|
| Consumer Products | 227.0 | 223.7 | 3.2 | 1.5 |
| Industrial Products | 25.0 | 39.3 | (14.3) | (36.4) |
| Overseas | 177.0 | 158.1 | 18.8 | 11.9 |
| Other | 1.0 | 0.9 | 0.0 | 9.3 |
| Consolidated Total | 430.0 | 422.0 | 7.9 | 1.9 |
Shareholder Returns
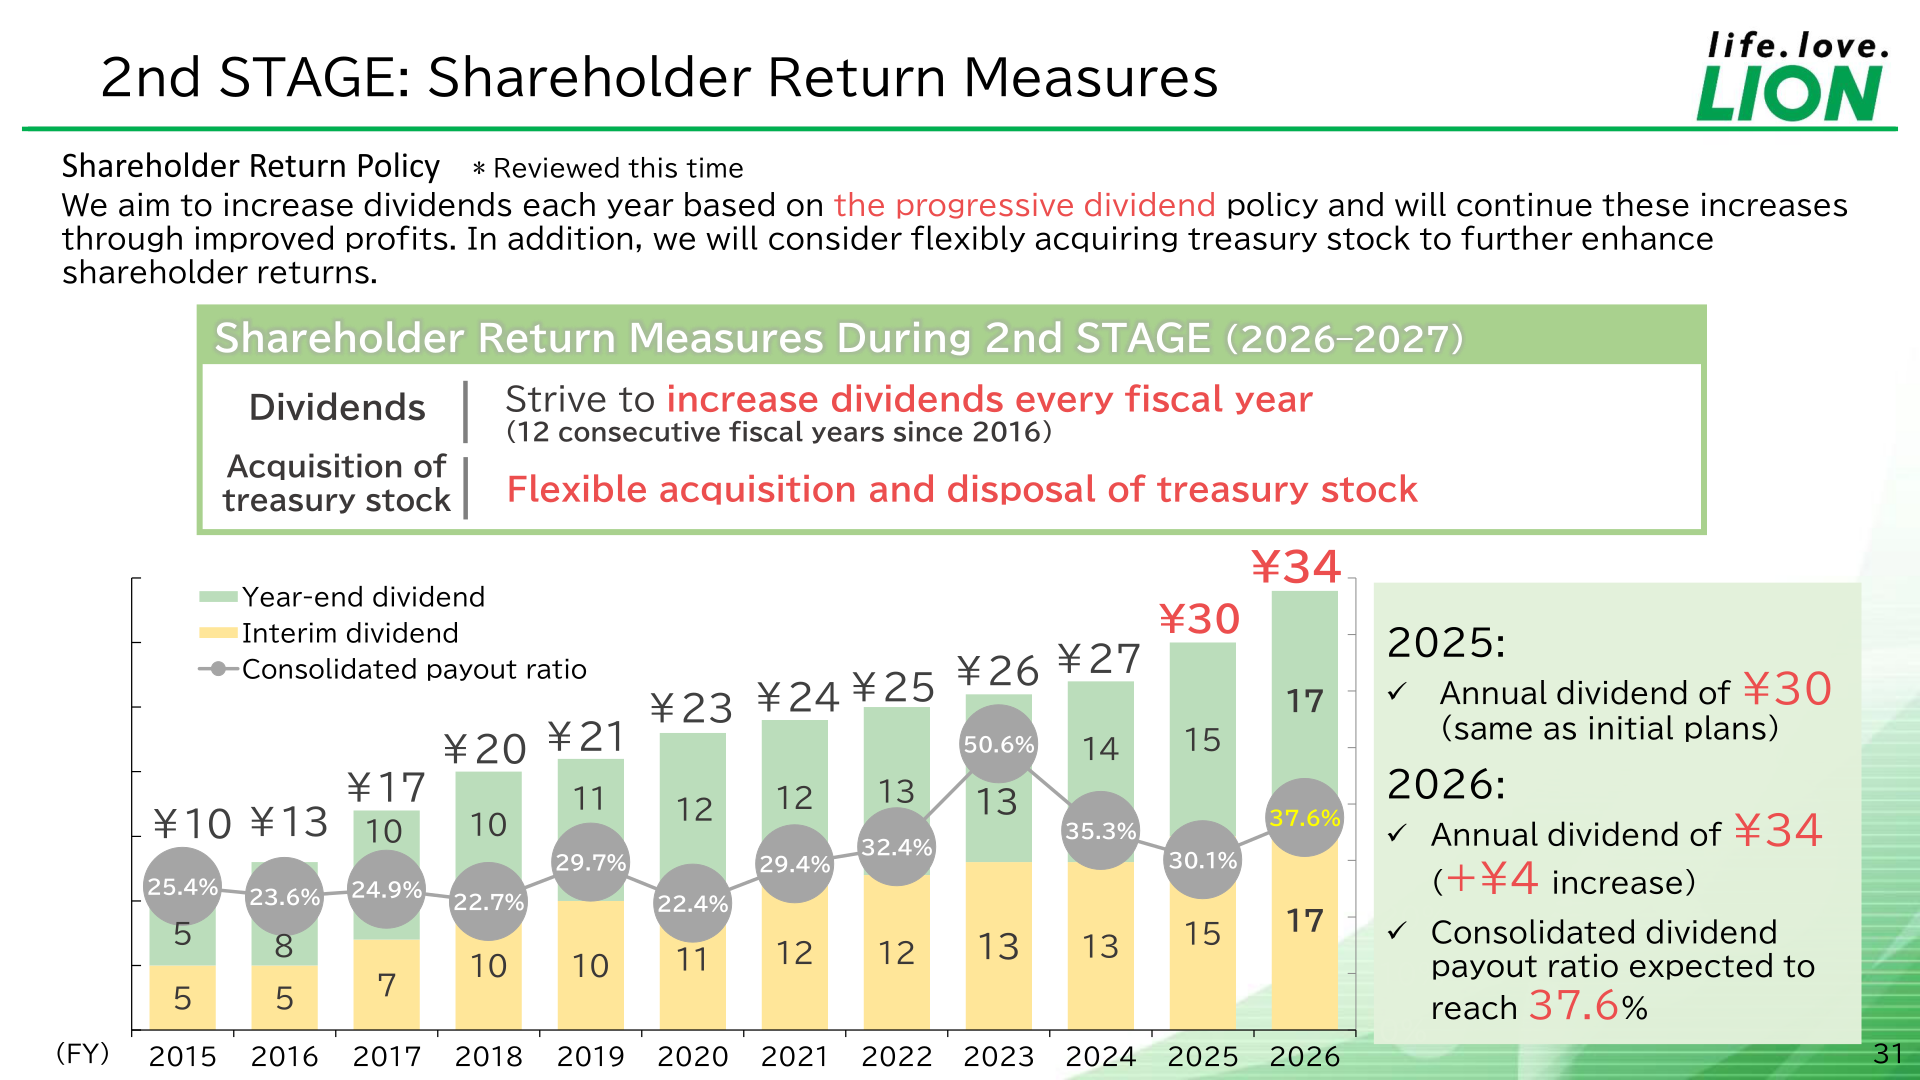
Lion states that it aims to increase dividends each year based on its progressive dividend policy and will continue these increases through improved profits, and that it will consider flexibly acquiring treasury stock to further enhance shareholder returns. The annual dividend for 2025 was ¥30, in line with initial plans. For 2026 the company plans an annual dividend of ¥34, an increase of ¥4, with a consolidated dividend payout ratio expected to reach 37.6%. The presentation notes the company has striven to increase dividends every fiscal year for 12 consecutive fiscal years since 2016. Under the 2nd STAGE capital allocation plan for 2026–2027, three-year cash inflows are shown as operating cash flows plus other of approximately ¥150 billion together with proceeds from the sale of the two chemical products subsidiaries and debt financing, with growth investments of approximately ¥50 billion or more, dividends and consideration of share buybacks on the outflow side.
| Item | 2025 | 2026 (Plan) |
|---|---|---|
| Annual dividend per share | ¥30 | ¥34 |
| Year-on-year change | ― | +¥4 |
| Consolidated payout ratio | 30.1% | 37.6% |
Medium-Term Plan / Topics
Fiscal 2025 was the first year of the 2nd STAGE of Vision2030. The 2027 key indicator targets are an EBITDA margin of 13% or higher, ROIC of 8–9% and EPS CAGR of 11% or higher. On progress in fiscal 2025, Group oral healthcare sales grew 5.2% year on year against a 2027 target of a CAGR at the 8% level; overseas sales growth was 3.6% (external net sales up 4.9%) against a CAGR target at the 10% level, which the company describes as behind its initial forecast for the growth rate of +5.8% while profit improvement progressed as expected; the overseas EBITDA margin improved 0.7 points versus fiscal 2024 against an approximately +2 point target; and the Consumer Products EBITDA margin improved 1.4 points versus fiscal 2024 against an approximately +3 to +5 point target. Key initiative results for 2025 include a ¥3.6 billion impact from the shift toward high value-added products and upward price revisions (against a 2025 target of ¥3.5 billion) and a reduction of 65 SKUs (against a target of 50–60 SKUs). The 2026 KPIs are ¥3.0 billion from the shift to high value-added products and upward price revisions, and a reduction of 40–50 SKUs.
On portfolio actions, Lion acquired 100% of the shares of PNB Consolidated Pty Ltd of Australia in 2026; PNB is centered on the Sukin natural beauty care brand, holds the number one position in natural beauty care brand sales in the Australian beauty care market, sells in over 20 countries and regions, and has net sales of approximately ¥8 billion based on 2025 results and total sales. Separately, the company resolved to transfer the shares of two chemical product subsidiaries, Lion Specialty Chemicals Co., Ltd. and PT.IPPOSHA INDONESIA, to AP88 Co., Ltd., a special purpose company supported by a fund serviced by Advantage Partners, Inc., with a tentative transfer date of June 30, 2026; the two companies had combined net sales of approximately ¥27 billion and a core operating income ratio of over 5% on 2025 results, and the materials state the impacts of the transfer have already been factored into the fiscal 2026 forecast. From January 2026 the company also shifted to a business unit system integrating purchasing, production, development, marketing and sales, with authority delegated to business units to accelerate decision-making.
This article is an analysis based on publicly available information and is not a recommendation to buy or sell any specific securities. Investment decisions are your own responsibility.
![[Obayashi] Investors’ Guide 2026 — The Complete 24-Article Breakdown](https://japan-equity.com/wp-content/uploads/2026/07/hub_cover-1024x1024.png)
![[Obayashi] IR & SR Policy — Feeding Dialogue Back into Management](https://japan-equity.com/wp-content/uploads/2026/07/p32_sq-1024x1024.jpg)
![[Obayashi] Real Estate Development — 18.7% Margin, ¥287.7bn Unrealized Gains](https://japan-equity.com/wp-content/uploads/2026/07/p20_sq-1024x1024.jpg)
![[Obayashi] Domestic Civil Engineering — Resilience Spending Supports 9.6% Margin](https://japan-equity.com/wp-content/uploads/2026/07/p11_sq-1024x1024.jpg)
![[Obayashi] Share Price & External Ratings — vs TOPIX, ESG Index Inclusion](https://japan-equity.com/wp-content/uploads/2026/07/p40_sq-1024x1024.jpg)
![[Construction] ¥75.5tn Investment, Shrinking Workforce — Big-5 Market Share](https://japan-equity.com/wp-content/uploads/2026/07/p12_sq-1024x1024.jpg)



![[Obayashi] Capital Policy & Shareholder Returns — ROE 10%+, DOE ~5%, ¥100bn Buyback](https://japan-equity.com/wp-content/uploads/2026/07/p27_sq-1024x1024.jpg)
![[Obayashi] Reducing Cross-Shareholdings — ¥285.2bn Sold in Five Years](https://japan-equity.com/wp-content/uploads/2026/07/p29_sq-1024x1024.jpg)
![[Obayashi] ¥750bn Investment Plan — ¥300bn to Development, ¥190bn to Tech/DX](https://japan-equity.com/wp-content/uploads/2026/07/p30_sq-1024x1024.jpg)
![[Obayashi] MTP2022 KPIs — Operating Profit ~2x Target, ROE 14.4%](https://japan-equity.com/wp-content/uploads/2026/07/p25_sq-1024x1024.jpg)
![[Obayashi] Cash Allocation — ¥420bn Investment CF Over Five Years](https://japan-equity.com/wp-content/uploads/2026/07/p26_sq-1024x1024.jpg)
![[Obayashi] Green Energy — 44 Plants, 344MW, and the Green Hydrogen Challenge](https://japan-equity.com/wp-content/uploads/2026/07/p21_sq-1024x1024.jpg)
![[Obayashi] Tackling the Labor Shortage — Robotics Construction®](https://japan-equity.com/wp-content/uploads/2026/07/p14_sq-1024x1024.jpg)
