
This article is based on publicly available IR materials and is not a recommendation to buy or sell any specific securities.
Yorozu Corporation reported FY2025 (ended March 31, 2026) sales of 176,330 million yen, down 2,084 million yen or 1.2% year on year, while operating income rose 3,682 million yen to 3,980 million yen and net income attributable to owners of the parent company recovered to 2,075 million yen from a loss of 13,448 million yen a year earlier. Sales decreased mainly due to a decline in production volumes in Japan and Asia, the impact of foreign exchange translation resulting from a strong yen in the Americas, and a decrease in tooling sales, while operating income increased owing to improvements in quality and the Group-wide promotion of rationalization activities under “Success 25V.” All four headline items also came in above the latest forecast released on February 13, 2026. For FY2026 the company forecasts sales of 166,000 million yen and operating income of 3,300 million yen.
Consolidated Results (Full-Year Actual)
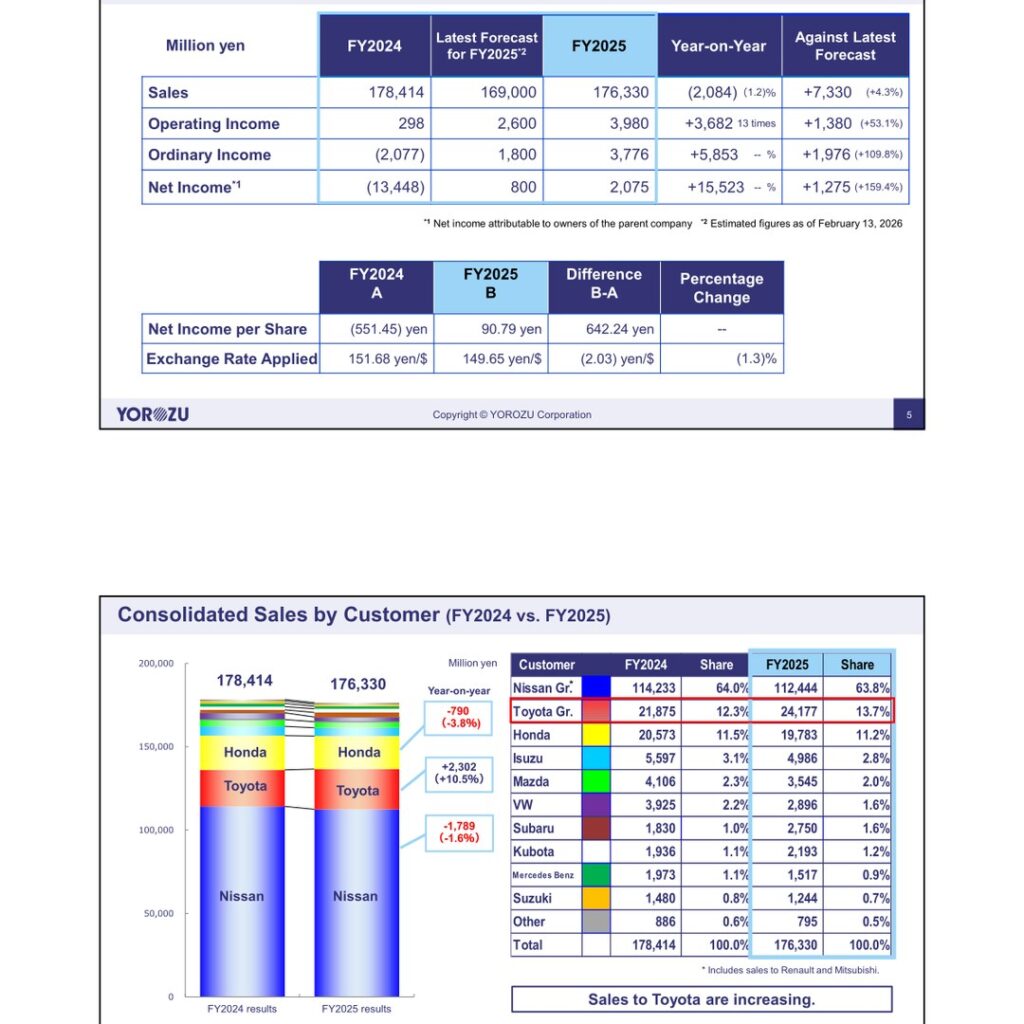
Against the latest forecast published on February 13, 2026, sales exceeded the plan by 7,330 million yen (+4.3%) and operating income by 1,380 million yen (+53.1%). The company attributes the beat to cost recovery, “Success 25V” rationalization kaizen efforts, and other factors. Net income per share was 90.79 yen against a loss of 551.45 yen per share in FY2024, and the exchange rate applied was 149.65 yen/$ versus 151.68 yen/$ in the prior year.
| Million yen | FY2024 | Latest Forecast for FY2025 | FY2025 | Year-on-Year | Against Latest Forecast |
|---|---|---|---|---|---|
| Sales | 178,414 | 169,000 | 176,330 | (2,084) (1.2)% | +7,330 (+4.3%) |
| Operating Income | 298 | 2,600 | 3,980 | +3,682 13 times | +1,380 (+53.1%) |
| Ordinary Income | (2,077) | 1,800 | 3,776 | +5,853 — % | +1,976 (+109.8%) |
| Net Income (attributable to owners of the parent company) | (13,448) | 800 | 2,075 | +15,523 — % | +1,275 (+159.4%) |
The deck breaks down the 3,682 million yen year-on-year increase in operating income as follows: streamlining efforts and cost recovery +4,744, reduction in FY2024 one-time costs +1,118, and increased units (excluding China) +222, against decreased units (in China) (576), preparation costs for YSMC full production (886), dies and equipment (820), and others (120).
Results by Region
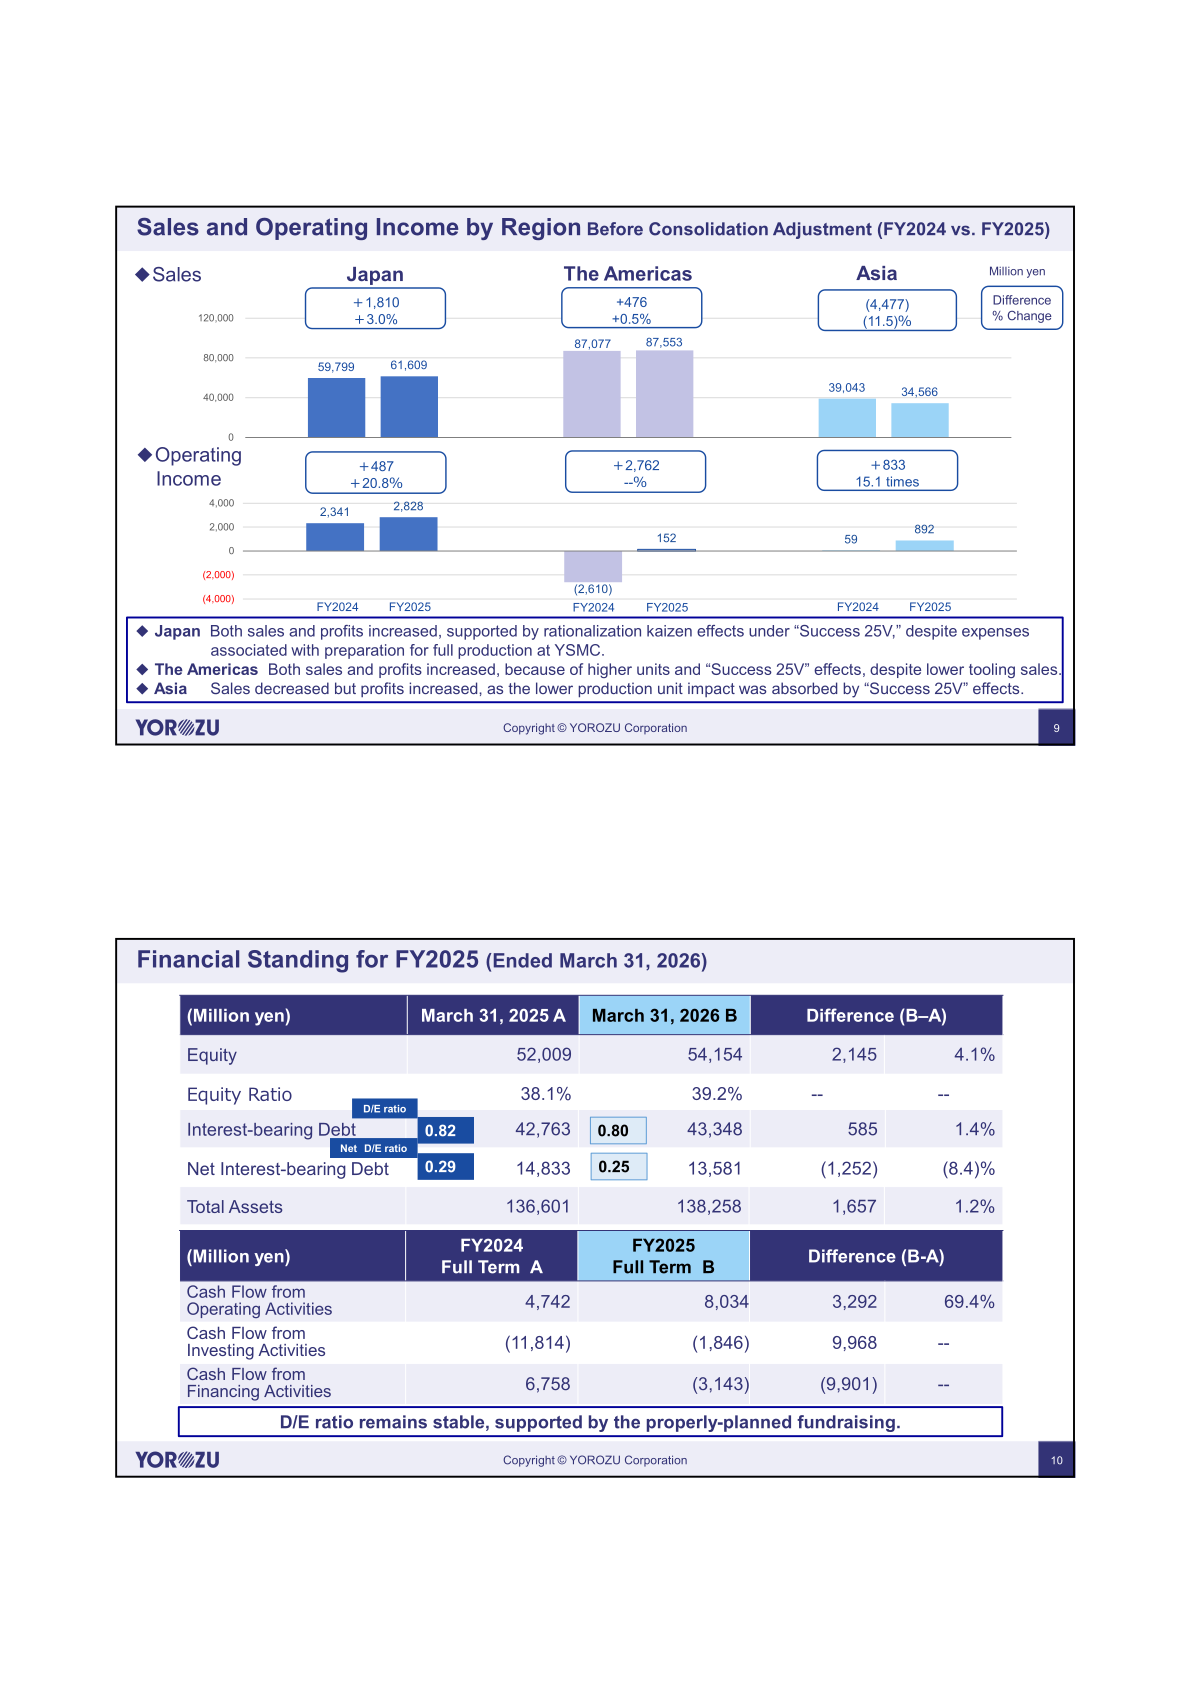
On a before-consolidation-adjustment basis, Japan saw both sales and profits increase, supported by rationalization kaizen effects under “Success 25V,” despite expenses associated with preparation for full production at YSMC. The Americas also grew sales and profits on higher units and “Success 25V” effects, despite lower tooling sales, swinging from an operating loss of 2,610 million yen to a profit of 152 million yen. In Asia sales decreased but profits increased, as the lower production unit impact was absorbed by “Success 25V” effects.
| Region | Metric (Million yen) | FY2024 | FY2025 | Difference | % Change |
|---|---|---|---|---|---|
| Japan | Sales | 59,799 | 61,609 | +1,810 | +3.0% |
| The Americas | Sales | 87,077 | 87,553 | +476 | +0.5% |
| Asia | Sales | 39,043 | 34,566 | (4,477) | (11.5)% |
| Japan | Operating Income | 2,341 | 2,828 | +487 | +20.8% |
| The Americas | Operating Income | (2,610) | 152 | +2,762 | –% |
| Asia | Operating Income | 59 | 892 | +833 | 15.1 times |
Sales by Customer
The Nissan Group remained the largest customer at 112,444 million yen, or 63.8% of consolidated sales, down 1,789 million yen (-1.6%) year on year. Sales to the Toyota Group rose 2,302 million yen (+10.5%) to 24,177 million yen, lifting its share to 13.7% from 12.3%. The deck notes that sales to Toyota are increasing.
| Customer | FY2024 | Share | FY2025 | Share |
|---|---|---|---|---|
| Nissan Gr.* | 114,233 | 64.0% | 112,444 | 63.8% |
| Toyota Gr. | 21,875 | 12.3% | 24,177 | 13.7% |
| Honda | 20,573 | 11.5% | 19,783 | 11.2% |
| Isuzu | 5,597 | 3.1% | 4,986 | 2.8% |
| Mazda | 4,106 | 2.3% | 3,545 | 2.0% |
| VW | 3,925 | 2.2% | 2,896 | 1.6% |
| Subaru | 1,830 | 1.0% | 2,750 | 1.6% |
| Kubota | 1,936 | 1.1% | 2,193 | 1.2% |
| Mercedes Benz | 1,973 | 1.1% | 1,517 | 0.9% |
| Suzuki | 1,480 | 0.8% | 1,244 | 0.7% |
| Other | 886 | 0.6% | 795 | 0.5% |
| Total | 178,414 | 100.0% | 176,330 | 100.0% |
* Includes sales to Renault and Mitsubishi. Figures are in millions of yen.
Financial Position and Cash Flows
Total assets rose 1,657 million yen to 138,258 million yen as of March 31, 2026, and equity increased 2,145 million yen to 54,154 million yen, lifting the equity ratio to 39.2% from 38.1%. The D/E ratio improved to 0.80 from 0.82 and the net D/E ratio to 0.25 from 0.29; the deck states that the D/E ratio remains stable, supported by properly-planned fundraising. Operating cash flow rose 69.4% to 8,034 million yen, while the cash outflow from investing activities narrowed to 1,846 million yen.
| Million yen | March 31, 2025 A / FY2024 | March 31, 2026 B / FY2025 | Difference (B-A) | % Change |
|---|---|---|---|---|
| Equity | 52,009 | 54,154 | 2,145 | 4.1% |
| Equity Ratio | 38.1% | 39.2% | — | — |
| Interest-bearing Debt | 42,763 | 43,348 | 585 | 1.4% |
| Net Interest-bearing Debt | 14,833 | 13,581 | (1,252) | (8.4)% |
| Total Assets | 136,601 | 138,258 | 1,657 | 1.2% |
| Cash Flow from Operating Activities | 4,742 | 8,034 | 3,292 | 69.4% |
| Cash Flow from Investing Activities | (11,814) | (1,846) | 9,968 | — |
| Cash Flow from Financing Activities | 6,758 | (3,143) | (9,901) | — |
FY2026 Forecast
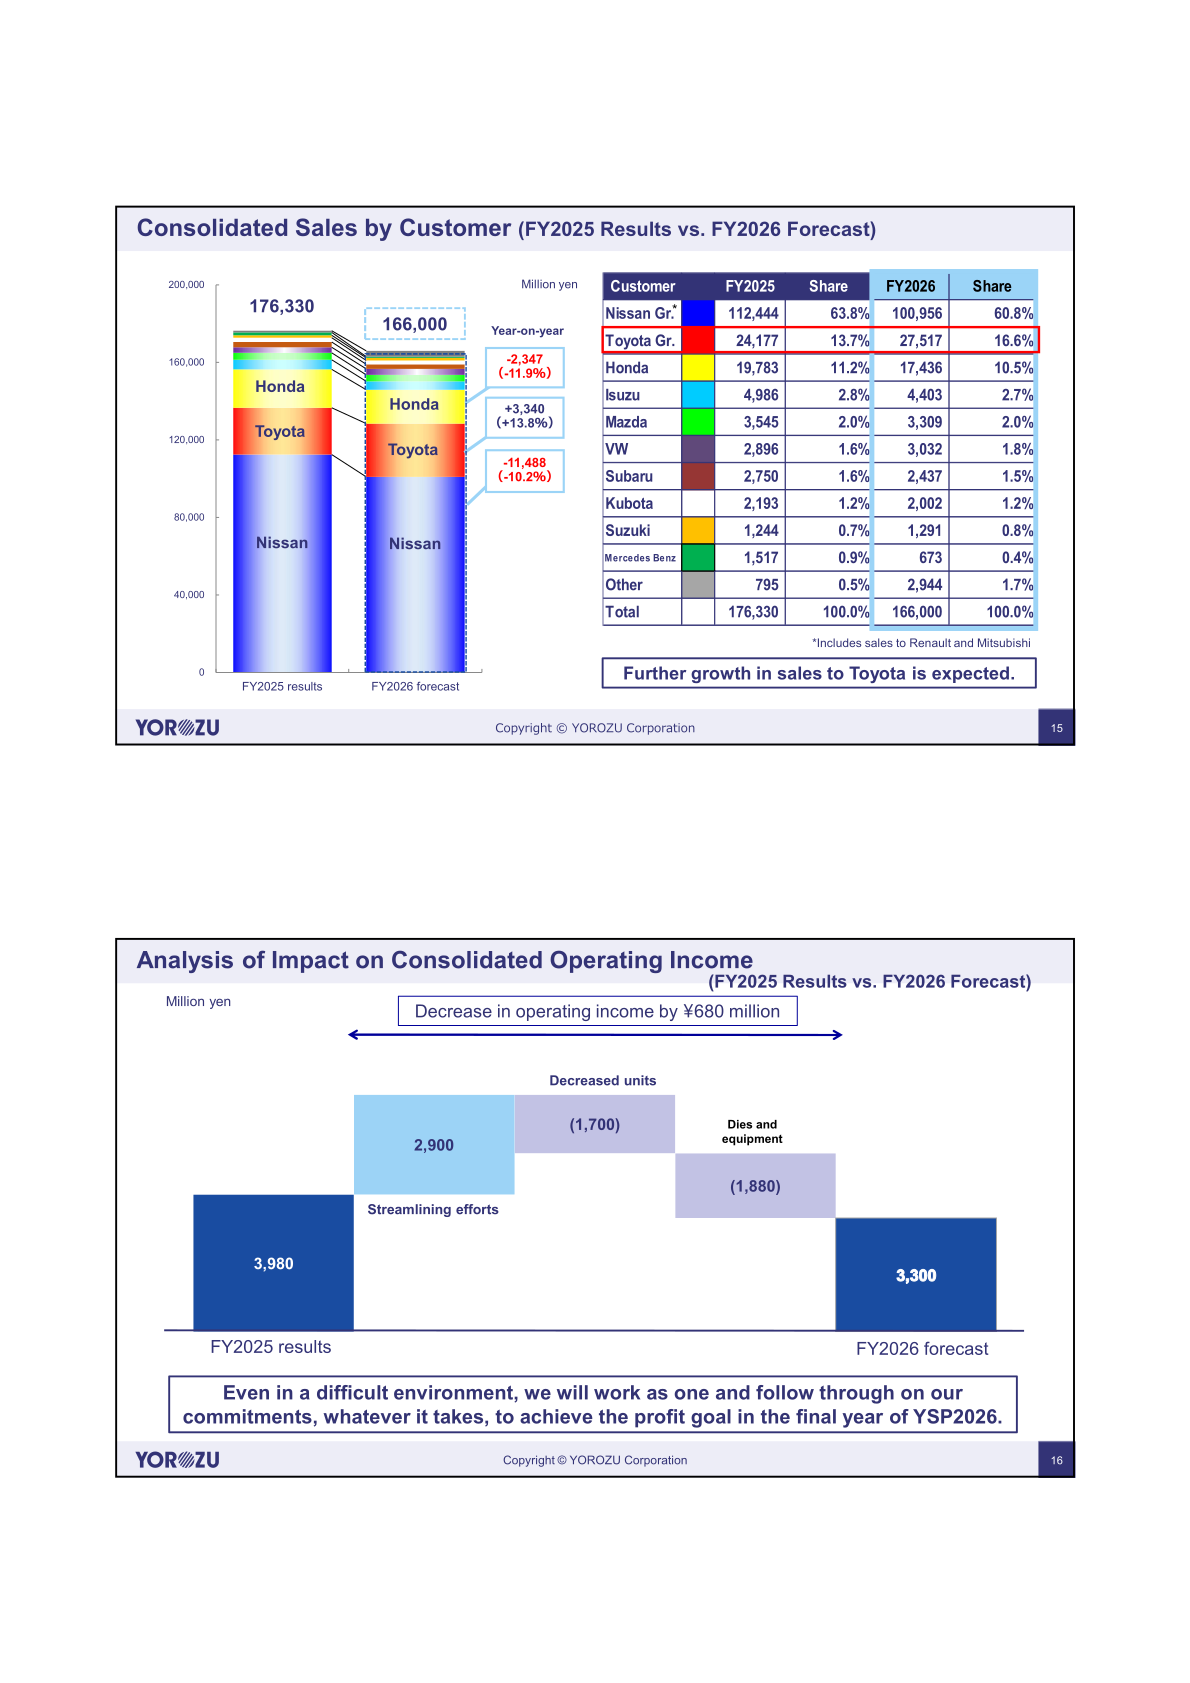
For FY2026 the company assumes a decrease in output volume delivered to the Middle East and a surge in crude oil-based material prices, both of which are reflected in the forecast, while it continues to pay close attention to customers shifting production from Japan and overseas to their U.S. plants and to U.S.-China tensions affecting the economy and supply chain. Net income per share is forecast at 53 yen and the exchange rate applied at 150 yen/$. Yorozu says it will continue to focus on group-wide Success 26V rationalization kaizen initiatives from FY2025 and that, despite the lack of anticipated growth in new vehicle demand, it aims to achieve an operating income ratio of 2.0% or higher. The 680 million yen decrease in operating income is explained by streamlining efforts of +2,900 against decreased units of (1,700) and dies and equipment of (1,880).
| Million yen | FY2025 Results A | Sales Ratio | FY2026 Forecast B | Sales Ratio | Difference B-A | Percentage Change |
|---|---|---|---|---|---|---|
| Sales | 176,330 | 100.0% | 166,000 | 100.0% | (10,330) | (5.9)% |
| Operating Income | 3,980 | 2.3% | 3,300 | 2.0% | (680) | (17.1)% |
| Ordinary Income | 3,776 | 2.1% | 2,100 | 1.3% | (1,676) | (44.4)% |
| Net Income (attributable to owners of the parent) | 2,075 | 1.2% | 1,100 | 0.7% | (975) | (47.0)% |
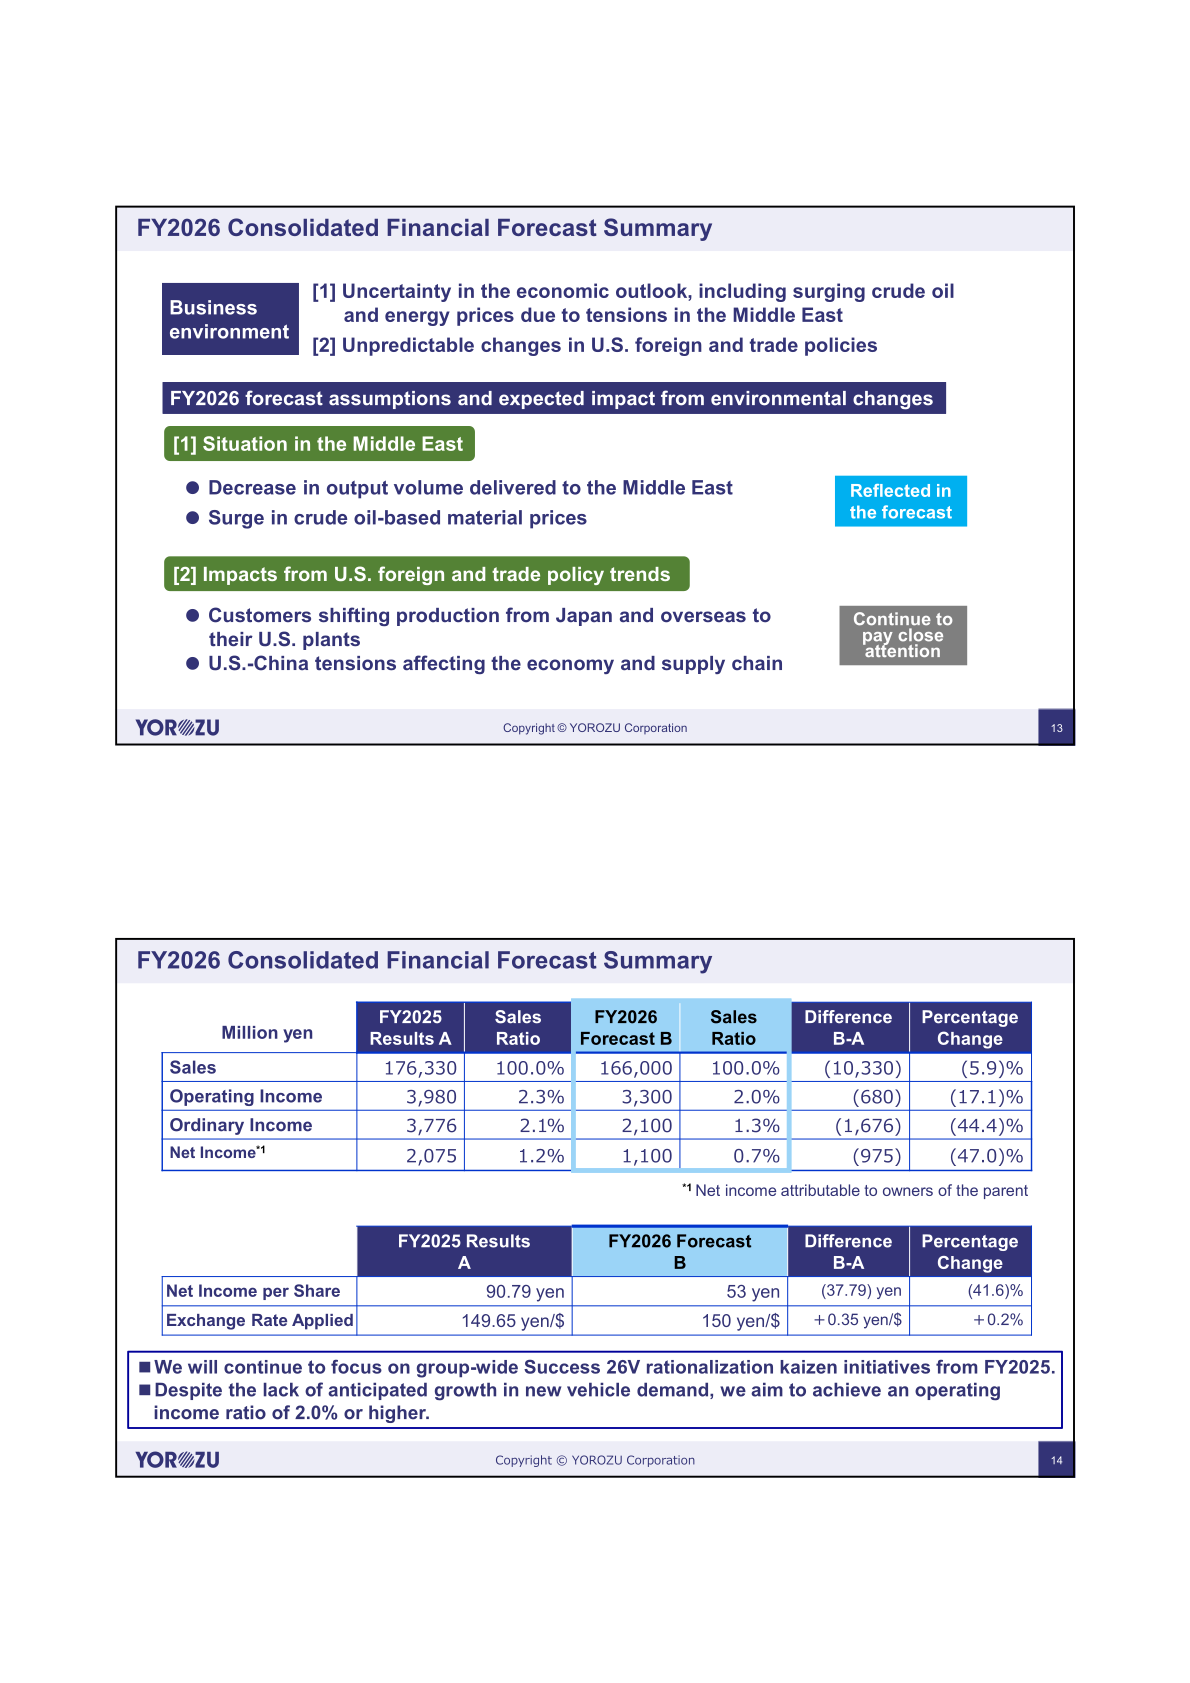
By customer, the FY2026 plan assumes Nissan Group sales of 100,956 million yen (-11,488, -10.2%), Toyota Group sales of 27,517 million yen (+3,340, +13.8%) and Honda sales of 17,436 million yen (-2,347, -11.9%), lifting the Toyota Group share to 16.6%. The deck states that further growth in sales to Toyota is expected.
Shareholder Returns
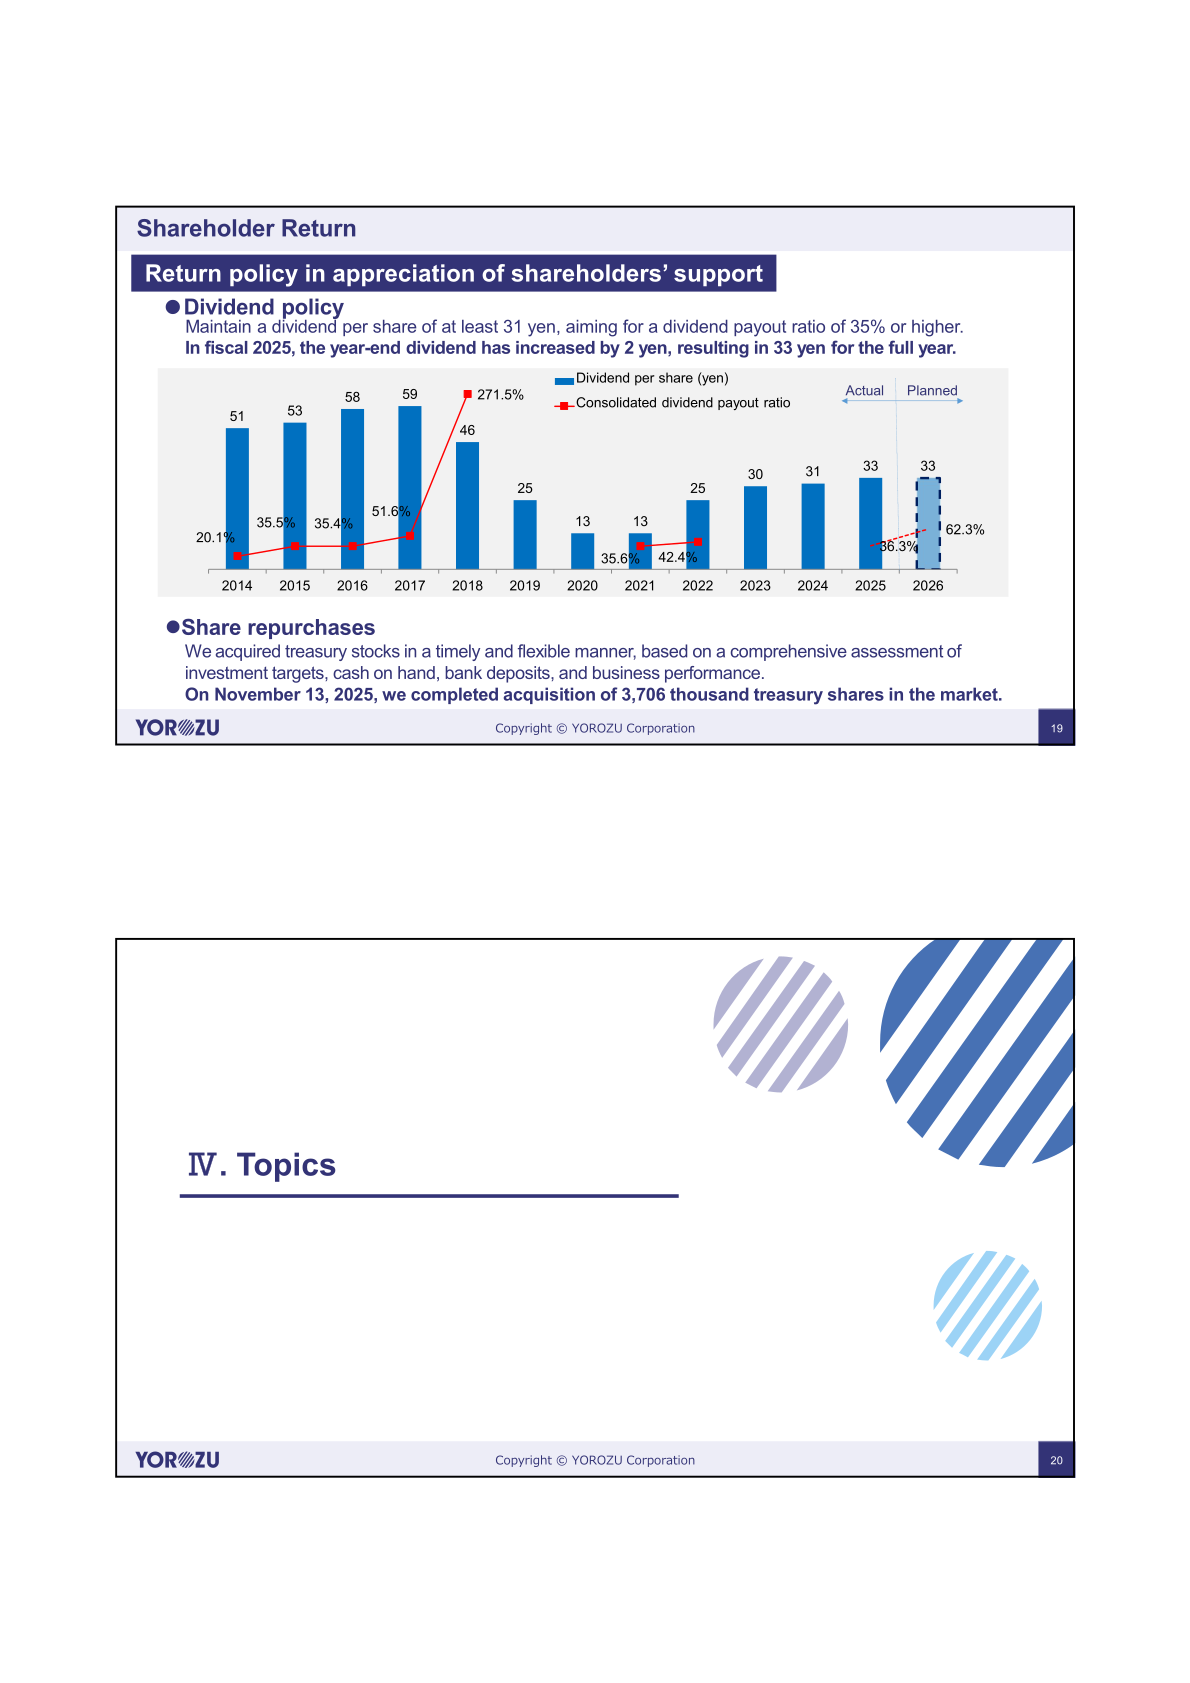
Yorozu’s dividend policy is to maintain a dividend per share of at least 31 yen, aiming for a dividend payout ratio of 35% or higher. In fiscal 2025 the year-end dividend was increased by 2 yen, resulting in 33 yen for the full year, against 31 yen in fiscal 2024, with a consolidated dividend payout ratio of 36.3%. The chart also shows a planned dividend of 33 yen for fiscal 2026, with a payout ratio of 62.3%. On share repurchases, the company says it acquires treasury stock in a timely and flexible manner based on a comprehensive assessment of investment targets, cash on hand, bank deposits, and business performance, and that on November 13, 2025 it completed the acquisition of 3,706 thousand treasury shares in the market.
Medium-Term Plan (YSP2026) and Topics
FY2026 is the final year of the medium-term business plan YSP2026, whose performance targets are sales of 210 billion yen, an operating income ratio of 4.5% and ROE of 8.0%. The FY2026 action policy is to apply the final touches to YSP2026 while preparing for the next medium-term plan covering FY2027 to FY2029.
On topics, YSMC goes into full-scale operation with full production from FY2026, and the company aims to increase sales to Toyota as the second pillar of its business after Nissan, working to expand sales aiming for a share of 20%. The Global Kaizen BanK (GKBK) system now has 1,500 kaizen items registered. Die lead time, which was around six months in FY2023, is now ready for a four-month lead time in FY2025 against a FY2026 target of three months. On the environment, CO2 emissions were reduced by 33% in FY2025 against the FY2026 target of 40%. The company was also certified as an Excellent Enterprise for Health and Productivity Management 2026 in both the Large Enterprise Category and the Small- and Medium-sized Enterprise Category Bright 500, and granted Platinum Kurumin certification.
This article is an analysis based on publicly available information and is not a recommendation to buy or sell any specific securities. Investment decisions are your own responsibility.
![[Obayashi] Investors’ Guide 2026 — The Complete 24-Article Breakdown](https://japan-equity.com/wp-content/uploads/2026/07/hub_cover-1024x1024.png)
![[Obayashi] IR & SR Policy — Feeding Dialogue Back into Management](https://japan-equity.com/wp-content/uploads/2026/07/p32_sq-1024x1024.jpg)
![[Obayashi] Real Estate Development — 18.7% Margin, ¥287.7bn Unrealized Gains](https://japan-equity.com/wp-content/uploads/2026/07/p20_sq-1024x1024.jpg)
![[Obayashi] Domestic Civil Engineering — Resilience Spending Supports 9.6% Margin](https://japan-equity.com/wp-content/uploads/2026/07/p11_sq-1024x1024.jpg)
![[Obayashi] Share Price & External Ratings — vs TOPIX, ESG Index Inclusion](https://japan-equity.com/wp-content/uploads/2026/07/p40_sq-1024x1024.jpg)
![[Construction] ¥75.5tn Investment, Shrinking Workforce — Big-5 Market Share](https://japan-equity.com/wp-content/uploads/2026/07/p12_sq-1024x1024.jpg)



![[Obayashi] Capital Policy & Shareholder Returns — ROE 10%+, DOE ~5%, ¥100bn Buyback](https://japan-equity.com/wp-content/uploads/2026/07/p27_sq-1024x1024.jpg)
![[Obayashi] Reducing Cross-Shareholdings — ¥285.2bn Sold in Five Years](https://japan-equity.com/wp-content/uploads/2026/07/p29_sq-1024x1024.jpg)
![[Obayashi] ¥750bn Investment Plan — ¥300bn to Development, ¥190bn to Tech/DX](https://japan-equity.com/wp-content/uploads/2026/07/p30_sq-1024x1024.jpg)
![[Obayashi] MTP2022 KPIs — Operating Profit ~2x Target, ROE 14.4%](https://japan-equity.com/wp-content/uploads/2026/07/p25_sq-1024x1024.jpg)
![[Obayashi] Cash Allocation — ¥420bn Investment CF Over Five Years](https://japan-equity.com/wp-content/uploads/2026/07/p26_sq-1024x1024.jpg)
![[Obayashi] Green Energy — 44 Plants, 344MW, and the Green Hydrogen Challenge](https://japan-equity.com/wp-content/uploads/2026/07/p21_sq-1024x1024.jpg)
![[Obayashi] Tackling the Labor Shortage — Robotics Construction®](https://japan-equity.com/wp-content/uploads/2026/07/p14_sq-1024x1024.jpg)
