
This article is based on publicly available IR materials and is not a recommendation to buy or sell any specific securities.
Note: Aisan Industry’s results presentation labels the fiscal year ended March 31, 2026 as “FY2025” (page 17 shows “FY2025 330.8 Billion yen”) and the fiscal year ending March 31, 2027 as “FY2026”; the labels in the tables and charts below are kept exactly as they appear in the materials.
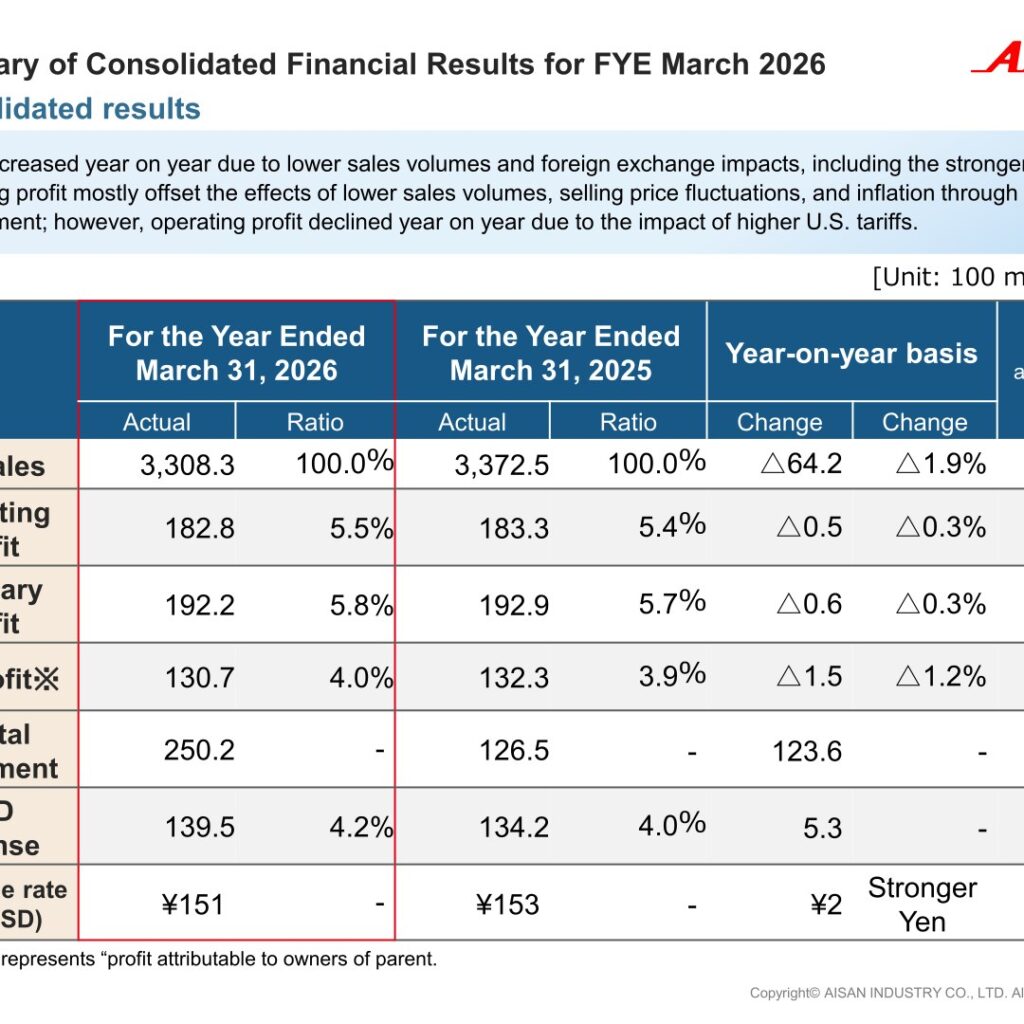
Aisan Industry, a Toyota Motor Group supplier whose sales are led by fuel pump modules, throttle bodies and canisters, reported net sales of 3,308.3 and operating profit of 182.8 (unit: 100 million yen) for the fiscal year ended March 31, 2026, changes of △1.9% and △0.3% year on year. The presentation states that sales decreased year on year due to lower sales volumes and foreign exchange impacts, including the stronger yen, and that operating profit mostly offset the effects of lower sales volumes, selling price fluctuations, and inflation through profit improvement; however, operating profit declined year on year due to the impact of higher U.S. tariffs. Both results came in above the annual forecast announced on February 2 for net sales, ordinary profit and net profit. For the fiscal year ending March 31, 2027, the company forecasts net sales of 3,350.0, up 1.3%, mainly due to the consolidation of TRIS Inc., with operating profit of 180.0.
Consolidated Results (Fiscal Year Ended March 31, 2026)
Net sales fell 64.2 year on year to 3,308.3, while the operating profit margin rose to 5.5% from 5.4%. Ordinary profit was 192.2 (5.8% of sales) and net profit — defined in the presentation as profit attributable to owners of parent — was 130.7 (4.0% of sales). Capital investment nearly doubled to 250.2 from 126.5, and R&D expense rose 5.3 to 139.5, equal to 4.2% of consolidated sales. The average exchange rate was ¥151 to the U.S. dollar, ¥2 stronger yen than the prior year. Figures below are in 100 million yen, as presented.
| Item | FY Ended March 31, 2026 (Actual) | FY Ended March 31, 2025 (Actual) | Change | Change (%) | Annual forecast announced on 2, Feb |
|---|---|---|---|---|---|
| Net sales | 3,308.3 | 3,372.5 | △64.2 | △1.9% | 3,200.0 |
| Operating profit | 182.8 | 183.3 | △0.5 | △0.3% | 185.0 |
| Ordinary profit | 192.2 | 192.9 | △0.6 | △0.3% | 190.0 |
| Net profit (profit attributable to owners of parent) | 130.7 | 132.3 | △1.5 | △1.2% | 125.0 |
| Capital Investment | 250.2 | 126.5 | 123.6 | – | 260.0 |
| R&D expense | 139.5 | 134.2 | 5.3 | – | 140.0 |
| Exchange rate (Yen/USD) | ¥151 | ¥153 | ¥2 Stronger Yen | – | ¥149 |
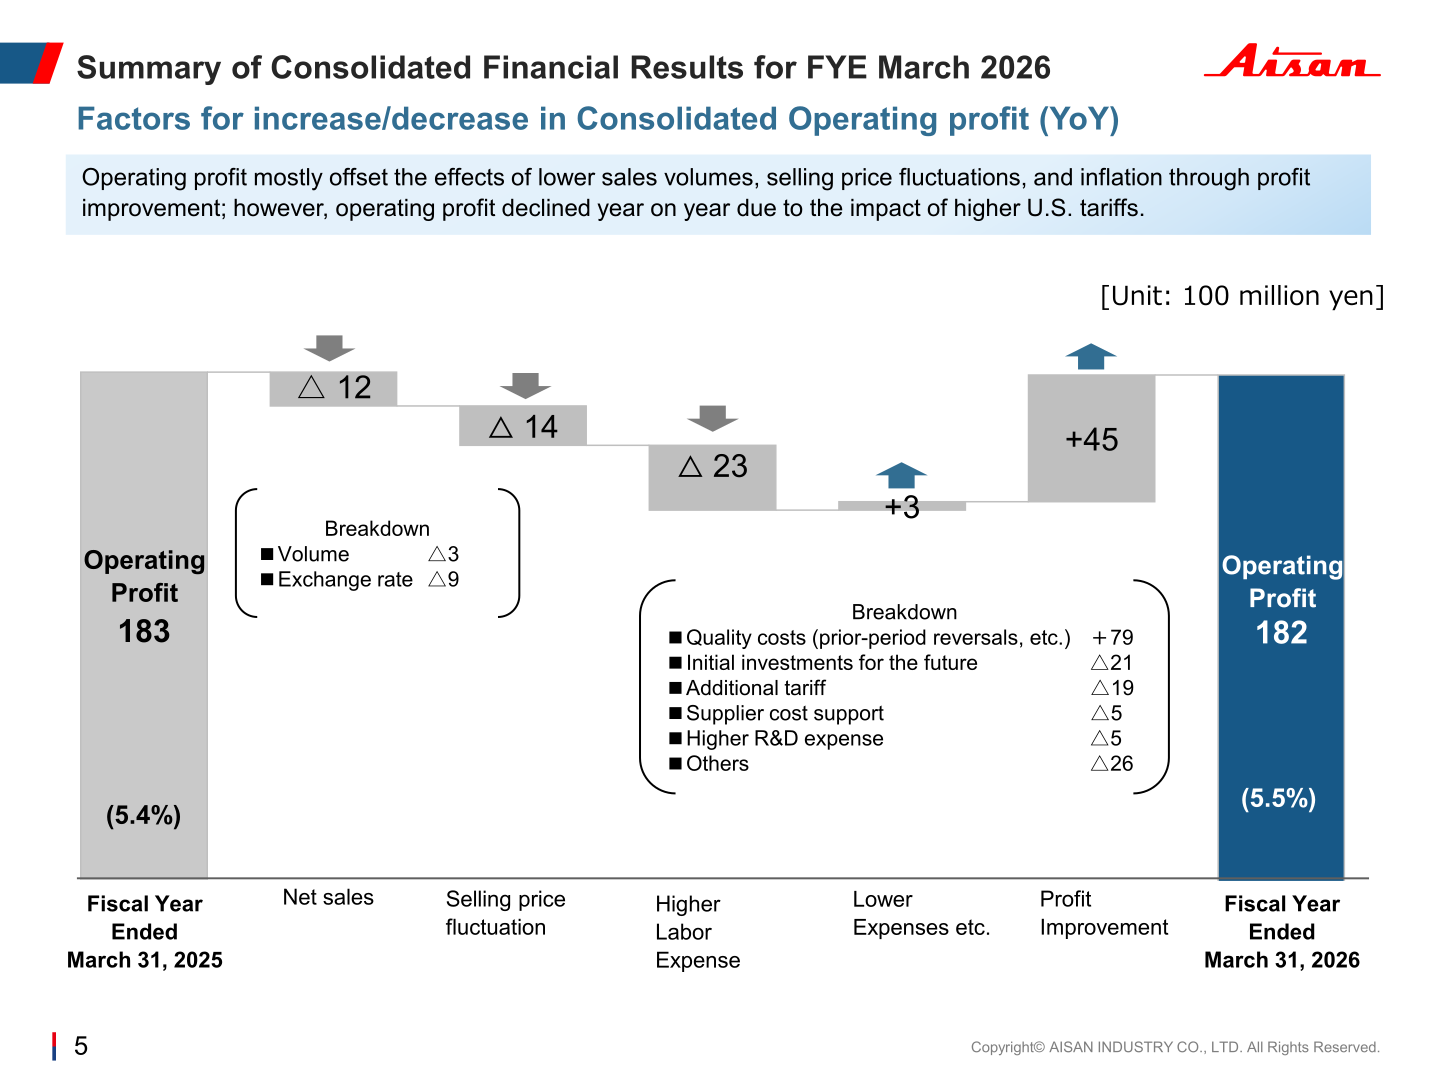
The operating profit bridge moves from 183 for the fiscal year ended March 31, 2025 (5.4%) to 182 for the fiscal year ended March 31, 2026 (5.5%). The factors shown are net sales △12 (breakdown: volume △3, exchange rate △9), selling price fluctuation △14, higher labor expense △23, lower expenses etc. +3, and profit improvement +45. The slide also breaks out quality costs (prior-period reversals, etc.) +79, initial investments for the future △21, additional tariff △19, supplier cost support △5, higher R&D expense △5, and others △26.
Performance by Location
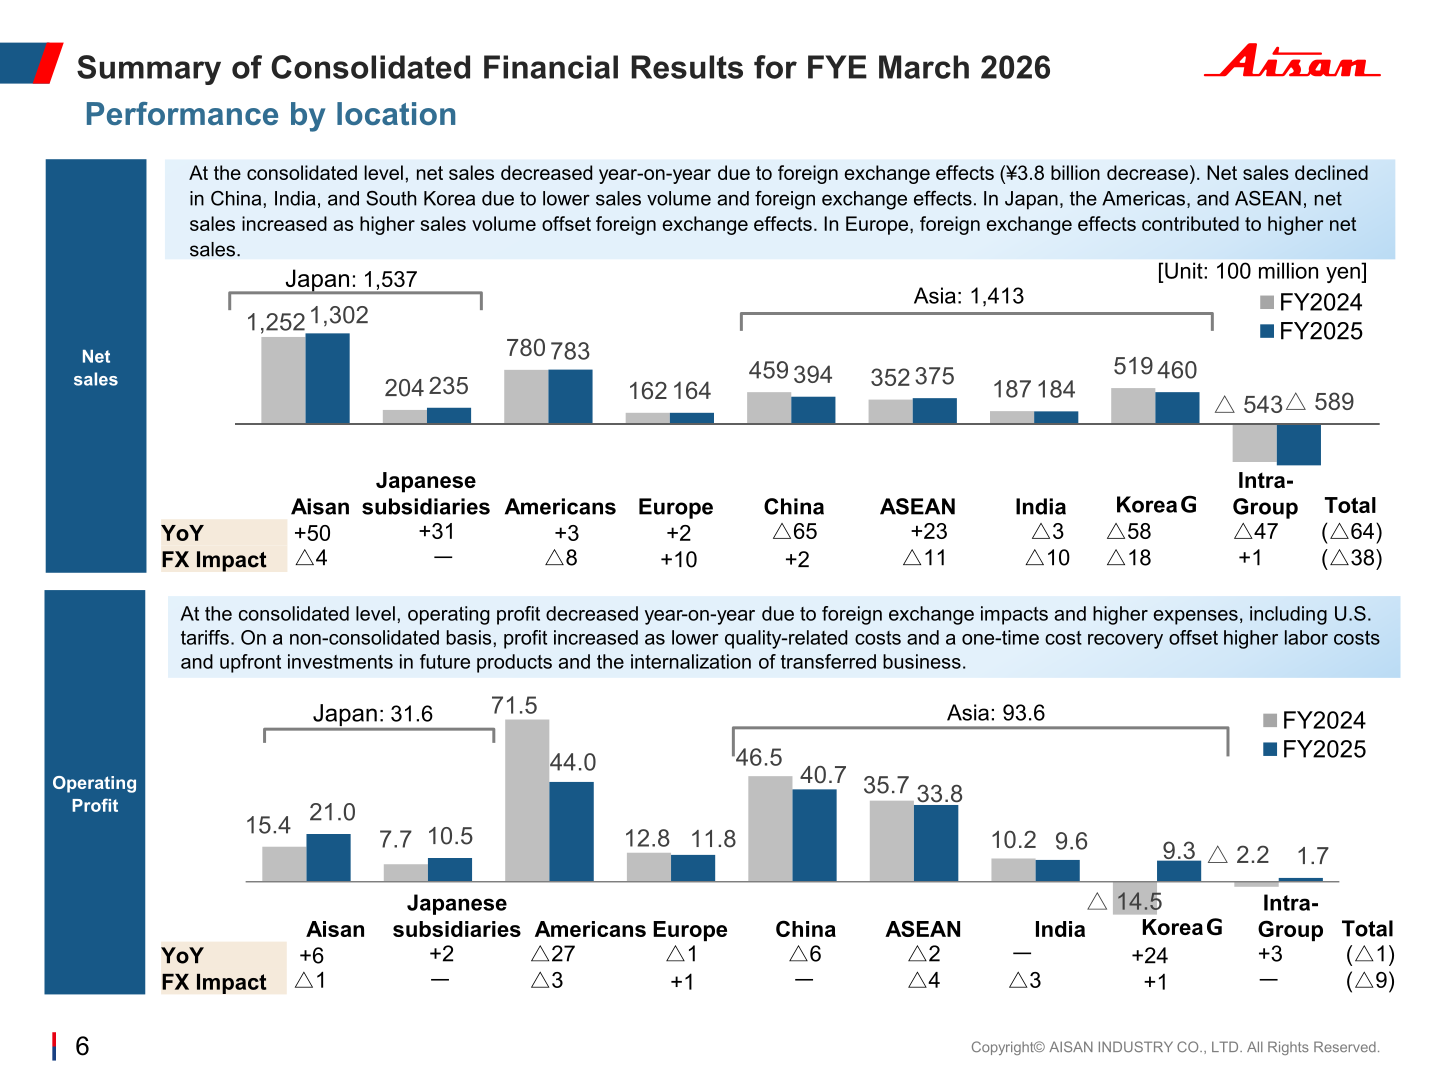
The presentation states that, at the consolidated level, net sales decreased year-on-year due to foreign exchange effects (¥3.8 billion decrease); net sales declined in China, India, and South Korea due to lower sales volume and foreign exchange effects, while in Japan, the Americas, and ASEAN net sales increased as higher sales volume offset foreign exchange effects, and in Europe foreign exchange effects contributed to higher net sales. On operating profit, it states that the consolidated decline reflected foreign exchange impacts and higher expenses, including U.S. tariffs, while on a non-consolidated basis profit increased as lower quality-related costs and a one-time cost recovery offset higher labor costs and upfront investments in future products and the internalization of transferred business. Japan totalled 1,537 in net sales and 31.6 in operating profit in FY2025, and Asia 1,413 and 93.6 respectively.
| Location | Net sales FY2024 | Net sales FY2025 | Operating profit FY2024 | Operating profit FY2025 |
|---|---|---|---|---|
| Aisan | 1,252 | 1,302 | 15.4 | 21.0 |
| Japanese subsidiaries | 204 | 235 | 7.7 | 10.5 |
| Americans | 780 | 783 | 71.5 | 44.0 |
| Europe | 162 | 164 | 12.8 | 11.8 |
| China | 459 | 394 | 46.5 | 40.7 |
| ASEAN | 352 | 375 | 35.7 | 33.8 |
| India | 187 | 184 | 10.2 | 9.6 |
| Korea G | 519 | 460 | △14.5 | 9.3 |
| Intra-Group | △543 | △589 | △2.2 | 1.7 |
| Japan (subtotal, FY2025) | – | 1,537 | – | 31.6 |
| Asia (subtotal, FY2025) | – | 1,413 | – | 93.6 |
FY2026 Forecast (Fiscal Year Ending March 31, 2027)
For the fiscal year ending March 31, 2027, net sales are expected to increase year on year, mainly due to the consolidation of TRIS Inc., while operating profit is expected to remain at a level comparable to the previous fiscal year, as declines in existing sales and higher depreciation expenses are offset by the consolidation of TRIS Inc. and profit improvement. The operating profit bridge for the forecast shows net sales △14 (volume △11, exchange rate △3), selling price fluctuation △19, higher labor expense △22, lower expenses etc. 8, and profit improvement 45, with the slide breaking out effects of TRIS acquisition +15, additional tariff +12, decrease in initial investments for the future +5, higher depreciation △15, and reversal of FYE Mar 2026 quality costs △9. Capital investment is planned at 240.0 with depreciation of 150, and R&D expense at 140.
| Item | Forecast for the Year Ended March 31, 2027 | Result for the Year Ended March 31, 2026 | Change | Change (%) |
|---|---|---|---|---|
| Net sales | 3,350.0 | 3,308.3 | 41.6 | 1.3% |
| Operating profit | 180.0 | 182.8 | △2.8 | △1.6% |
| Ordinary profit | 180.0 | 192.2 | △12.2 | △6.4% |
| Net profit (profit attributable to owners of parent) | 120.0 | 130.7 | △10.7 | △8.2% |
| Capital Investment | 240.0 | 250.2 | △10.2 | △4.1% |
| R&D expense | 140.0 | 139.5 | 0.4 | 0.3% |
| Exchange rate (Yen/USD) | ¥150 | ¥151 | ¥1 Stronger Yen | – |
| ROE | 8.2% | 9.4% | △1.2pt | – |
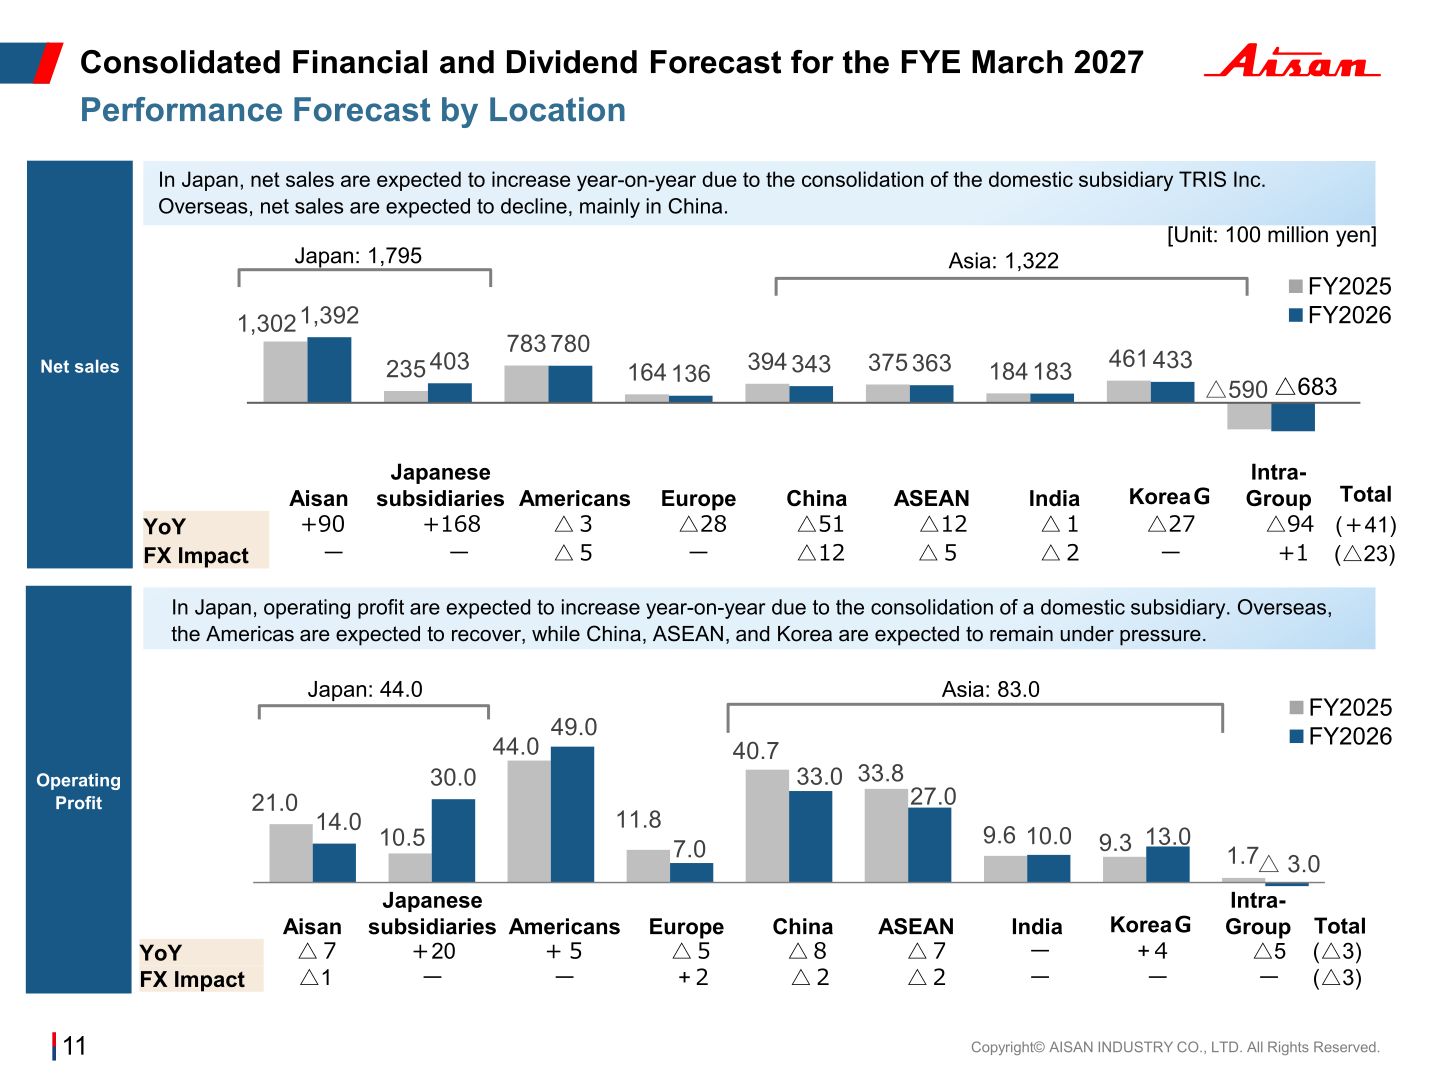
By location, the presentation states that in Japan net sales are expected to increase year-on-year due to the consolidation of the domestic subsidiary TRIS Inc., while overseas net sales are expected to decline, mainly in China. On operating profit, Japan is expected to increase due to the consolidation of a domestic subsidiary, the Americas are expected to recover, and China, ASEAN and Korea are expected to remain under pressure. Japan is forecast at 1,795 in net sales and 44.0 in operating profit, and Asia at 1,322 and 83.0.
| Location | Net sales FY2026 (Forecast) | Operating profit FY2026 (Forecast) |
|---|---|---|
| Aisan | 1,392 | 14.0 |
| Japanese subsidiaries | 403 | 30.0 |
| Americans | 780 | 49.0 |
| Europe | 136 | 7.0 |
| China | 343 | 33.0 |
| ASEAN | 363 | 27.0 |
| India | 183 | 10.0 |
| Korea G | 433 | 13.0 |
| Intra-Group | △683 | △3.0 |
| Japan (subtotal) | 1,795 | 44.0 |
| Asia (subtotal) | 1,322 | 83.0 |
Shareholder Returns
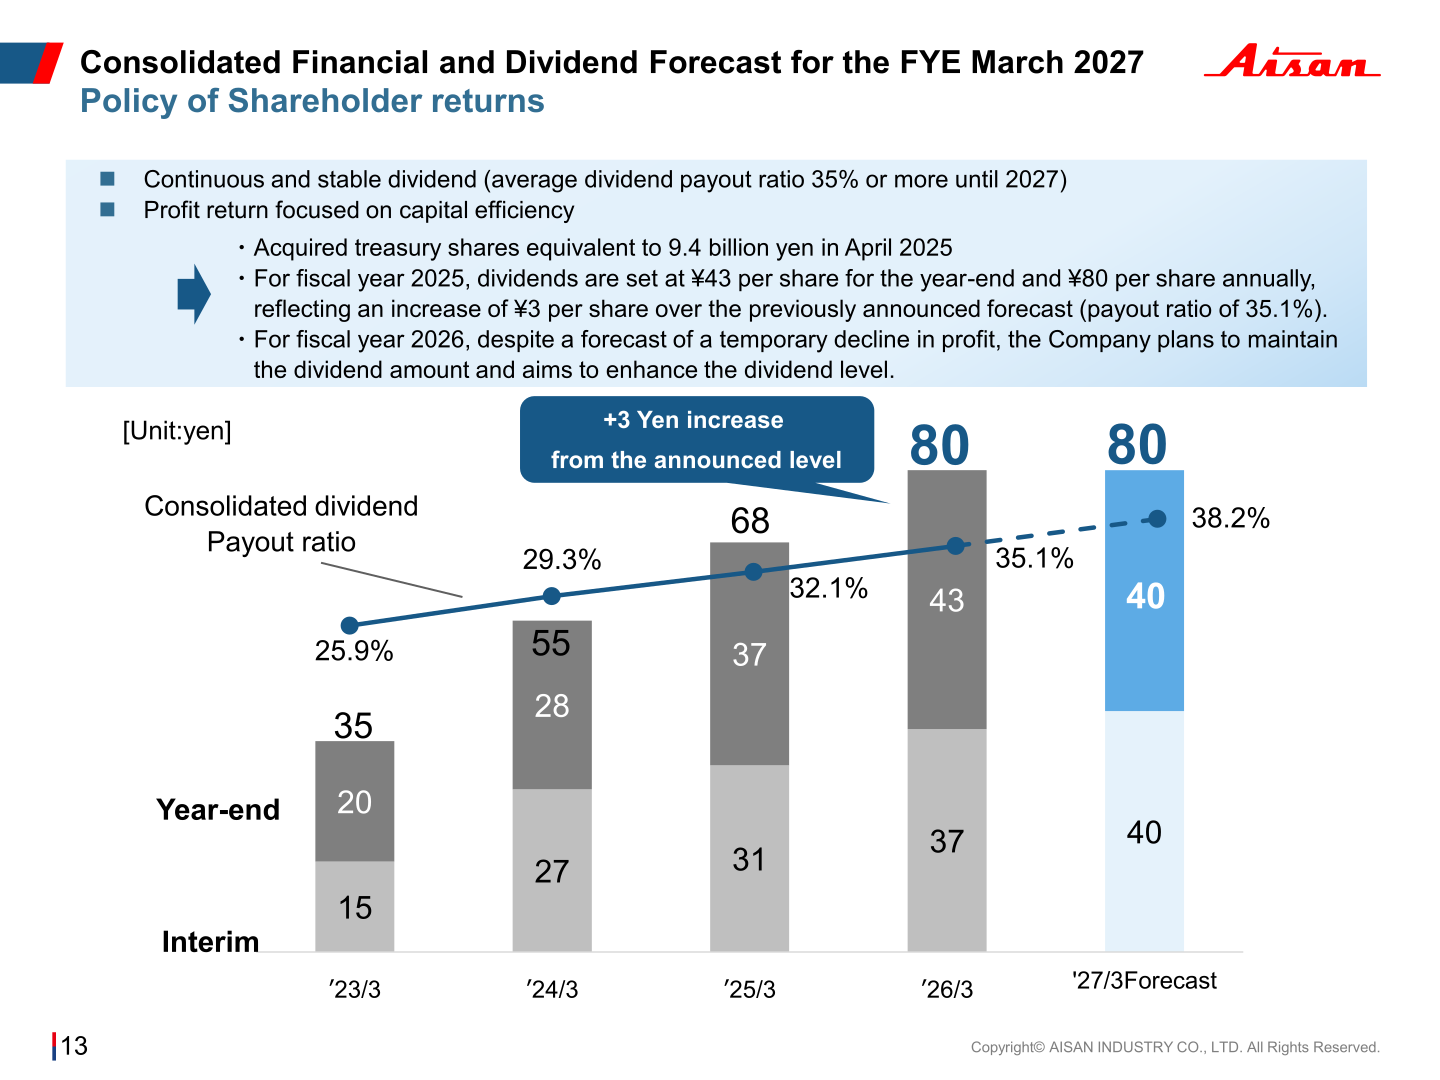
The policy shown is continuous and stable dividend (average dividend payout ratio 35% or more until 2027) and profit return focused on capital efficiency. The company acquired treasury shares equivalent to 9.4 billion yen in April 2025. For fiscal year 2025, dividends are set at ¥43 per share for the year-end and ¥80 per share annually, an increase of ¥3 per share over the previously announced forecast, for a payout ratio of 35.1%. For fiscal year 2026, despite a forecast of a temporary decline in profit, the company plans to maintain the dividend amount and aims to enhance the dividend level, implying a payout ratio of 38.2%.
| Fiscal year | Interim (yen) | Year-end (yen) | Annual (yen) | Consolidated dividend payout ratio |
|---|---|---|---|---|
| ’23/3 | 15 | 20 | 35 | 25.9% |
| ’24/3 | 27 | 28 | 55 | 29.3% |
| ’25/3 | 31 | 37 | 68 | 32.1% |
| ’26/3 | 37 | 43 | 80 | 35.1% |
| ’27/3 Forecast | 40 | 40 | 80 | 38.2% |
Capital Efficiency and Medium-Term Targets
The presentation states that the operating profit margin improved by 0.1 percentage points by KAIZEN even though labor cost increased, that invested capital increased due to growth investments resulting in a temporary decline in ROIC, and that the company aims to maintain ROIC by enhancing profitability and strengthening control over invested capital. ROIC was 7.0% in FY25 against 8.1% in FY24, with invested capital turnover of 1.8 versus 2.1, a COGS ratio of 86.9% versus 85.5%, an SG&A ratio of 7.5% versus 9.1%, inventory turnover of 7.8 versus 8.6, and fixed asset turnover of 3.6 versus 3.9. NOPAT margin for FY2025 was 3.8%. ROE was 9.4% in ’26/3 and is forecast at 8.2% for ’27/3, against WACC of 5.0%. The materials state that ROE will be improved toward the 12.0% target for fiscal year 2027 set in the Medium-term Management Plan, and that ROIC will strive to improve toward the target of 9.5% set for fiscal year 2027.
Topics: TRIS Acquisition and Sales Mix
Under Highlights (FY2026), the presentation describes the execution of a growth strategy through the full acquisition of TRIS Inc. (Matsusaka, Mie Prefecture), which became a wholly owned subsidiary on April 1, 2026. TRIS develops and manufactures carbon components for automotive motors and recorded consolidated net sales of ¥17.8 billion in the fiscal year ended March 2025; its global market share of carbon brushes in FY2025 is shown as starter brushes 50%, fuel pump brushes 33% and alternator brushes 48%. Targeted synergies are faster development and enhanced innovation. On FY2025 net sales of 330.8 billion yen, customers were Toyota Motor Group 56%, Hyundai 10%, Honda 6%, Yamaha Motor 5%, Nissan 4%, SUZUKI 3% and others 16%; by product, fuel pump module 52%, throttle body 13%, canister 12%, EGR valve 7%, valve train system products (engine valve) 3%, other automotive parts 10% and non-automotive part 3%. By application, 4-wheelers accounted for 92%, 2-wheelers 6% and others 2%. Quarterly net sales in FY2025 were 799, 831, 841 and 837, with quarterly operating profit of 35, 58, 54 and 35 and margins of 4.4%, 7.1%, 6.4% and 4.1%.
This article is an analysis based on publicly available information and is not a recommendation to buy or sell any specific securities. Investment decisions are your own responsibility.
![[Obayashi] Investors’ Guide 2026 — The Complete 24-Article Breakdown](https://japan-equity.com/wp-content/uploads/2026/07/hub_cover-1024x1024.png)
![[Obayashi] IR & SR Policy — Feeding Dialogue Back into Management](https://japan-equity.com/wp-content/uploads/2026/07/p32_sq-1024x1024.jpg)
![[Obayashi] Real Estate Development — 18.7% Margin, ¥287.7bn Unrealized Gains](https://japan-equity.com/wp-content/uploads/2026/07/p20_sq-1024x1024.jpg)
![[Obayashi] Domestic Civil Engineering — Resilience Spending Supports 9.6% Margin](https://japan-equity.com/wp-content/uploads/2026/07/p11_sq-1024x1024.jpg)
![[Obayashi] Share Price & External Ratings — vs TOPIX, ESG Index Inclusion](https://japan-equity.com/wp-content/uploads/2026/07/p40_sq-1024x1024.jpg)
![[Construction] ¥75.5tn Investment, Shrinking Workforce — Big-5 Market Share](https://japan-equity.com/wp-content/uploads/2026/07/p12_sq-1024x1024.jpg)



![[Obayashi] Capital Policy & Shareholder Returns — ROE 10%+, DOE ~5%, ¥100bn Buyback](https://japan-equity.com/wp-content/uploads/2026/07/p27_sq-1024x1024.jpg)
![[Obayashi] Reducing Cross-Shareholdings — ¥285.2bn Sold in Five Years](https://japan-equity.com/wp-content/uploads/2026/07/p29_sq-1024x1024.jpg)
![[Obayashi] ¥750bn Investment Plan — ¥300bn to Development, ¥190bn to Tech/DX](https://japan-equity.com/wp-content/uploads/2026/07/p30_sq-1024x1024.jpg)
![[Obayashi] MTP2022 KPIs — Operating Profit ~2x Target, ROE 14.4%](https://japan-equity.com/wp-content/uploads/2026/07/p25_sq-1024x1024.jpg)
![[Obayashi] Cash Allocation — ¥420bn Investment CF Over Five Years](https://japan-equity.com/wp-content/uploads/2026/07/p26_sq-1024x1024.jpg)
![[Obayashi] Green Energy — 44 Plants, 344MW, and the Green Hydrogen Challenge](https://japan-equity.com/wp-content/uploads/2026/07/p21_sq-1024x1024.jpg)
![[Obayashi] Tackling the Labor Shortage — Robotics Construction®](https://japan-equity.com/wp-content/uploads/2026/07/p14_sq-1024x1024.jpg)
