
This article is based on publicly available IR materials and is not a recommendation to buy or sell any specific securities.
Note: Enplas denotes fiscal years by their closing month, so the fiscal year ended March 2026 appears as “2026.3” in the company’s materials. Under this site’s convention, the title refers to this most recently completed fiscal year as FY2025; labels in the body and tables below follow the company’s notation.
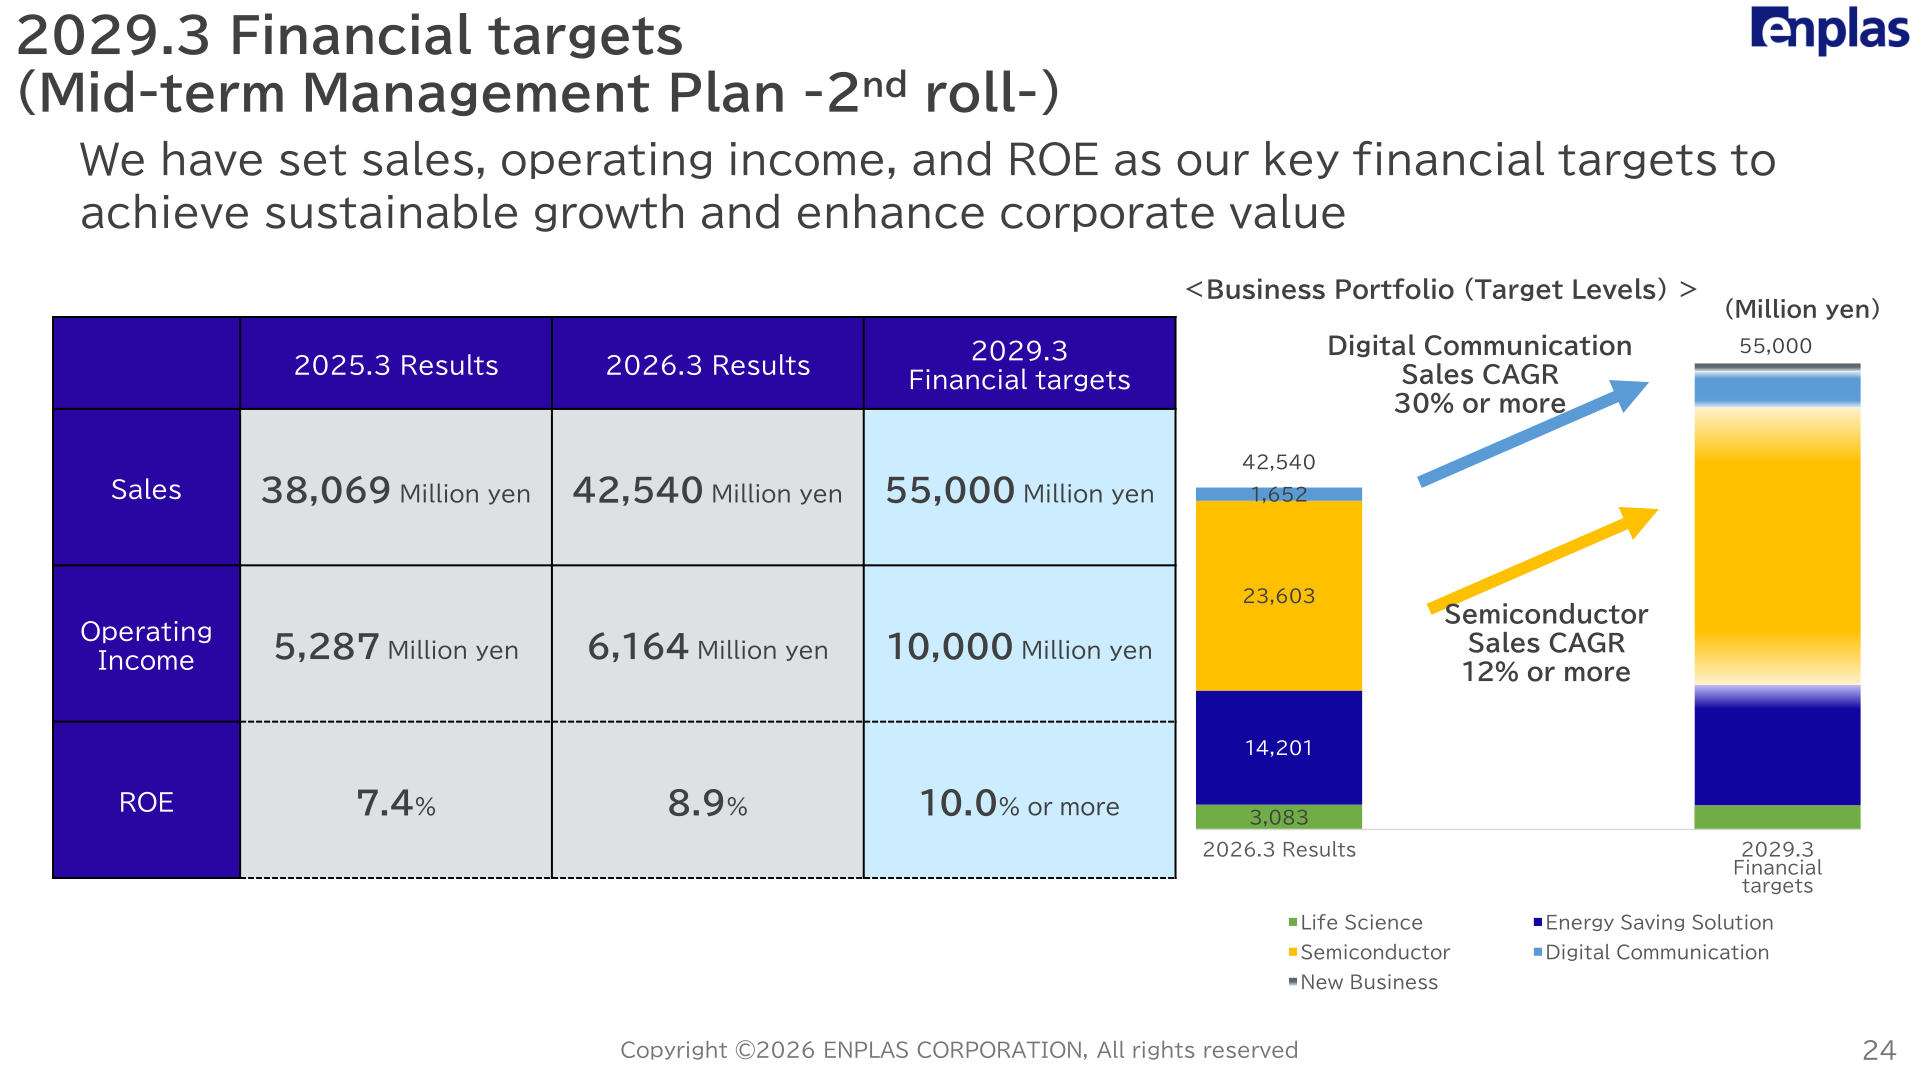
Enplas Corporation (TSE Prime: 6961), an engineering-plastics company with Semiconductor, Life Science, Digital Communication, and Energy Saving Solution businesses, presented its 2026.3 annual results and Mid-Term Management Plan on April 30, 2026. Sales rose 11.7% to 42,540 million yen and operating income rose 16.6% to 6,164 million yen, with profit attributable to owners of parent up 32.7% to 5,233 million yen. The company described the year as significant YoY sales and profits growth, in line with its January forecast, and rolled out the second roll of its Mid-term Management Plan with 2029.3 financial targets of 55,000 million yen in sales and 10,000 million yen in operating income.
Consolidated Results (Full-Year Actual)
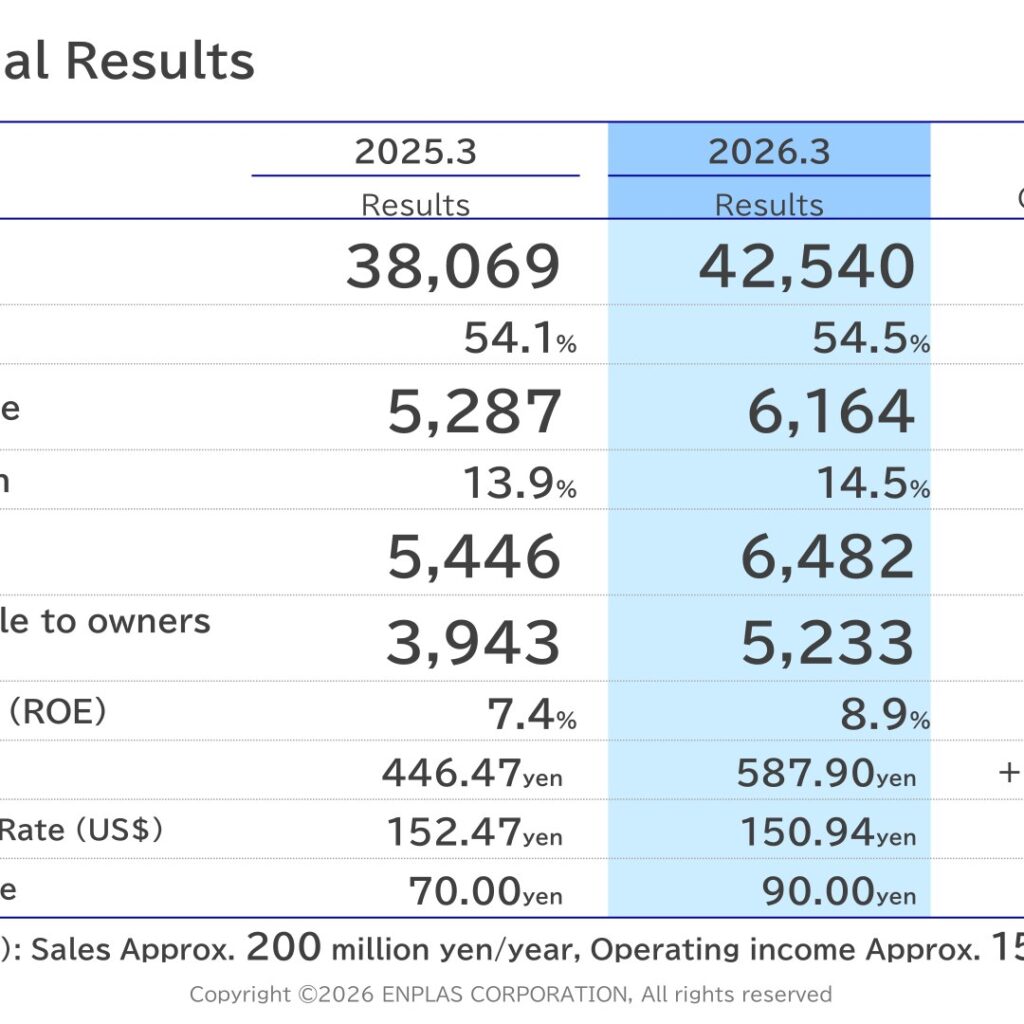
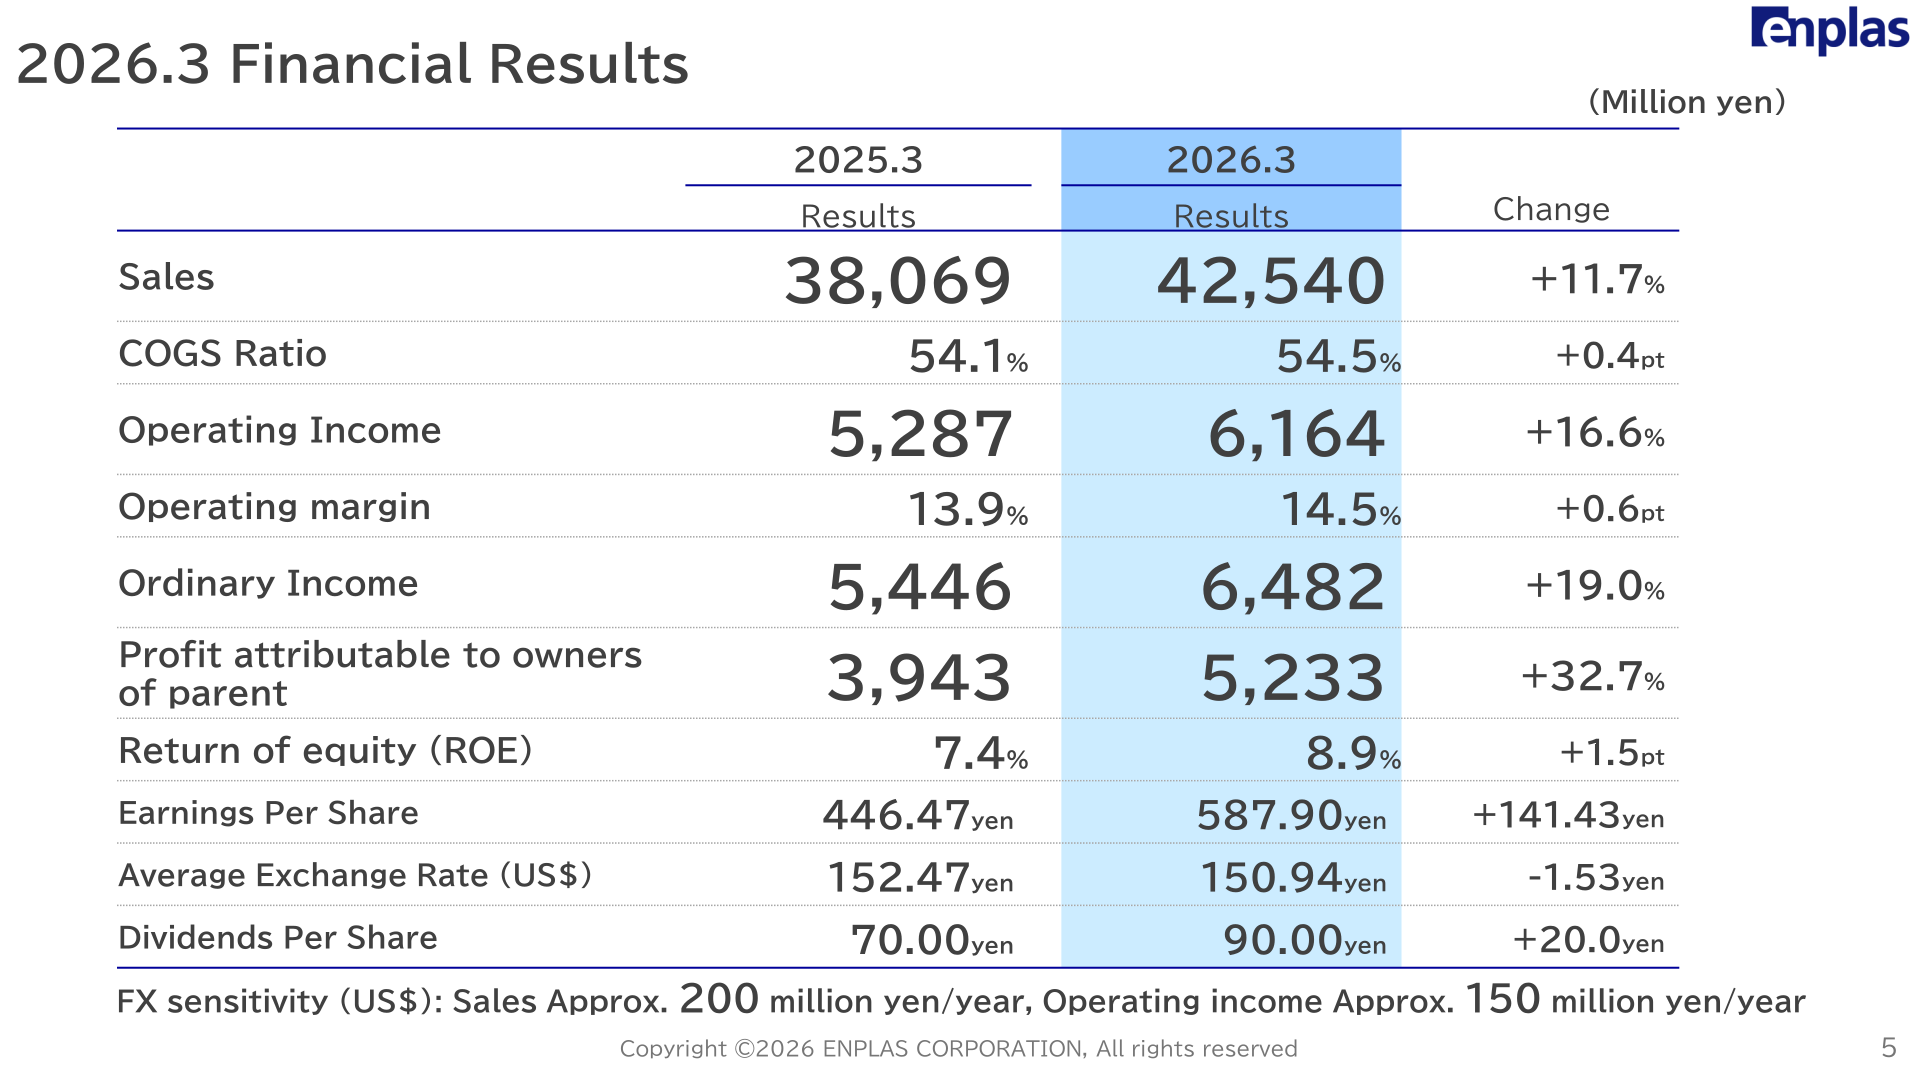
For 2026.3, sales reached 42,540 million yen (+11.7% YoY) and operating income 6,164 million yen (+16.6%), with the operating margin improving 0.6pt to 14.5%. Ordinary income rose 19.0% to 6,482 million yen, and profit attributable to owners of parent increased 32.7% to 5,233 million yen. ROE improved 1.5pt to 8.9%. The average exchange rate was 150.94 yen to the US dollar (152.47 yen in 2025.3), and the company notes FX sensitivity of approximately 200 million yen per year in sales and approximately 150 million yen per year in operating income per US dollar.
| Item | 2025.3 Results | 2026.3 Results | Change |
|---|---|---|---|
| Sales (Million yen) | 38,069 | 42,540 | +11.7% |
| COGS Ratio | 54.1% | 54.5% | +0.4pt |
| Operating Income (Million yen) | 5,287 | 6,164 | +16.6% |
| Operating margin | 13.9% | 14.5% | +0.6pt |
| Ordinary Income (Million yen) | 5,446 | 6,482 | +19.0% |
| Profit attributable to owners of parent (Million yen) | 3,943 | 5,233 | +32.7% |
| Return of equity (ROE) | 7.4% | 8.9% | +1.5pt |
| Earnings Per Share | 446.47 yen | 587.90 yen | +141.43 yen |
| Dividends Per Share | 70.00 yen | 90.00 yen | +20.0 yen |
The ordinary income analysis attributes the increase from 5,446 million yen to 6,482 million yen to a positive 3,016 million yen from sales, offset by -1,132 million yen from the COGS ratio and -1,007 million yen from SG&A, plus 159 million yen from non-operating gain & loss (of which changes in FX gain & loss were +427 million yen). SG&A expenses rose from 12,183 million yen to 13,190 million yen (+1,007 million yen), including labor cost of +439 million yen and research & development expense of +196 million yen. Non-operating profit and loss improved from 158 million yen to 318 million yen (+160 million yen), with interest income of 195 million yen (398 million yen in 2025.3) and an FX gain of 167 million yen (versus an FX loss of 259 million yen in 2025.3).
Segment Results
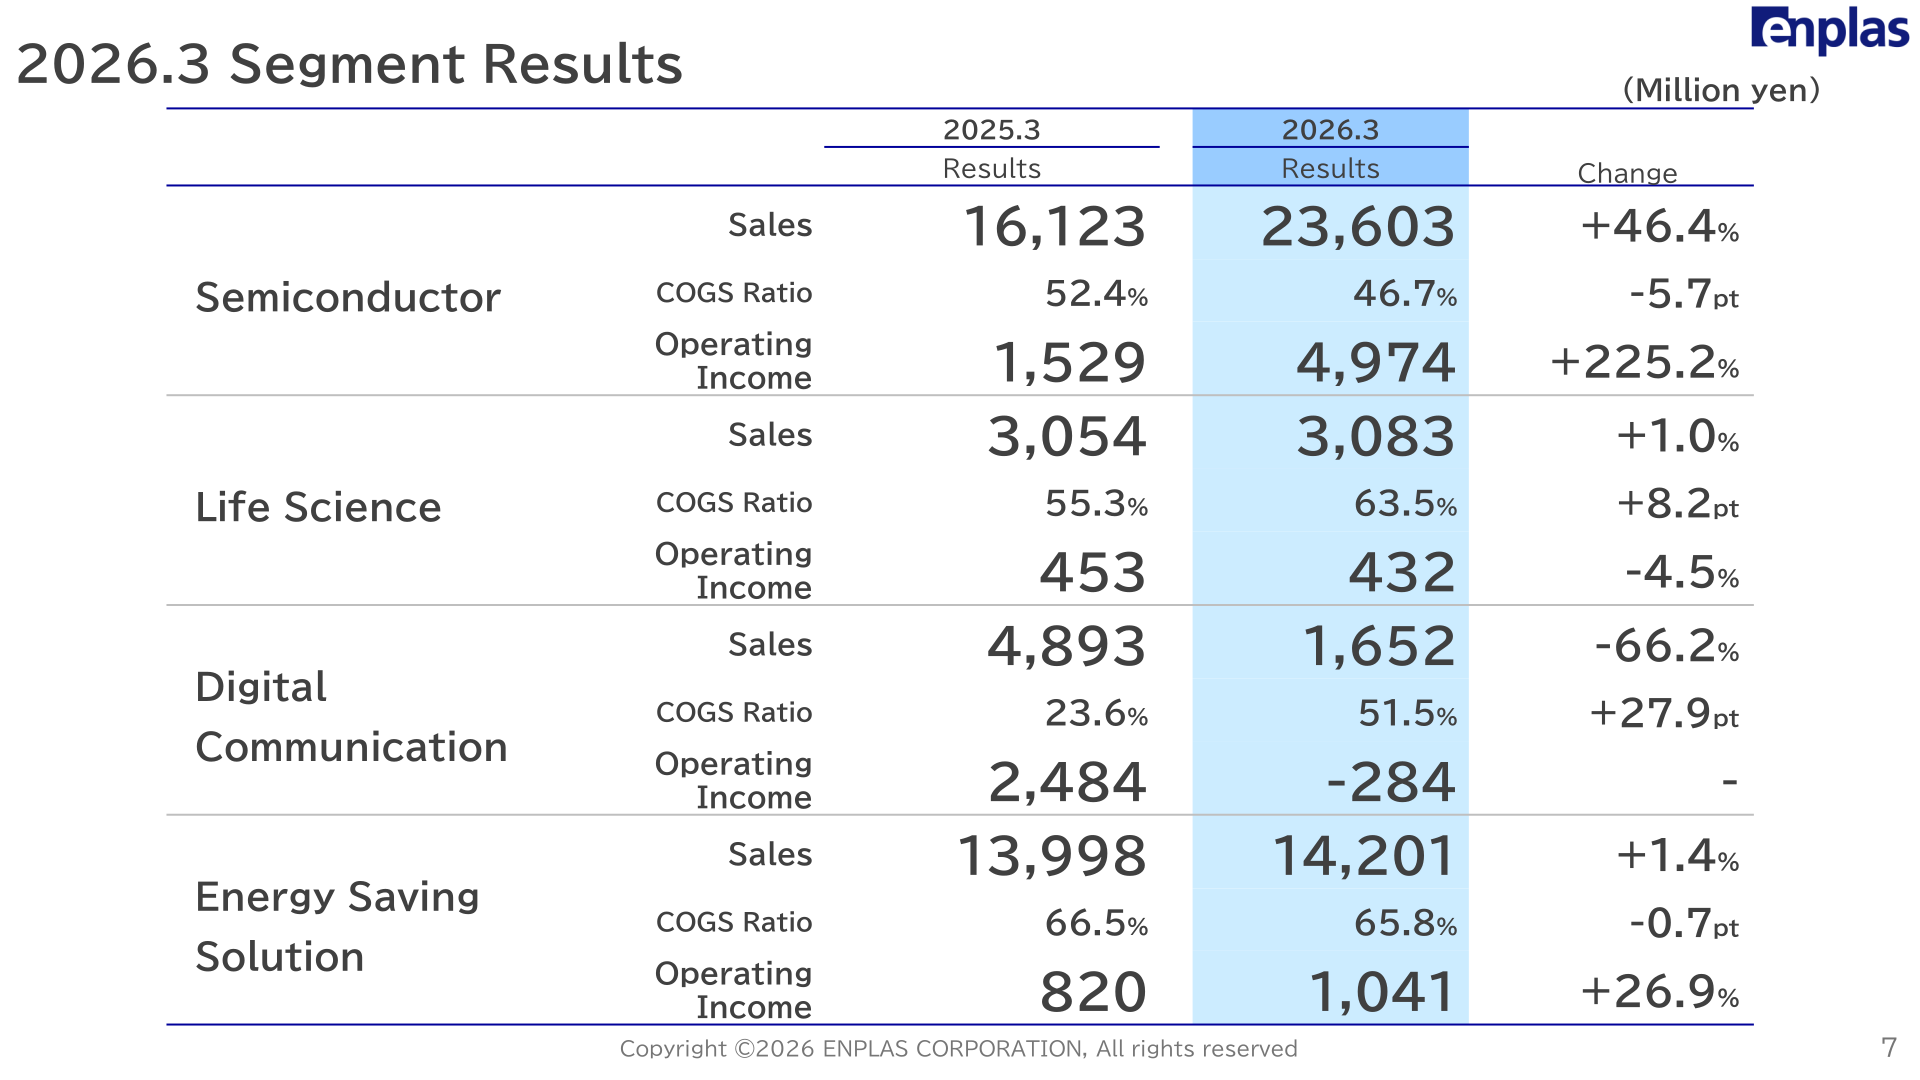
The Semiconductor business drove the year, with sales up 46.4% to 23,603 million yen and operating income up 225.2% to 4,974 million yen, on sharply higher demand for server, automotive, and mobile applications — including a recovery in general-purpose servers, increased ASIC-related demand for hyperscalers in addition to major GPU manufacturers for AI servers, sales growth in automotive SoCs for new customers, and strong smartphone development projects. Life Science sales rose 1.0% to 3,083 million yen, helped by a temporary 2Q sales increase due to discontinuation of some mass-produced products, while operating income declined 4.5% to 432 million yen. Digital Communication sales fell 66.2% to 1,652 million yen with an operating loss of 284 million yen; mass production of lenses for 1.6T optical transceivers has launched, while the launch of new lens connector products was delayed (forecast launch in 2027.3 1Q). Energy Saving Solution sales rose 1.4% to 14,201 million yen with operating income up 26.9% to 1,041 million yen, driven by low-noise, high-efficiency gear solutions for automotive applications; the segment achieved five consecutive years of sales growth despite a sluggish printer market.
| Segment | Metric | 2025.3 Results | 2026.3 Results | Change |
|---|---|---|---|---|
| Semiconductor | Sales (Million yen) | 16,123 | 23,603 | +46.4% |
| Semiconductor | Operating Income (Million yen) | 1,529 | 4,974 | +225.2% |
| Life Science | Sales (Million yen) | 3,054 | 3,083 | +1.0% |
| Life Science | Operating Income (Million yen) | 453 | 432 | -4.5% |
| Digital Communication | Sales (Million yen) | 4,893 | 1,652 | -66.2% |
| Digital Communication | Operating Income (Million yen) | 2,484 | -284 | – |
| Energy Saving Solution | Sales (Million yen) | 13,998 | 14,201 | +1.4% |
| Energy Saving Solution | Operating Income (Million yen) | 820 | 1,041 | +26.9% |
2027.3 Financial Forecast
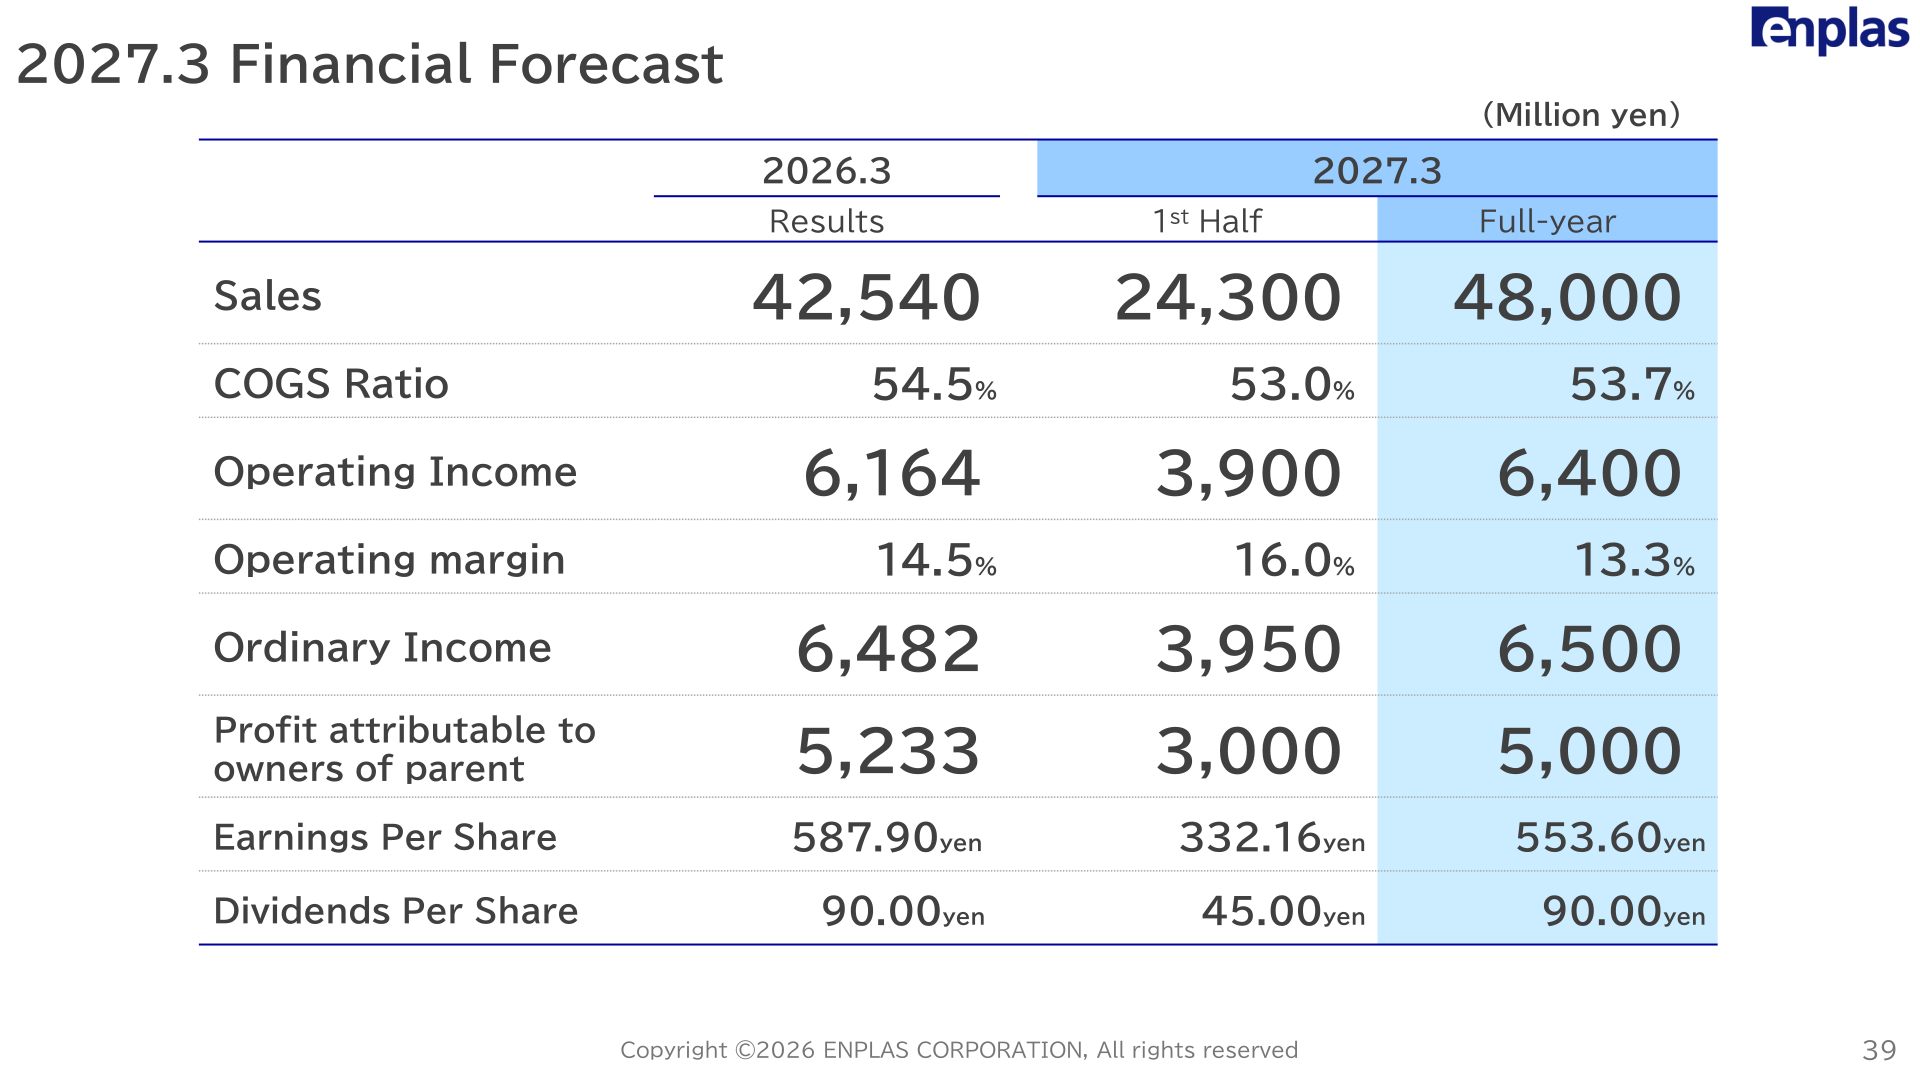
For 2027.3, Enplas forecasts sales of 48,000 million yen, operating income of 6,400 million yen, ordinary income of 6,500 million yen, and profit attributable to owners of parent of 5,000 million yen. The plan assumes a full-year FX rate of 150 yen to the US dollar, and SG&A expenses are expected to increase from 13,190 million yen in 2026.3 to 15,800 million yen due to accelerated growth investment and proactive investment in human resources — including 1,000 million yen of cost increases associated with Semiconductor business investment (supply chain diversification and Test Socket commercialization), 700 million yen of depreciation and related expenses following the launch of the Innovation Center (including a temporary cost increase of 400 million yen), 800 million yen following the launch of IT systems, and 500 million yen of strategic investments in Physical AI Device Solutions and the AI & Robotics Laboratory. Potential risks related to the Middle East situation are under assessment and have not been factored in. By segment, sales are forecast at 29,000 million yen for Semiconductor, 1,000 million yen for Life Science, 3,000 million yen for Digital Communication, and 15,000 million yen for Energy Saving Solution.
| Item | 2026.3 Results | 2027.3 1st Half | 2027.3 Full-year |
|---|---|---|---|
| Sales (Million yen) | 42,540 | 24,300 | 48,000 |
| COGS Ratio | 54.5% | 53.0% | 53.7% |
| Operating Income (Million yen) | 6,164 | 3,900 | 6,400 |
| Operating margin | 14.5% | 16.0% | 13.3% |
| Ordinary Income (Million yen) | 6,482 | 3,950 | 6,500 |
| Profit attributable to owners of parent (Million yen) | 5,233 | 3,000 | 5,000 |
| Earnings Per Share | 587.90 yen | 332.16 yen | 553.60 yen |
| Dividends Per Share | 90.00 yen | 45.00 yen | 90.00 yen |
Shareholder Returns
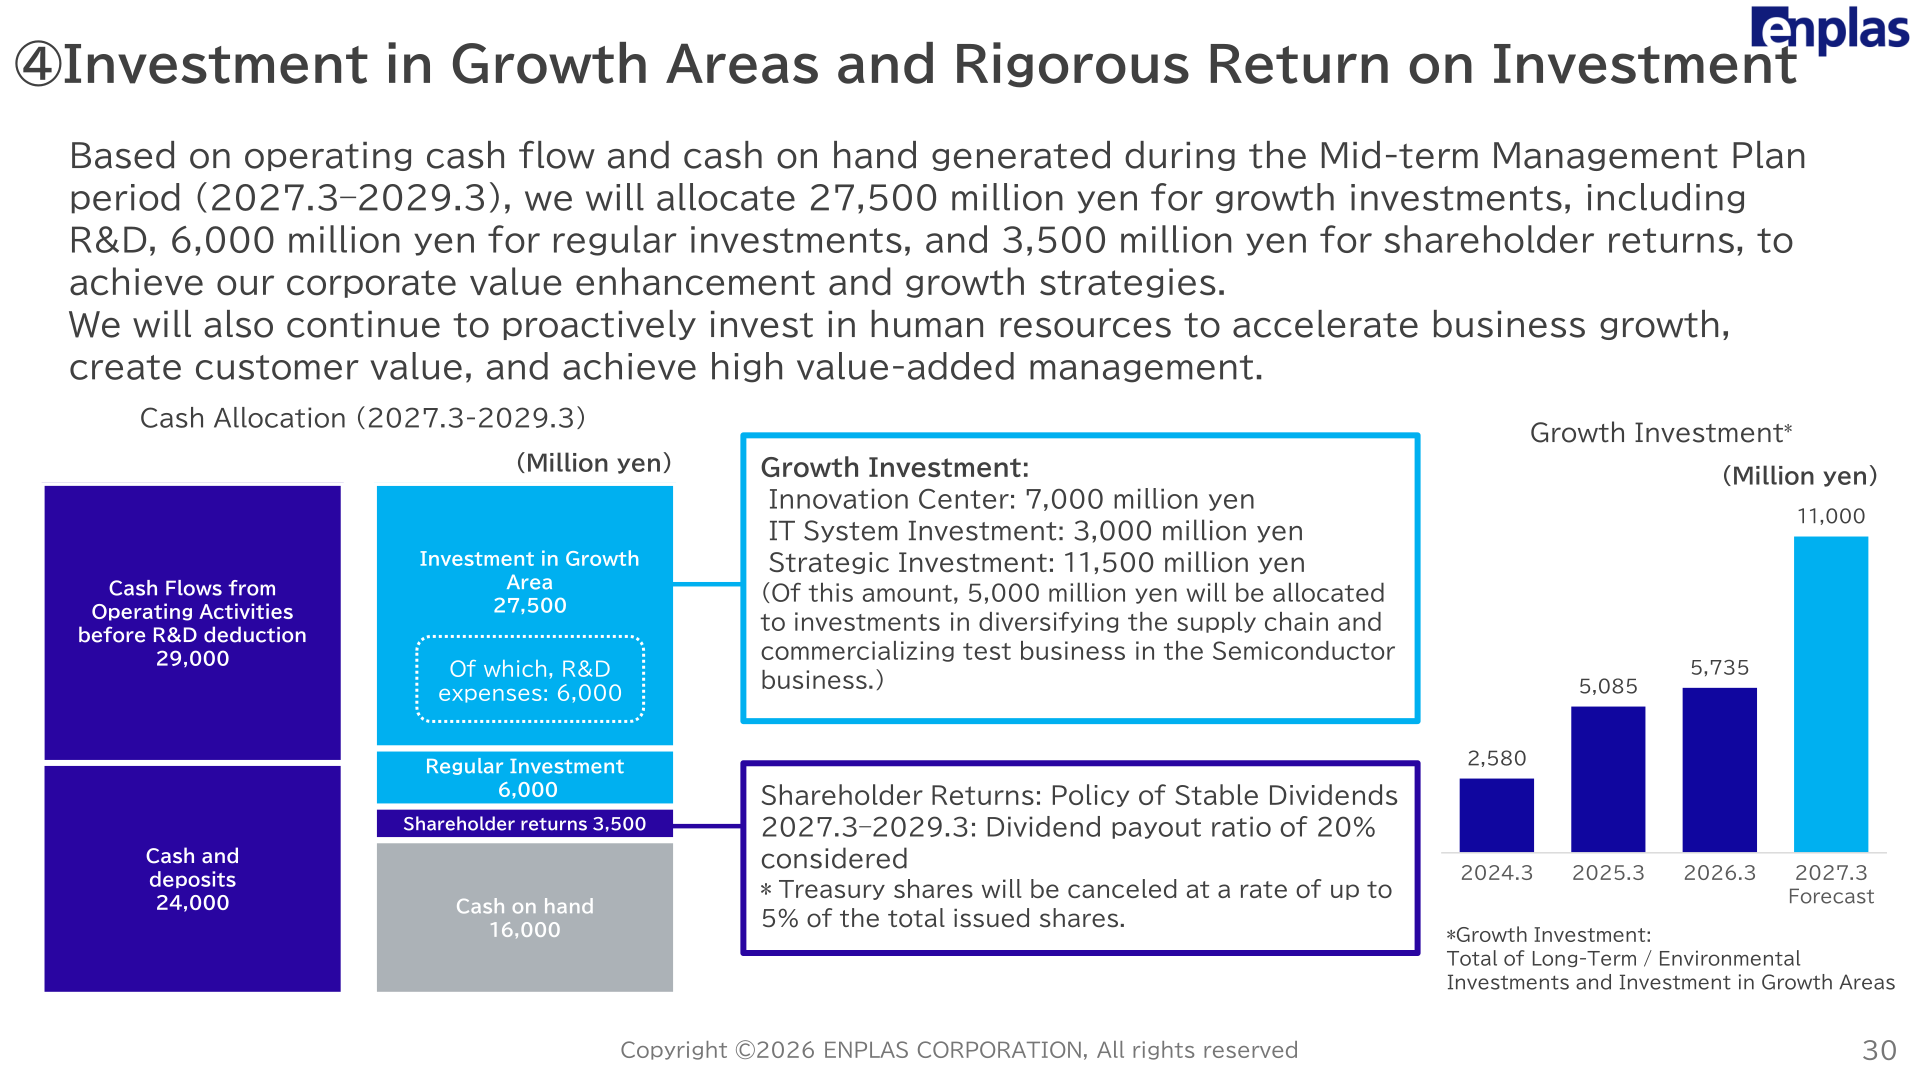
The annual dividend for 2026.3 was 90.00 yen per share, up 20.0 yen from 70.00 yen in 2025.3. For 2027.3, the company forecasts dividends per share of 90.00 yen for the full year, including 45.00 yen at the first half. Under the Mid-term Management Plan, shareholder returns follow a policy of stable dividends, with a dividend payout ratio of 20% considered for 2027.3-2029.3, and treasury shares will be canceled at a rate of up to 5% of the total issued shares. Within the cash allocation for 2027.3-2029.3, 3,500 million yen is allocated to shareholder returns.
Mid-Term Management Plan -2nd roll-
Reviewing the first roll (disclosed in April 2025), the company states that financial targets are progressing well above expectations: against 2026.3 initial targets (excluding the impact of FX and additional U.S. tariffs) of 40,000 million yen in sales, 4,700 million yen in operating income, and 5.8% ROE, actual results were 42,540 million yen, 6,164 million yen, and 8.9%. With the second roll, Enplas revised its Long-term Vision to “Solution Provider to Maximize AI Performance,” reflecting that the social implementation of AI it expected to progress over the medium to long term is accelerating, and switched to a strategy of broadly capturing and growing in domains not limited to Essential markets or key plastic components. The Mid-Term Management Policy (2027.3-2029.3), under the slogan “One Enplas for Growth,” sets four priority items: Semiconductor business growth and business portfolio diversification; creating customer value through the Innovation Center; growth of each business and expansion of business areas; and investment in growth areas with rigorous return on investment.
| Item | 2025.3 Results | 2026.3 Results | 2029.3 Financial targets |
|---|---|---|---|
| Sales | 38,069 Million yen | 42,540 Million yen | 55,000 Million yen |
| Operating Income | 5,287 Million yen | 6,164 Million yen | 10,000 Million yen |
| ROE | 7.4% | 8.9% | 10.0% or more |
The business portfolio targets include sales CAGR of 12% or more for Semiconductor and 30% or more for Digital Communication. For cash allocation over 2027.3-2029.3, based on cash flows from operating activities before R&D deduction of 29,000 million yen and cash and deposits of 24,000 million yen, the company plans 27,500 million yen of investment in growth areas (of which R&D expenses are 6,000 million yen), 6,000 million yen of regular investment, and 3,500 million yen of shareholder returns, keeping 16,000 million yen of cash on hand. Growth investment comprises 7,000 million yen for the Innovation Center, 3,000 million yen for IT system investment, and 11,500 million yen for strategic investment, of which 5,000 million yen will be allocated to diversifying the supply chain and commercializing the test business in the Semiconductor business. On capital-cost-conscious management, the company assumes that the cost of equity could be in the range of 7% to 9% or higher over the medium to long term, aims for ROE of 10% or more during the plan period, and targets TSR exceeding TOPIX.
This article is an analysis based on publicly available information and is not a recommendation to buy or sell any specific securities. Investment decisions are your own responsibility.
![[Obayashi] Investors’ Guide 2026 — The Complete 24-Article Breakdown](https://japan-equity.com/wp-content/uploads/2026/07/hub_cover-1024x1024.png)
![[Obayashi] IR & SR Policy — Feeding Dialogue Back into Management](https://japan-equity.com/wp-content/uploads/2026/07/p32_sq-1024x1024.jpg)
![[Obayashi] Real Estate Development — 18.7% Margin, ¥287.7bn Unrealized Gains](https://japan-equity.com/wp-content/uploads/2026/07/p20_sq-1024x1024.jpg)
![[Obayashi] Domestic Civil Engineering — Resilience Spending Supports 9.6% Margin](https://japan-equity.com/wp-content/uploads/2026/07/p11_sq-1024x1024.jpg)
![[Obayashi] Share Price & External Ratings — vs TOPIX, ESG Index Inclusion](https://japan-equity.com/wp-content/uploads/2026/07/p40_sq-1024x1024.jpg)
![[Construction] ¥75.5tn Investment, Shrinking Workforce — Big-5 Market Share](https://japan-equity.com/wp-content/uploads/2026/07/p12_sq-1024x1024.jpg)



![[Obayashi] Capital Policy & Shareholder Returns — ROE 10%+, DOE ~5%, ¥100bn Buyback](https://japan-equity.com/wp-content/uploads/2026/07/p27_sq-1024x1024.jpg)
![[Obayashi] Reducing Cross-Shareholdings — ¥285.2bn Sold in Five Years](https://japan-equity.com/wp-content/uploads/2026/07/p29_sq-1024x1024.jpg)
![[Obayashi] ¥750bn Investment Plan — ¥300bn to Development, ¥190bn to Tech/DX](https://japan-equity.com/wp-content/uploads/2026/07/p30_sq-1024x1024.jpg)
![[Obayashi] MTP2022 KPIs — Operating Profit ~2x Target, ROE 14.4%](https://japan-equity.com/wp-content/uploads/2026/07/p25_sq-1024x1024.jpg)
![[Obayashi] Cash Allocation — ¥420bn Investment CF Over Five Years](https://japan-equity.com/wp-content/uploads/2026/07/p26_sq-1024x1024.jpg)
![[Obayashi] Green Energy — 44 Plants, 344MW, and the Green Hydrogen Challenge](https://japan-equity.com/wp-content/uploads/2026/07/p21_sq-1024x1024.jpg)
![[Obayashi] Tackling the Labor Shortage — Robotics Construction®](https://japan-equity.com/wp-content/uploads/2026/07/p14_sq-1024x1024.jpg)
