
This article is based on publicly available IR materials and is not a recommendation to buy or sell any specific securities.
CMK Corporation (Stock Code: 6958), a manufacturer of printed circuit boards (PCBs), published its “FY2025 Financial Results (for reference)” dated May 14, 2026. Consolidated net sales for FY2025 were ¥100,202 million, up 4.9% year on year, while operating income declined 26.8% to ¥2,788 million. Ordinary income fell 25.2% to ¥4,136 million, and profit attributable to owners of parent rose 6.3% to ¥4,026 million. For FY2026, the company forecasts net sales of ¥104,000 million and operating income of ¥3,200 million.
Consolidated Results (Full-Year Actual)
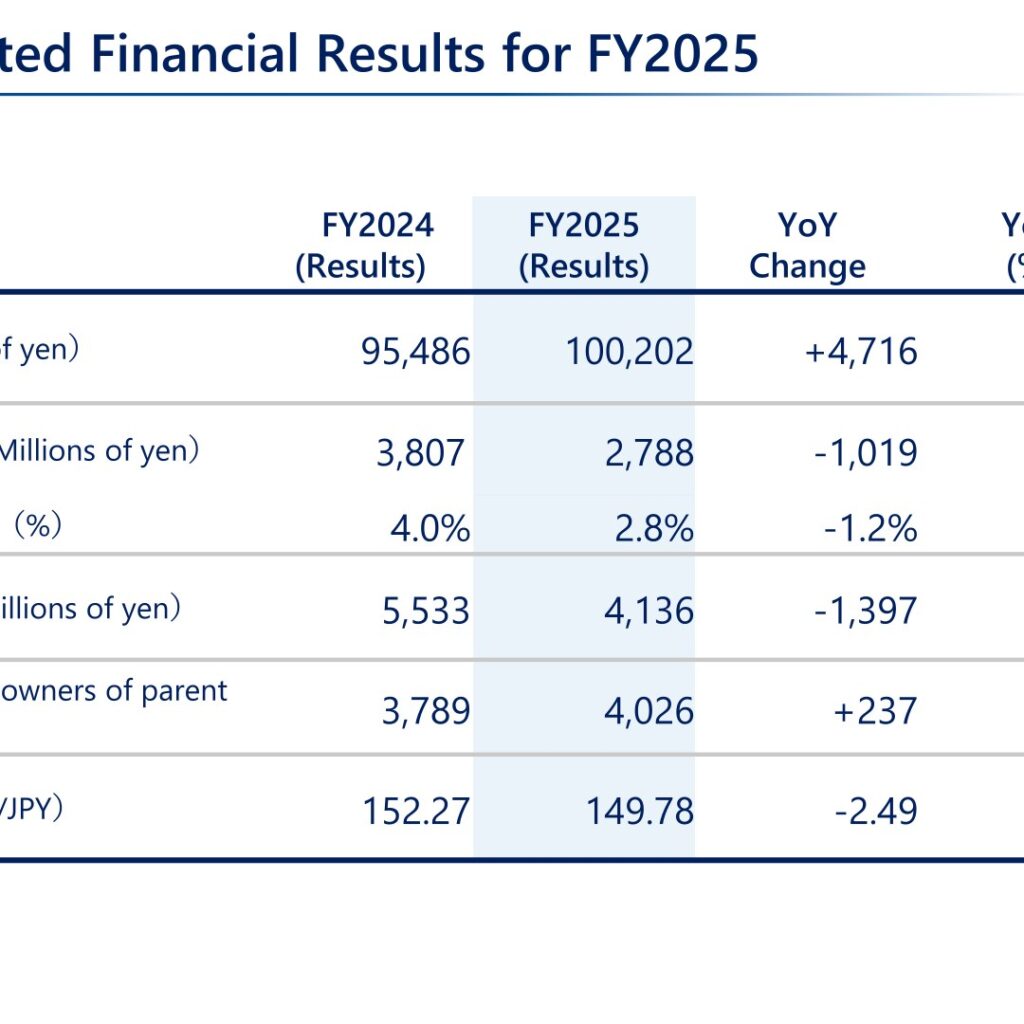
Net sales increased by ¥4,716 million year on year to ¥100,202 million. Operating income decreased by ¥1,019 million to ¥2,788 million, with the operating margin narrowing from 4.0% to 2.8%. Ordinary income declined by ¥1,397 million to ¥4,136 million, while profit attributable to owners of parent increased by ¥237 million to ¥4,026 million. The average exchange rate was ¥149.78 to the U.S. dollar, compared with ¥152.27 in FY2024.
| Item | FY2024 (Results) | FY2025 (Results) | YoY Change | YoY (%) |
|---|---|---|---|---|
| Net sales (Millions of yen) | 95,486 | 100,202 | +4,716 | +4.9% |
| Operating income (Millions of yen) | 3,807 | 2,788 | -1,019 | -26.8% |
| Operating margin (%) | 4.0% | 2.8% | -1.2% | – |
| Ordinary income (Millions of yen) | 5,533 | 4,136 | -1,397 | -25.2% |
| Profit attributable to owners of parent (Millions of yen) | 3,789 | 4,026 | +237 | +6.3% |
| Exchange rate (USD/JPY) | 152.27 | 149.78 | -2.49 | -1.6% |
Sales by Product
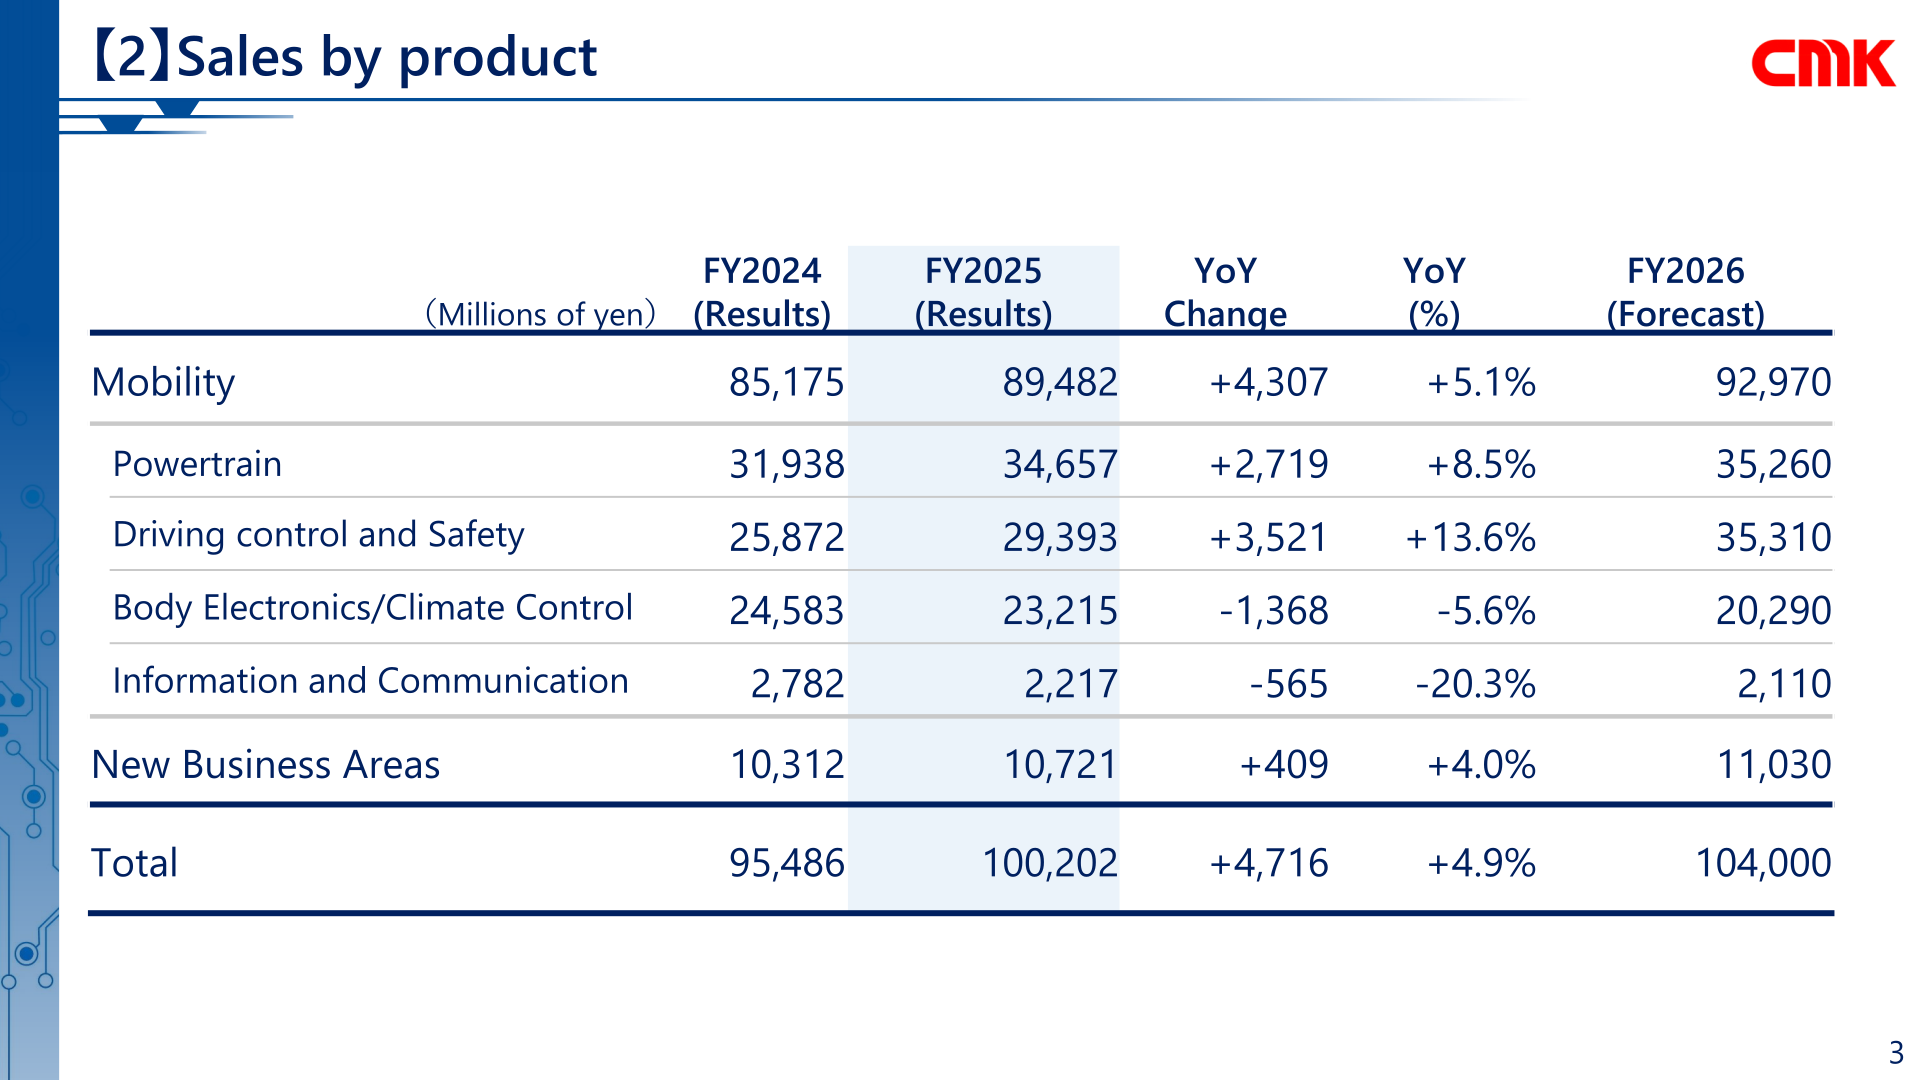
Sales in the Mobility category rose 5.1% year on year to ¥89,482 million. Within Mobility, Powertrain sales increased 8.5% to ¥34,657 million and Driving control and Safety sales increased 13.6% to ¥29,393 million, while Body Electronics/Climate Control sales decreased 5.6% to ¥23,215 million. Information and Communication sales declined 20.3% to ¥2,217 million, and New Business Areas sales increased 4.0% to ¥10,721 million. By type of PCBs, HDI PCBs grew 10.4% to ¥32,981 million and Multilayer PCBs grew 5.6% to ¥53,911 million, while Double-sided PCBs fell 4.7% to ¥9,530 million and Others fell 17.5% to ¥3,779 million.
| Category (Millions of yen) | FY2024 (Results) | FY2025 (Results) | YoY Change | YoY (%) | FY2026 (Forecast) |
|---|---|---|---|---|---|
| Mobility | 85,175 | 89,482 | +4,307 | +5.1% | 92,970 |
| — Powertrain | 31,938 | 34,657 | +2,719 | +8.5% | 35,260 |
| — Driving control and Safety | 25,872 | 29,393 | +3,521 | +13.6% | 35,310 |
| — Body Electronics/Climate Control | 24,583 | 23,215 | -1,368 | -5.6% | 20,290 |
| — Information and Communication | 2,782 | 2,217 | -565 | -20.3% | 2,110 |
| New Business Areas | 10,312 | 10,721 | +409 | +4.0% | 11,030 |
| Total | 95,486 | 100,202 | +4,716 | +4.9% | 104,000 |
Financial Results by Region
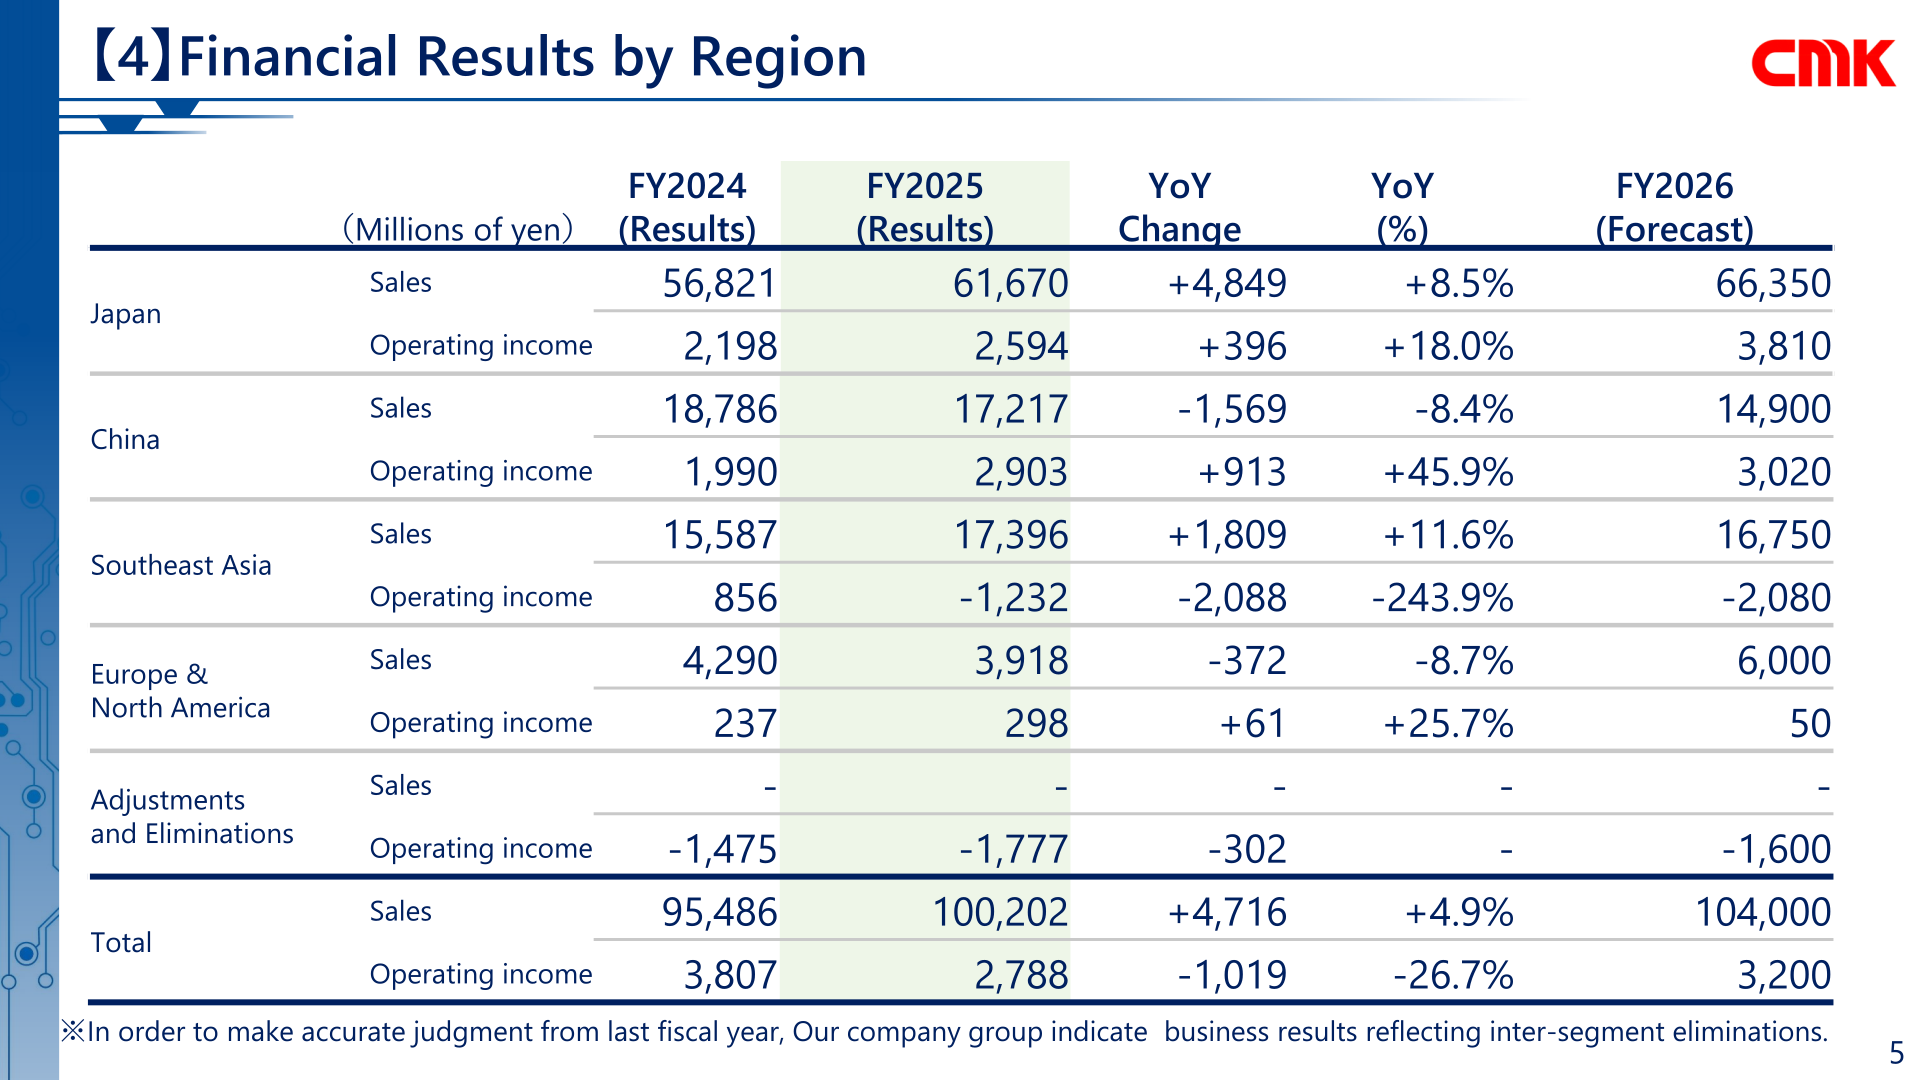
In Japan, sales rose 8.5% year on year to ¥61,670 million and operating income rose 18.0% to ¥2,594 million. In China, sales declined 8.4% to ¥17,217 million while operating income increased 45.9% to ¥2,903 million. In Southeast Asia, sales increased 11.6% to ¥17,396 million, but operating income was ¥-1,232 million, a decline of ¥2,088 million from ¥856 million in FY2024. In Europe & North America, sales decreased 8.7% to ¥3,918 million and operating income increased 25.7% to ¥298 million. The company notes that business results are indicated reflecting inter-segment eliminations.
| Region | Metric (Millions of yen) | FY2024 (Results) | FY2025 (Results) | YoY Change | YoY (%) | FY2026 (Forecast) |
|---|---|---|---|---|---|---|
| Japan | Sales | 56,821 | 61,670 | +4,849 | +8.5% | 66,350 |
| Japan | Operating income | 2,198 | 2,594 | +396 | +18.0% | 3,810 |
| China | Sales | 18,786 | 17,217 | -1,569 | -8.4% | 14,900 |
| China | Operating income | 1,990 | 2,903 | +913 | +45.9% | 3,020 |
| Southeast Asia | Sales | 15,587 | 17,396 | +1,809 | +11.6% | 16,750 |
| Southeast Asia | Operating income | 856 | -1,232 | -2,088 | -243.9% | -2,080 |
| Europe & North America | Sales | 4,290 | 3,918 | -372 | -8.7% | 6,000 |
| Europe & North America | Operating income | 237 | 298 | +61 | +25.7% | 50 |
| Adjustments and Eliminations | Operating income | -1,475 | -1,777 | -302 | – | -1,600 |
| Total | Sales | 95,486 | 100,202 | +4,716 | +4.9% | 104,000 |
| Total | Operating income | 3,807 | 2,788 | -1,019 | -26.7% | 3,200 |
FY2026 Forecast
For FY2026, CMK forecasts net sales of ¥104,000 million, operating income of ¥3,200 million with an operating margin of 3.1%, ordinary income of ¥3,800 million, and profit attributable to owners of parent of ¥2,000 million, assuming an exchange rate of ¥150.00 to the U.S. dollar. By region, the forecast calls for sales of ¥66,350 million in Japan, ¥14,900 million in China, ¥16,750 million in Southeast Asia, and ¥6,000 million in Europe & North America, with Southeast Asia projected to post operating income of ¥-2,080 million.
| Item | FY2025 (Results) | FY2026 (Forecast) |
|---|---|---|
| Net sales (Millions of yen) | 100,202 | 104,000 |
| Operating income (Millions of yen) | 2,788 | 3,200 |
| Operating margin (%) | 2.8% | 3.1% |
| Ordinary income (Millions of yen) | 4,136 | 3,800 |
| Profit attributable to owners of parent (Millions of yen) | 4,026 | 2,000 |
| Exchange rate (USD/JPY) | 149.78 | 150.00 |
Capital Investment
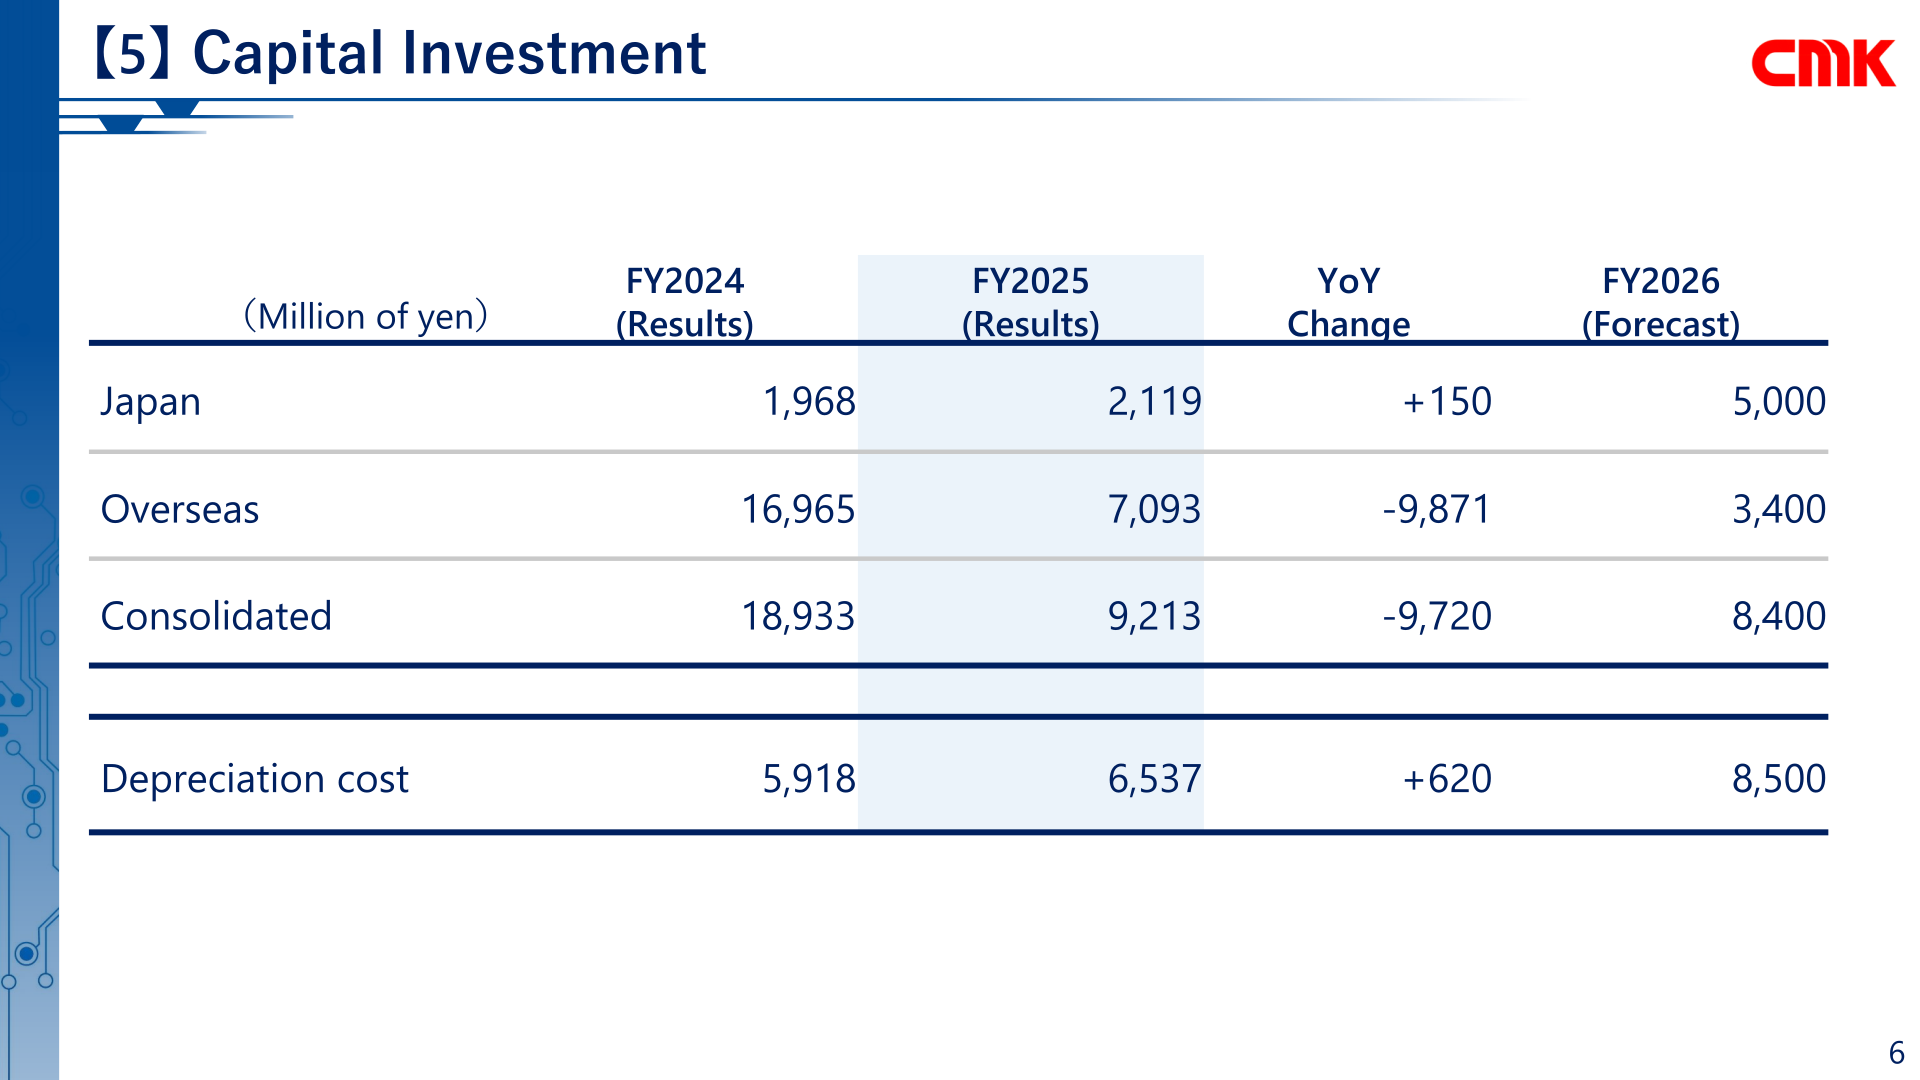
Consolidated capital investment in FY2025 was ¥9,213 million, a decrease of ¥9,720 million from ¥18,933 million in FY2024. Of this, investment in Japan was ¥2,119 million (up ¥150 million) and overseas investment was ¥7,093 million (down ¥9,871 million). Depreciation cost was ¥6,537 million, up ¥620 million year on year. For FY2026, the company plans consolidated capital investment of ¥8,400 million (¥5,000 million in Japan and ¥3,400 million overseas) and depreciation cost of ¥8,500 million.
| Item (Million of yen) | FY2024 (Results) | FY2025 (Results) | YoY Change | FY2026 (Forecast) |
|---|---|---|---|---|
| Japan | 1,968 | 2,119 | +150 | 5,000 |
| Overseas | 16,965 | 7,093 | -9,871 | 3,400 |
| Consolidated | 18,933 | 9,213 | -9,720 | 8,400 |
| Depreciation cost | 5,918 | 6,537 | +620 | 8,500 |
Shareholder Returns
Information on dividends and shareholder returns is not included in this presentation material. This cannot be confirmed from the materials.
This article is an analysis based on publicly available information and is not a recommendation to buy or sell any specific securities. Investment decisions are your own responsibility.
![[Obayashi] Investors’ Guide 2026 — The Complete 24-Article Breakdown](https://japan-equity.com/wp-content/uploads/2026/07/hub_cover-1024x1024.png)
![[Obayashi] IR & SR Policy — Feeding Dialogue Back into Management](https://japan-equity.com/wp-content/uploads/2026/07/p32_sq-1024x1024.jpg)
![[Obayashi] Real Estate Development — 18.7% Margin, ¥287.7bn Unrealized Gains](https://japan-equity.com/wp-content/uploads/2026/07/p20_sq-1024x1024.jpg)
![[Obayashi] Domestic Civil Engineering — Resilience Spending Supports 9.6% Margin](https://japan-equity.com/wp-content/uploads/2026/07/p11_sq-1024x1024.jpg)
![[Obayashi] Share Price & External Ratings — vs TOPIX, ESG Index Inclusion](https://japan-equity.com/wp-content/uploads/2026/07/p40_sq-1024x1024.jpg)
![[Construction] ¥75.5tn Investment, Shrinking Workforce — Big-5 Market Share](https://japan-equity.com/wp-content/uploads/2026/07/p12_sq-1024x1024.jpg)



![[Obayashi] Capital Policy & Shareholder Returns — ROE 10%+, DOE ~5%, ¥100bn Buyback](https://japan-equity.com/wp-content/uploads/2026/07/p27_sq-1024x1024.jpg)
![[Obayashi] Reducing Cross-Shareholdings — ¥285.2bn Sold in Five Years](https://japan-equity.com/wp-content/uploads/2026/07/p29_sq-1024x1024.jpg)
![[Obayashi] ¥750bn Investment Plan — ¥300bn to Development, ¥190bn to Tech/DX](https://japan-equity.com/wp-content/uploads/2026/07/p30_sq-1024x1024.jpg)
![[Obayashi] MTP2022 KPIs — Operating Profit ~2x Target, ROE 14.4%](https://japan-equity.com/wp-content/uploads/2026/07/p25_sq-1024x1024.jpg)
![[Obayashi] Cash Allocation — ¥420bn Investment CF Over Five Years](https://japan-equity.com/wp-content/uploads/2026/07/p26_sq-1024x1024.jpg)
![[Obayashi] Green Energy — 44 Plants, 344MW, and the Green Hydrogen Challenge](https://japan-equity.com/wp-content/uploads/2026/07/p21_sq-1024x1024.jpg)
![[Obayashi] Tackling the Labor Shortage — Robotics Construction®](https://japan-equity.com/wp-content/uploads/2026/07/p14_sq-1024x1024.jpg)
