
This article is based on publicly available IR materials and is not a recommendation to buy or sell any specific securities.
Note: HIOKI’s fiscal year ends in December. “FY2025” in the title refers to the fiscal year ended December 31, 2025, which the presentation materials label “2025.” Labels in the tables below follow the materials.
HIOKI E.E. CORPORATION (Securities Code: 6866), which develops, produces, sells, and services electrical measuring instruments, reported record-high sales of 40.53 billion yen for 2025, although sales narrowly missed the revised forecast. Significant growth in China drove sales, with batteries performing particularly well, while sales in South Korea declined mid-year due to political factors before recovering after September. Profits decreased, as the company was unable to secure sufficient sales to cover one-time expenses related to its 90th anniversary and planned investments for DX promotion. For 2026, the company forecasts sales of 43,000 million yen and operating profit of 7,680 million yen, with data center-related sales expected to be the driving force.
Consolidated Results (Full-Year Actual)
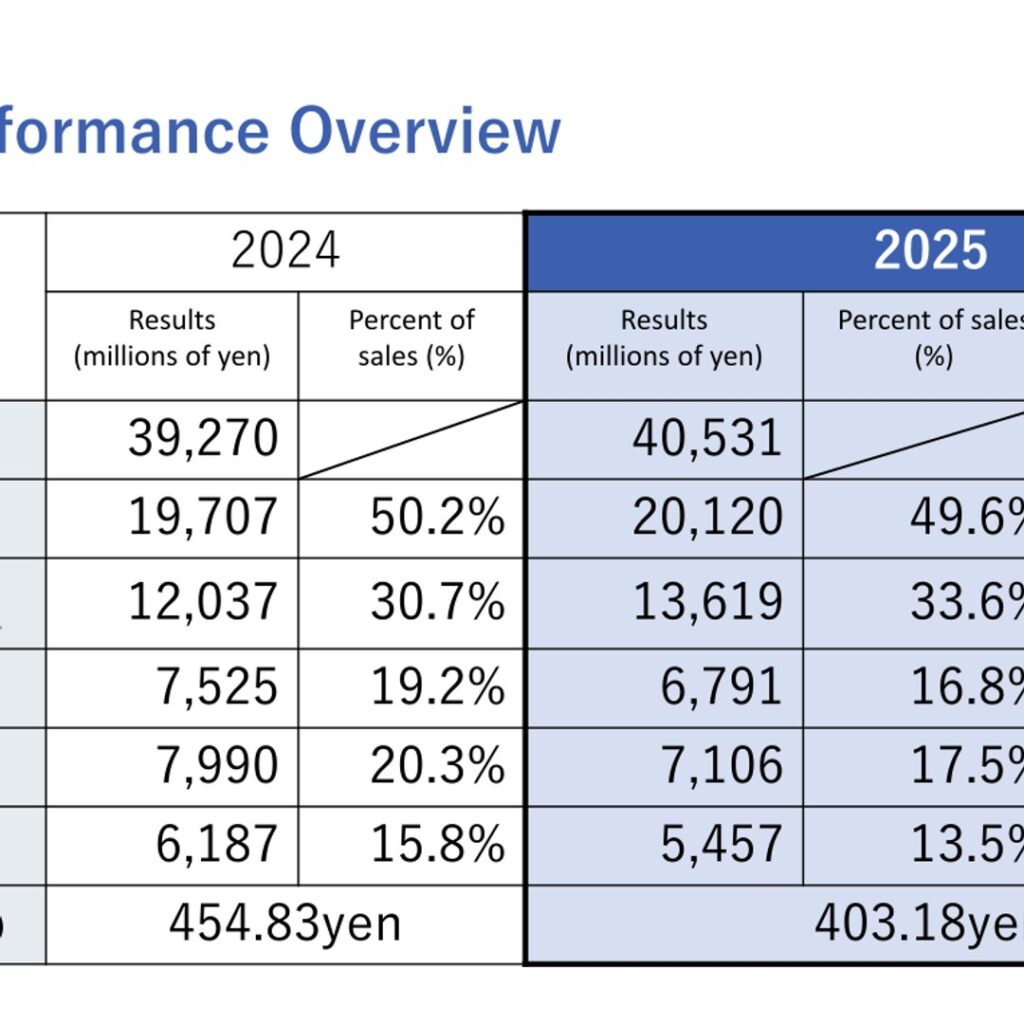
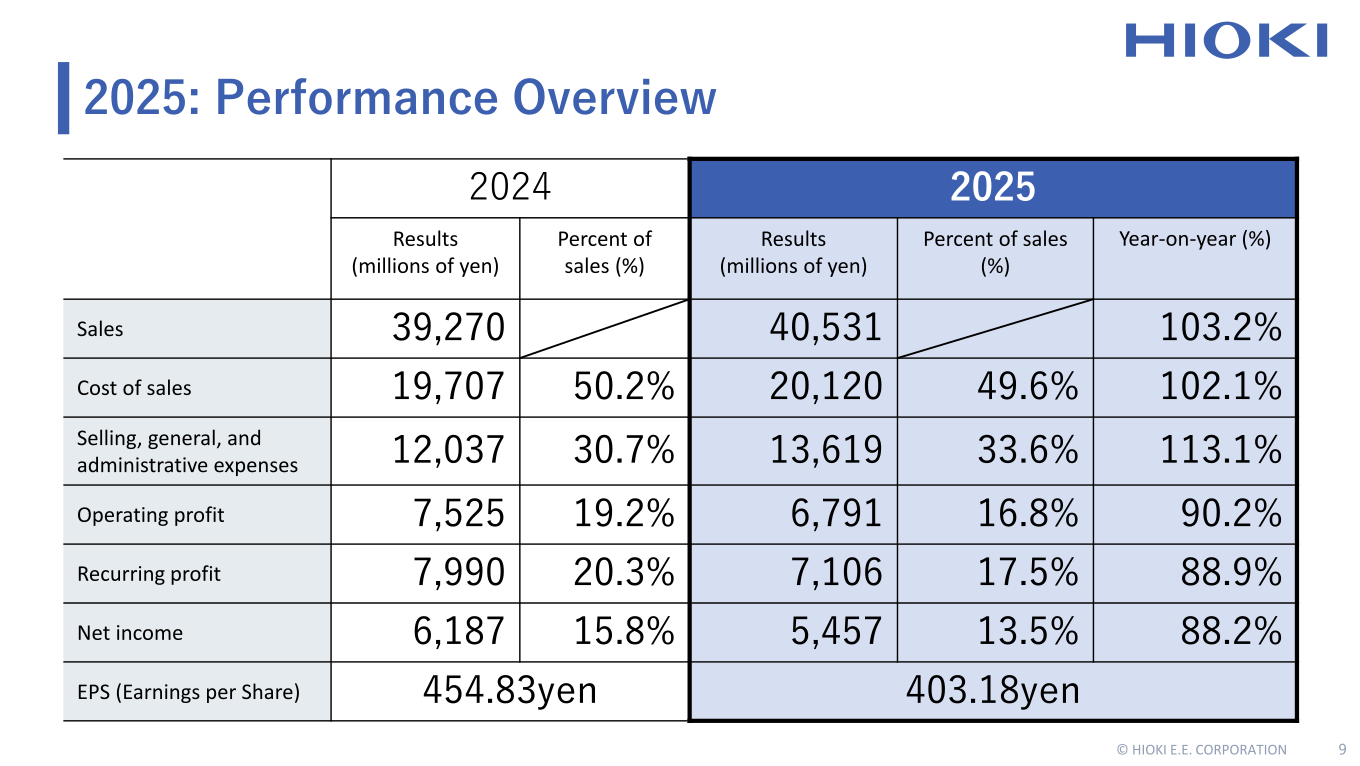
Sales for 2025 were 40,531 million yen (103.2% year-on-year), while operating profit was 6,791 million yen (90.2%), recurring profit was 7,106 million yen (88.9%), and net income was 5,457 million yen (88.2%). The operating profit margin was 16.8%, the percentage of overseas sales was 63.6%, and return on equity (ROE) was 13.0%. The company notes that expenses related to the 90th anniversary in 2025 were one-off, that costs for DX promotion (ERP, CRM) will be incurred across 2025 and 2026, and that an increase in net assets from retirement benefit adjustments lowered ROE in 2025.
| Item | 2024 Results (millions of yen) | 2025 Results (millions of yen) | Year-on-year (%) |
|---|---|---|---|
| Sales | 39,270 | 40,531 | 103.2% |
| Cost of sales | 19,707 | 20,120 | 102.1% |
| Selling, general, and administrative expenses | 12,037 | 13,619 | 113.1% |
| Operating profit | 7,525 | 6,791 | 90.2% |
| Recurring profit | 7,990 | 7,106 | 88.9% |
| Net income | 6,187 | 5,457 | 88.2% |
| EPS (Earnings per Share) | 454.83 yen | 403.18 yen | — |
In the operating income bridge for 2025, an increase in gross profit due to increased sales (+1,164 million yen) and an improved gross margin (+323 million yen) were outweighed by increased fixed costs such as labor costs and other expenses (△2,035 million yen), taking operating profit from 7,525 million yen in 2024 to 6,791 million yen in 2025. Average exchange rates during the year were ¥149.71 to the US dollar in 2025 (¥151.57 in 2024) and ¥20.82 to the Chinese yuan (¥21.02 in 2024).
Sales by Destination and Product Group
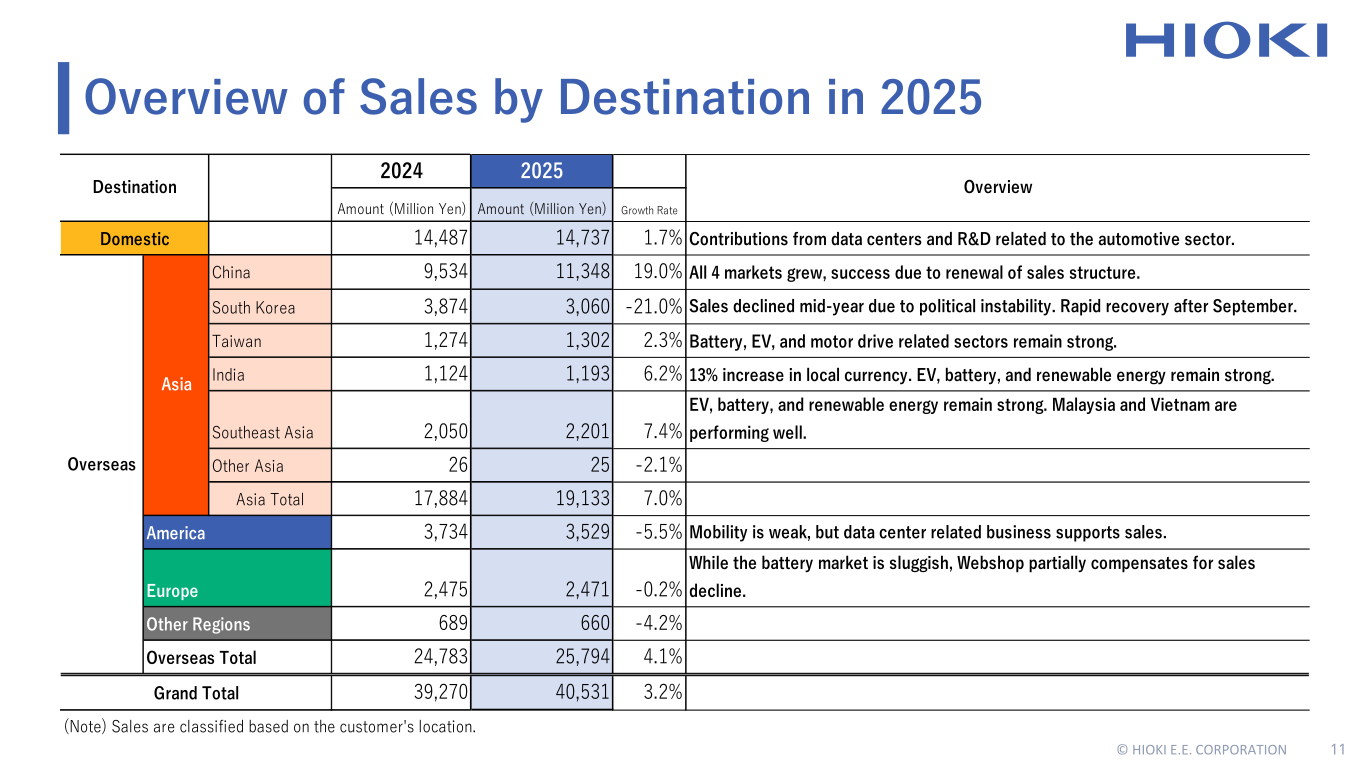
By destination, domestic sales rose 1.7% to 14,737 million yen, with contributions from data centers and R&D related to the automotive sector. China grew 19.0% to 11,348 million yen, with all four markets growing on the back of a renewed sales structure, while South Korea fell 21.0% to 3,060 million yen due to political instability mid-year, followed by a rapid recovery after September. Overseas sales totaled 25,794 million yen (up 4.1%), and sales are classified based on the customer’s location.
| Destination | 2024 Amount (Million Yen) | 2025 Amount (Million Yen) | Growth Rate |
|---|---|---|---|
| Domestic | 14,487 | 14,737 | 1.7% |
| China | 9,534 | 11,348 | 19.0% |
| South Korea | 3,874 | 3,060 | -21.0% |
| Taiwan | 1,274 | 1,302 | 2.3% |
| India | 1,124 | 1,193 | 6.2% |
| Southeast Asia | 2,050 | 2,201 | 7.4% |
| Other Asia | 26 | 25 | -2.1% |
| Asia Total | 17,884 | 19,133 | 7.0% |
| America | 3,734 | 3,529 | -5.5% |
| Europe | 2,475 | 2,471 | -0.2% |
| Other Regions | 689 | 660 | -4.2% |
| Overseas Total | 24,783 | 25,794 | 4.1% |
| Grand Total | 39,270 | 40,531 | 3.2% |
By product group, electronic measuring instruments — the largest category — grew 3.9% to 20,187 million yen, as a new market formed due to technological innovation driven by AI data centers kept orders active and demand for highly reliable tests increased due to battery fire accidents. Recording equipment grew 5.5% to 6,170 million yen, with data loggers steadily expanding sales mainly in the battery and automotive markets.
| Product Group | 2024 Amount (Million Yen) | 2025 Amount (Million Yen) | Rate of Change |
|---|---|---|---|
| Automatic Test Equipment | 3,505 | 3,518 | 0.4% |
| Recording Equipment | 5,846 | 6,170 | 5.5% |
| Electronic Measuring | 19,423 | 20,187 | 3.9% |
| On-site Measuring Instruments (Maintenance) | 8,366 | 8,380 | 0.2% |
| Peripheral Equipment, Others | 2,129 | 2,274 | 6.8% |
2026 Forecast
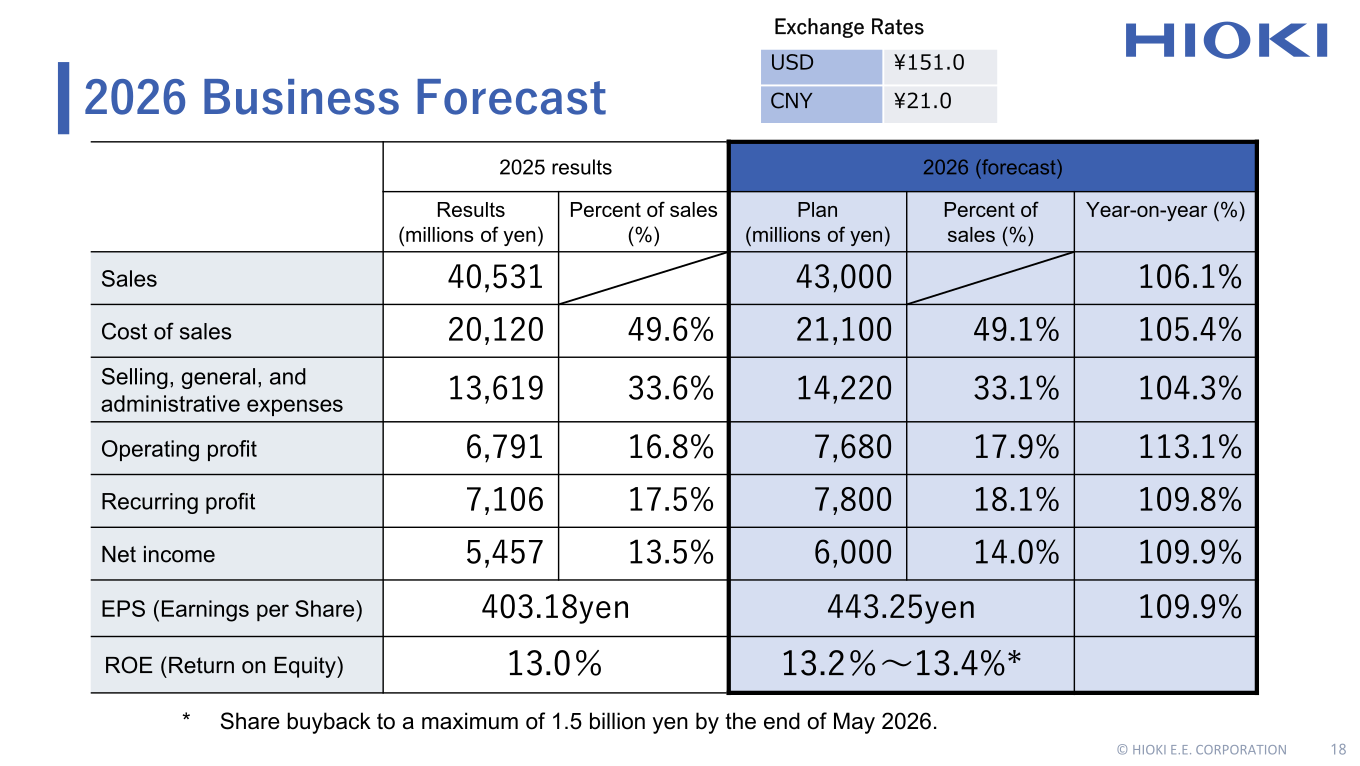
For 2026, HIOKI forecasts sales of 43,000 million yen (106.1% year-on-year), operating profit of 7,680 million yen (113.1%), recurring profit of 7,800 million yen (109.8%), and net income of 6,000 million yen (109.9%). Sales related to data centers are expected to be the driving force, steadily progressing in key regions, while demand for ESS-related products and automotive sector R&D is also expanding. The forecast assumes exchange rates of ¥151.0 to the US dollar and ¥21.0 to the Chinese yuan, and the ROE forecast of 13.2%–13.4% reflects a share buyback to a maximum of 1.5 billion yen by the end of May 2026.
| Item | 2025 Results (millions of yen) | 2026 Plan (millions of yen) | Year-on-year (%) |
|---|---|---|---|
| Sales | 40,531 | 43,000 | 106.1% |
| Cost of sales | 20,120 | 21,100 | 105.4% |
| Selling, general, and administrative expenses | 13,619 | 14,220 | 104.3% |
| Operating profit | 6,791 | 7,680 | 113.1% |
| Recurring profit | 7,106 | 7,800 | 109.8% |
| Net income | 5,457 | 6,000 | 109.9% |
| EPS (Earnings per Share) | 403.18 yen | 443.25 yen | 109.9% |
| ROE (Return on Equity) | 13.0% | 13.2%〜13.4% | — |
Shareholder Returns
Under its cash allocation for 2025–2027, HIOKI plans to allocate cash-in of approximately 40 billion yen — consisting of three-year cumulative cash flow, research and development expenses, and cash and deposits discipline — in roughly equal thirds to research and development expenses, capital investment, and strategic investment and shareholder returns. The company targets a consolidated dividend payout ratio of 40%, with dividends linked to performance, and positions cash and deposit discipline, share buybacks to enhance shareholder value, and M&A as a growth strategy within the strategic investment and shareholder returns category. A share buyback of up to 1.5 billion yen by the end of May 2026 is noted alongside the 2026 forecast. In 2025, dividend payments were 2,704 million yen on a cash flow basis. Per-share dividend amounts are not stated in the presentation materials.
Under guidelines on the consolidated balance sheet disclosed on September 9, 2025, covering the period up to the fiscal year ending December 2030, the company aims to keep the ratio of cash and deposits on the consolidated balance sheet within 20% (managing it within 25% to 30% on an annual average basis for the time being) and aims for a consolidated equity ratio of around 60% (managing it at around 70% for the time being) to minimize the weighted average cost of capital (WACC).
Medium-Term Plan (Vision 2030)
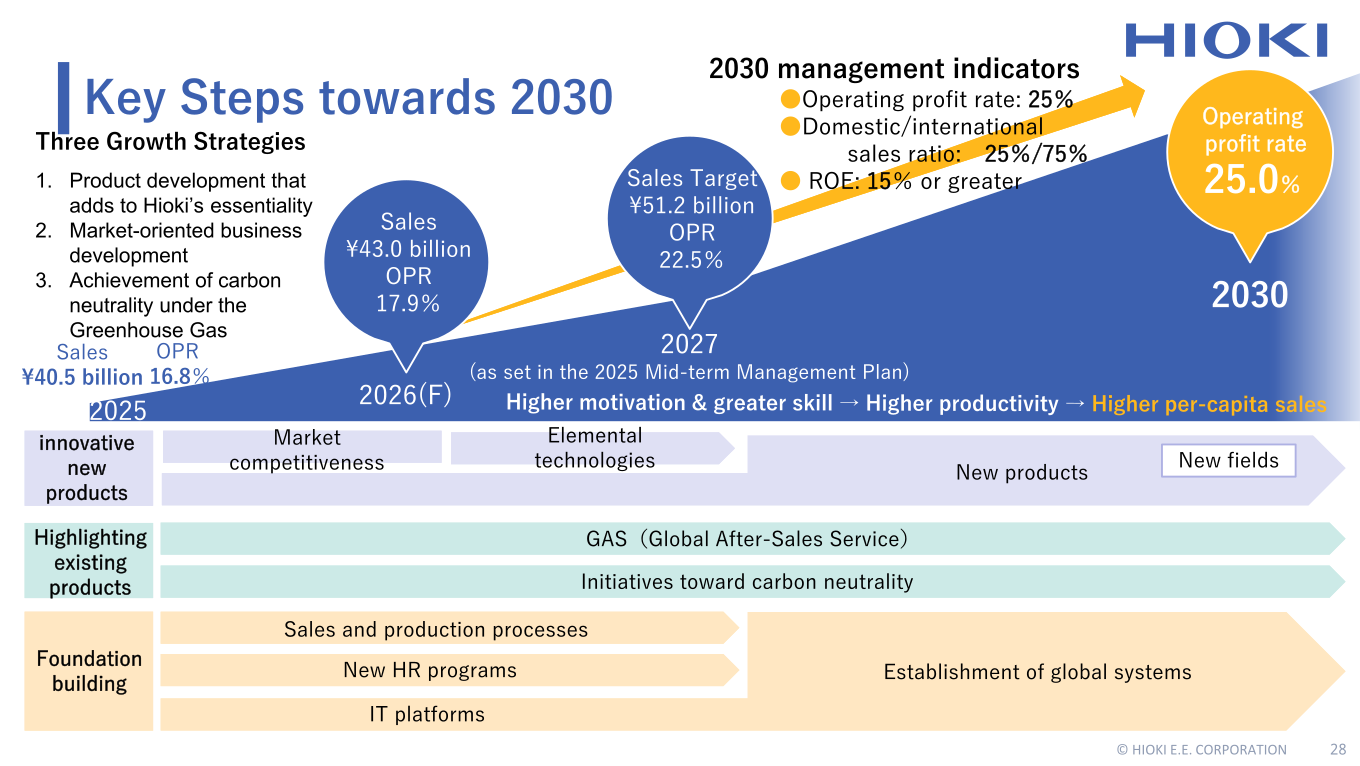
Toward Vision 2030, HIOKI targets 2030 management indicators of an operating profit rate of 25%, a domestic/international sales ratio of 25%/75%, and ROE of 15% or greater. As set in the 2025 Mid-term Management Plan, the sales target for 2027 is ¥51.2 billion with an operating profit rate of 22.5%, compared with sales of ¥40.5 billion and an operating profit rate of 16.8% in 2025 and a 2026 forecast of ¥43.0 billion with an operating profit rate of 17.9%. The three growth strategies are product development that adds to Hioki’s essentiality, market-oriented business development, and achievement of carbon neutrality.
The company focuses development resources on four markets — components, batteries, energy, and mobility — that comprise a new social system built on the transition to alternative energy, efficient use of electrical energy, and digital transformation. For data centers, HIOKI provides electrical measurement solutions across power supply systems, cooling systems, and server equipment, including commissioning tests, backup power verification, and evaluation of GPU components such as MLCCs, power inductors, and large-capacity capacitors. The company is also expanding co-creation hubs with customers in Japan, China, India, and Indonesia, established HIOKI ELECTRIC VIETNAM COMPANY LIMITED in March 2025, and is boosting R&D spending as a percentage of sales to at least 10%.
This article is an analysis based on publicly available information and is not a recommendation to buy or sell any specific securities. Investment decisions are your own responsibility.
![[Obayashi] Investors’ Guide 2026 — The Complete 24-Article Breakdown](https://japan-equity.com/wp-content/uploads/2026/07/hub_cover-1024x1024.png)
![[Obayashi] IR & SR Policy — Feeding Dialogue Back into Management](https://japan-equity.com/wp-content/uploads/2026/07/p32_sq-1024x1024.jpg)
![[Obayashi] Real Estate Development — 18.7% Margin, ¥287.7bn Unrealized Gains](https://japan-equity.com/wp-content/uploads/2026/07/p20_sq-1024x1024.jpg)
![[Obayashi] Domestic Civil Engineering — Resilience Spending Supports 9.6% Margin](https://japan-equity.com/wp-content/uploads/2026/07/p11_sq-1024x1024.jpg)
![[Obayashi] Share Price & External Ratings — vs TOPIX, ESG Index Inclusion](https://japan-equity.com/wp-content/uploads/2026/07/p40_sq-1024x1024.jpg)
![[Construction] ¥75.5tn Investment, Shrinking Workforce — Big-5 Market Share](https://japan-equity.com/wp-content/uploads/2026/07/p12_sq-1024x1024.jpg)



![[Obayashi] Capital Policy & Shareholder Returns — ROE 10%+, DOE ~5%, ¥100bn Buyback](https://japan-equity.com/wp-content/uploads/2026/07/p27_sq-1024x1024.jpg)
![[Obayashi] Reducing Cross-Shareholdings — ¥285.2bn Sold in Five Years](https://japan-equity.com/wp-content/uploads/2026/07/p29_sq-1024x1024.jpg)
![[Obayashi] ¥750bn Investment Plan — ¥300bn to Development, ¥190bn to Tech/DX](https://japan-equity.com/wp-content/uploads/2026/07/p30_sq-1024x1024.jpg)
![[Obayashi] MTP2022 KPIs — Operating Profit ~2x Target, ROE 14.4%](https://japan-equity.com/wp-content/uploads/2026/07/p25_sq-1024x1024.jpg)
![[Obayashi] Cash Allocation — ¥420bn Investment CF Over Five Years](https://japan-equity.com/wp-content/uploads/2026/07/p26_sq-1024x1024.jpg)
![[Obayashi] Green Energy — 44 Plants, 344MW, and the Green Hydrogen Challenge](https://japan-equity.com/wp-content/uploads/2026/07/p21_sq-1024x1024.jpg)
![[Obayashi] Tackling the Labor Shortage — Robotics Construction®](https://japan-equity.com/wp-content/uploads/2026/07/p14_sq-1024x1024.jpg)
