
This article is based on publicly available IR materials and is not a recommendation to buy or sell any specific securities.
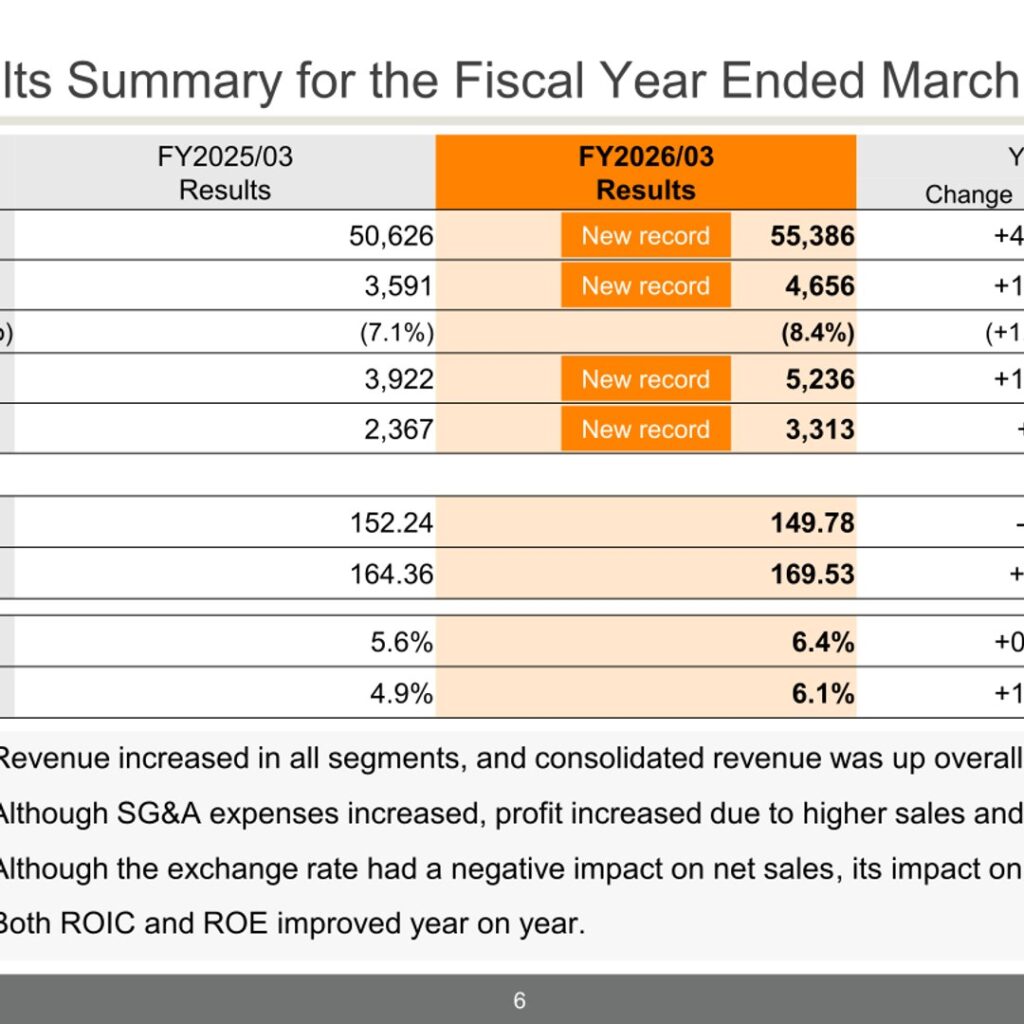
TOA Corporation (Securities Code: 6809), a manufacturer of commercial audio and security equipment, reported record-high results for the fiscal year ended March 31, 2026. Consolidated net sales rose to 55,386 million yen (+9.4% year on year) and operating profit rose to 4,656 million yen (+29.7%), with the company noting that net sales and all profit levels set record highs. The company also achieved all final-year targets of its previous Medium-Term Management Plan and announced a new Medium-Term Management Plan (FY2027/03–FY2029/03) under its Long-Term Management Strategy, NEXT 100 TOA.
Note: The company’s materials label the fiscal year ended March 31, 2026 as “FY2026/03.” This article classifies that year as FY2025 in the title per site convention, while tables and figures below follow the labels used in the materials.
Consolidated Results (Full-Year Actual)
For FY2026/03, revenue increased in all segments and consolidated revenue was up overall. Although SG&A expenses increased, profit increased due to higher sales and an improved cost rate. The exchange rate had a negative impact on net sales, but its impact on profit was limited. Both ROIC and ROE improved year on year, to 6.4% (+0.8 pt) and 6.1% (+1.2 pt) respectively. Compared with the forecast announced on May 2, 2025, net sales and profit at every level exceeded expectations: net sales came in 886 million yen above the forecast of 54,500 million yen, helped by capturing domestic demand for municipal facility projects, efficient expense management that kept SG&A below the initial plan, and a weak yen that boosted ordinary profit and net profit.
| Item (Million yen) | FY2025/03 Results | FY2026/03 Results | Change | Change rate |
|---|---|---|---|---|
| Net sales | 50,626 | 55,386 | +4,760 | +9.4% |
| Operating profit | 3,591 | 4,656 | +1,065 | +29.7% |
| (Operating profit ratio) | (7.1%) | (8.4%) | (+1.3 pt) | — |
| Ordinary profit | 3,922 | 5,236 | +1,313 | +33.5% |
| Net profit* | 2,367 | 3,313 | +945 | +39.9% |
| ROIC | 5.6% | 6.4% | +0.8 pt | — |
| ROE | 4.9% | 6.1% | +1.2 pt | — |
*Profit attributable to owners of parent. Exchange rates applied were 149.78 yen per USD (152.24 yen in FY2025/03) and 169.53 yen per EUR (164.36 yen in FY2025/03).
Segment Results (Regional Segments)
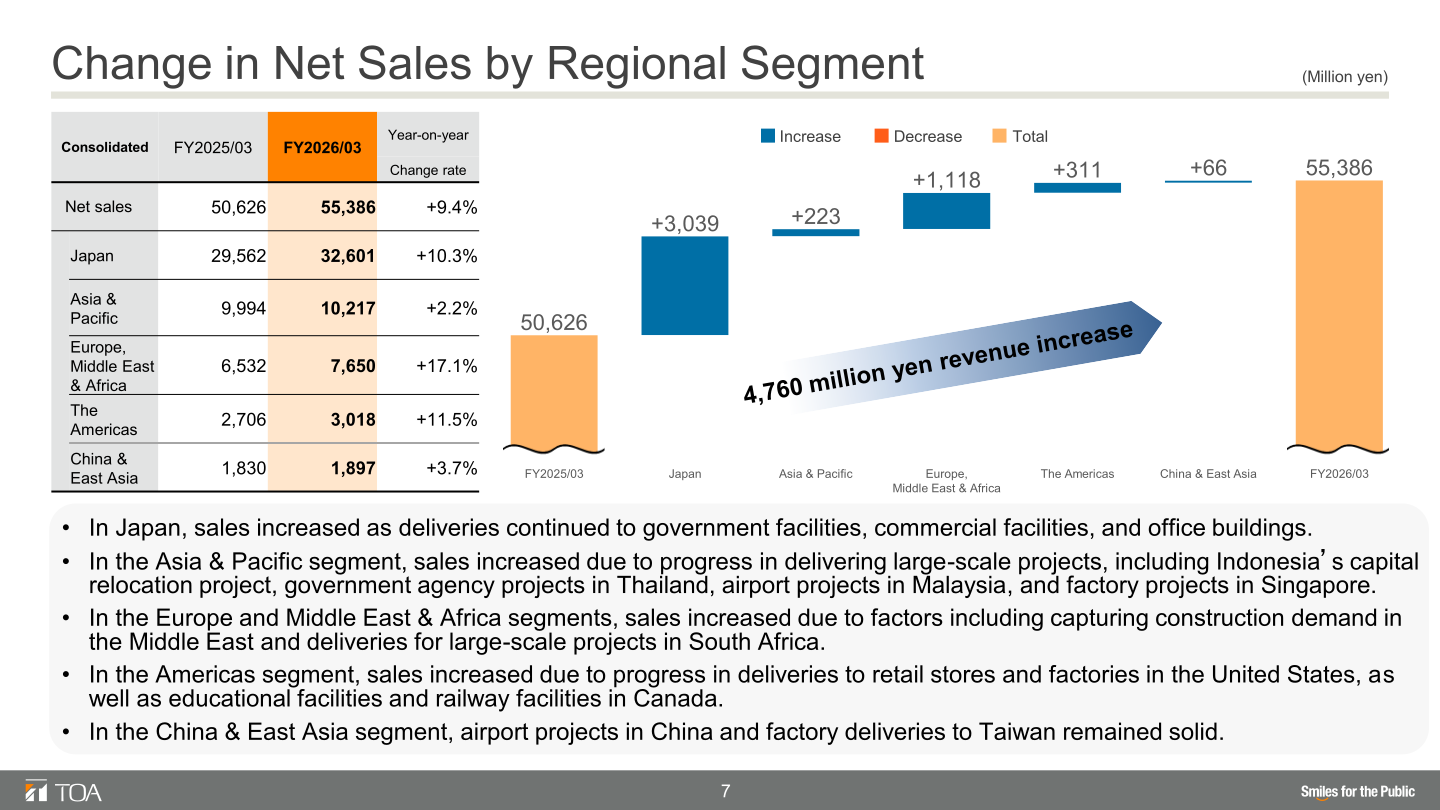
In Japan, sales increased as deliveries continued to government facilities, commercial facilities, and office buildings. In the Asia & Pacific segment, sales increased on progress in delivering large-scale projects, including Indonesia’s capital relocation project, government agency projects in Thailand, airport projects in Malaysia, and factory projects in Singapore. In the Europe and Middle East & Africa segments, sales increased due to factors including capturing construction demand in the Middle East and deliveries for large-scale projects in South Africa. In the Americas, sales increased due to progress in deliveries to retail stores and factories in the United States, as well as educational facilities and railway facilities in Canada. In China & East Asia, airport projects in China and factory deliveries to Taiwan remained solid. On the profit side, Japan increased due to cost rate improvements, and the Americas roughly doubled operating profit due to higher sales despite increased SG&A expenses.
| Segment | Metric (Million yen) | FY2025/03 | FY2026/03 | Change rate |
|---|---|---|---|---|
| Japan | Net sales | 29,562 | 32,601 | +10.3% |
| Japan | Operating profit | 4,121 | 5,284 | +28.2% |
| Asia & Pacific | Net sales | 9,994 | 10,217 | +2.2% |
| Asia & Pacific | Operating profit | 1,597 | 1,716 | +7.5% |
| Europe, Middle East & Africa | Net sales | 6,532 | 7,650 | +17.1% |
| Europe, Middle East & Africa | Operating profit | 633 | 712 | +12.5% |
| The Americas | Net sales | 2,706 | 3,018 | +11.5% |
| The Americas | Operating profit | 105 | 213 | +102.7% |
| China & East Asia | Net sales | 1,830 | 1,897 | +3.7% |
| China & East Asia | Operating profit | 131 | 143 | +9.7% |
FY2027/03 Forecast
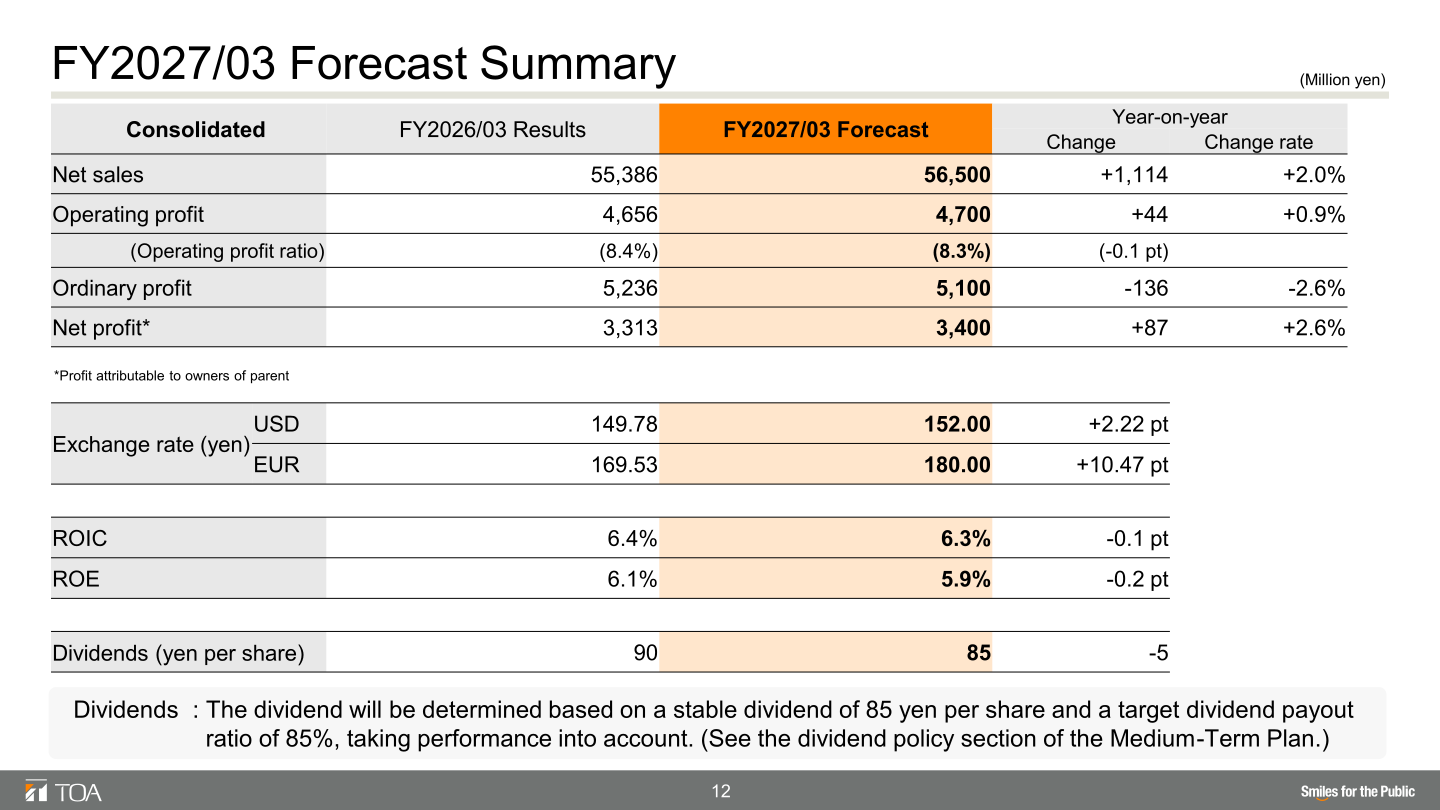
For the fiscal year ending March 31, 2027, the company forecasts net sales of 56,500 million yen (+2.0%) and operating profit of 4,700 million yen (+0.9%). Domestically, demand for capital investment is expected to remain firm, with sales projected to remain at approximately the same level as the previous year, while overseas, large-scale projects including public infrastructure projects in Asia & Pacific are expected to drive growth. The company expects to expand provision of high-added-value solutions, reduce the cost rate by optimizing the product lineup, and improve productivity through a digital shift. Although profit is expected to increase, ROIC is expected to decline temporarily to 6.3% due to upfront investments for future growth. Assumed exchange rates are 152.00 yen per USD and 180.00 yen per EUR.
| Item (Million yen) | FY2026/03 Results | FY2027/03 Forecast | Change rate |
|---|---|---|---|
| Net sales | 55,386 | 56,500 | +2.0% |
| Operating profit | 4,656 | 4,700 | +0.9% |
| (Operating profit ratio) | (8.4%) | (8.3%) | — |
| Ordinary profit | 5,236 | 5,100 | -2.6% |
| Net profit* | 3,313 | 3,400 | +2.6% |
| Dividends (yen per share) | 90 | 85 | — |
*Profit attributable to owners of parent.
Shareholder Returns
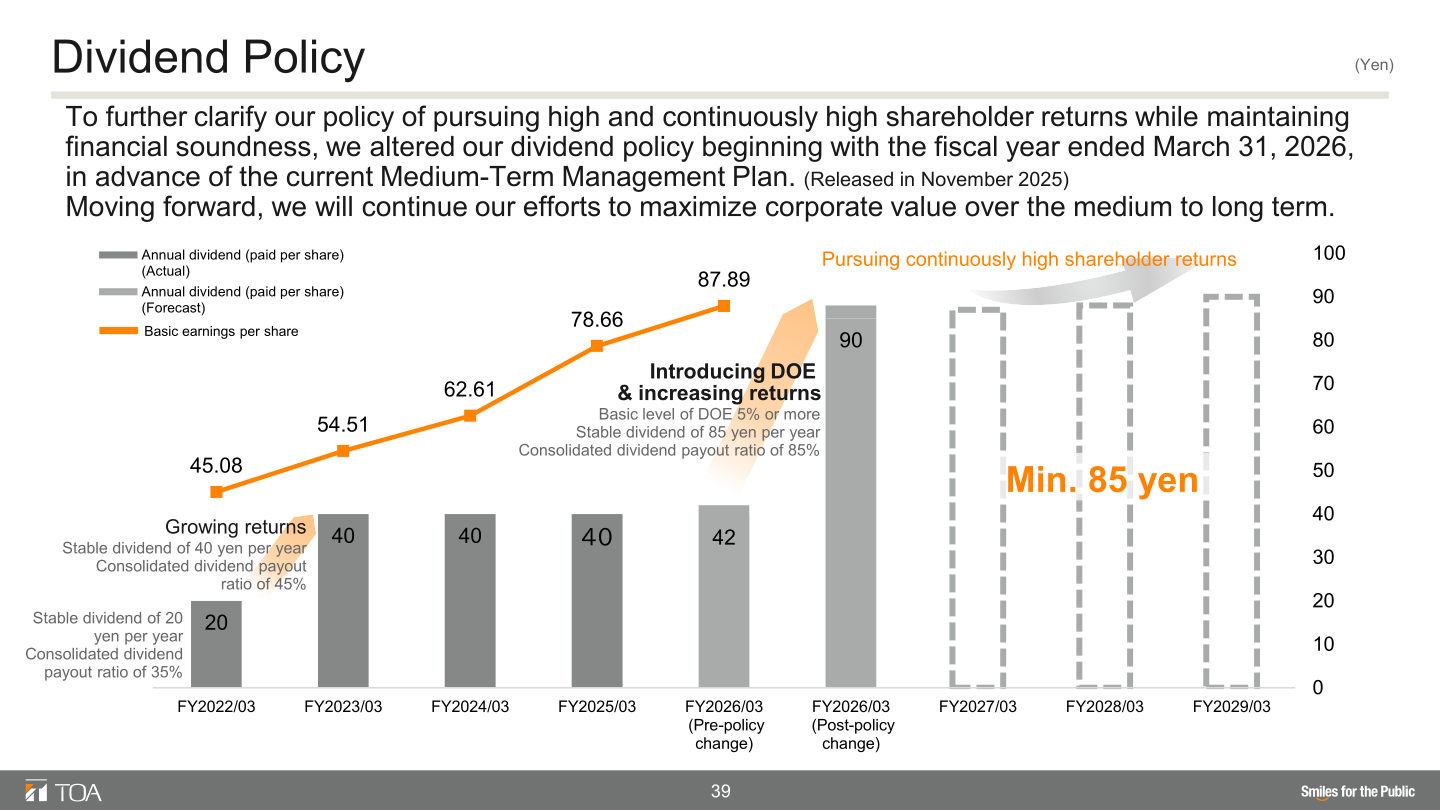
To further clarify its policy of pursuing high and continuous shareholder returns while maintaining financial soundness, TOA altered its dividend policy beginning with the fiscal year ended March 31, 2026, in advance of the current Medium-Term Management Plan (released in November 2025). Under the policy, the company will pursue high and continuous shareholder returns by offering either a stable annual dividend of 85 yen (with a DOE of 5% or higher) or a consolidated dividend payout ratio of 85%, whichever is higher. The annual dividend for FY2026/03 was 90 yen per share, with a dividend payout ratio of 85.0%. For FY2027/03, the dividend will be determined based on a stable dividend of 85 yen per share and a target dividend payout ratio of 85%, taking performance into account.
| Item | FY2025/03 | FY2026/03 | FY2027/03 (Forecast) |
|---|---|---|---|
| Annual dividend per share (yen) | 40 | 90 | 85 |
| Dividend payout ratio | 50.9% | 85.0% | — |
Medium-Term Plan / Long-Term Strategy
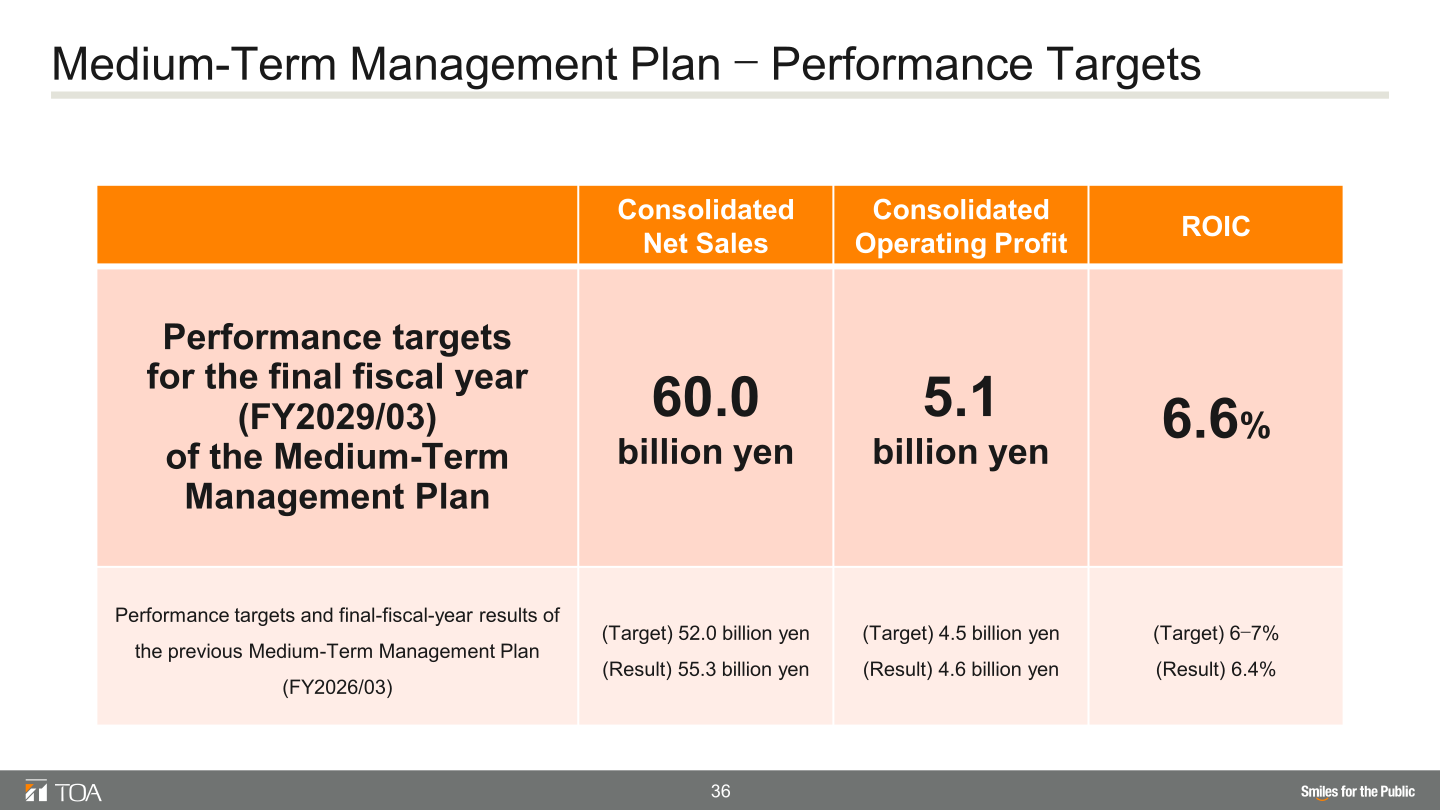
The previous Medium-Term Management Plan (FY2022/03–FY2026/03) achieved all of its final-fiscal-year targets: against targets of consolidated net sales of 52.0 billion yen, consolidated operating profit of 4.5 billion yen, and ROIC of 6–7%, results were 55.3 billion yen, 4.6 billion yen, and 6.4% respectively. PBR remained above 1.0x (as of May 7, 2026) due to company performance growth and dividend policy changes, among other factors.
Under the Long-Term Management Strategy NEXT 100 TOA, which marks the centennial of TOA’s founding in FY2034, the company aims to grow to over 100 billion yen in consolidated net sales by FY2034. The nine years through FY2034 are divided into three stages, and the new Medium-Term Management Plan (FY2027/03–FY2029/03) is positioned as the “Redefinition” stage — a three-year period of structural transformation focused on building a foundation for business through active investment. Performance targets for the final fiscal year (FY2029/03) are consolidated net sales of 60.0 billion yen, consolidated operating profit of 5.1 billion yen, and ROIC of 6.6%. Regional sales targets for FY2029/03 versus FY2026/03 results are: Japan (32.6 billion yen) approx. 1% increase, Europe, Middle East & Africa (7.6 billion yen) approx. 16% increase, Asia & Pacific (12.1 billion yen) approx. 31% increase, and the Americas (3.0 billion yen) approx. 15% increase. The company will integrate the Asia & Pacific Business Department with the China & East Asia Business Department beginning in the fiscal year ending March 31, 2027, and reporting for the two segments will be integrated into a single Asia & Pacific reporting block.
For cash allocation during the plan period (FY2027/03–FY2029/03), the company expects approximately 28.0 billion yen of cash generated from businesses (before R&D and human capital investment deductions) plus approximately 6.8 billion yen from capital optimization/financing, to be allocated to shareholder returns (more than approx. 9.0 billion yen), growth investments (approx. 12.0 billion yen + α), and foundational investments (approx. 5.5 billion yen).
This article is an analysis based on publicly available information and is not a recommendation to buy or sell any specific securities. Investment decisions are your own responsibility.
![[Obayashi] Investors’ Guide 2026 — The Complete 24-Article Breakdown](https://japan-equity.com/wp-content/uploads/2026/07/hub_cover-1024x1024.png)
![[Obayashi] IR & SR Policy — Feeding Dialogue Back into Management](https://japan-equity.com/wp-content/uploads/2026/07/p32_sq-1024x1024.jpg)
![[Obayashi] Real Estate Development — 18.7% Margin, ¥287.7bn Unrealized Gains](https://japan-equity.com/wp-content/uploads/2026/07/p20_sq-1024x1024.jpg)
![[Obayashi] Domestic Civil Engineering — Resilience Spending Supports 9.6% Margin](https://japan-equity.com/wp-content/uploads/2026/07/p11_sq-1024x1024.jpg)
![[Obayashi] Share Price & External Ratings — vs TOPIX, ESG Index Inclusion](https://japan-equity.com/wp-content/uploads/2026/07/p40_sq-1024x1024.jpg)
![[Construction] ¥75.5tn Investment, Shrinking Workforce — Big-5 Market Share](https://japan-equity.com/wp-content/uploads/2026/07/p12_sq-1024x1024.jpg)



![[Obayashi] Capital Policy & Shareholder Returns — ROE 10%+, DOE ~5%, ¥100bn Buyback](https://japan-equity.com/wp-content/uploads/2026/07/p27_sq-1024x1024.jpg)
![[Obayashi] Reducing Cross-Shareholdings — ¥285.2bn Sold in Five Years](https://japan-equity.com/wp-content/uploads/2026/07/p29_sq-1024x1024.jpg)
![[Obayashi] ¥750bn Investment Plan — ¥300bn to Development, ¥190bn to Tech/DX](https://japan-equity.com/wp-content/uploads/2026/07/p30_sq-1024x1024.jpg)
![[Obayashi] MTP2022 KPIs — Operating Profit ~2x Target, ROE 14.4%](https://japan-equity.com/wp-content/uploads/2026/07/p25_sq-1024x1024.jpg)
![[Obayashi] Cash Allocation — ¥420bn Investment CF Over Five Years](https://japan-equity.com/wp-content/uploads/2026/07/p26_sq-1024x1024.jpg)
![[Obayashi] Green Energy — 44 Plants, 344MW, and the Green Hydrogen Challenge](https://japan-equity.com/wp-content/uploads/2026/07/p21_sq-1024x1024.jpg)
![[Obayashi] Tackling the Labor Shortage — Robotics Construction®](https://japan-equity.com/wp-content/uploads/2026/07/p14_sq-1024x1024.jpg)
