
This article is based on publicly available IR materials and is not a recommendation to buy or sell any specific securities.
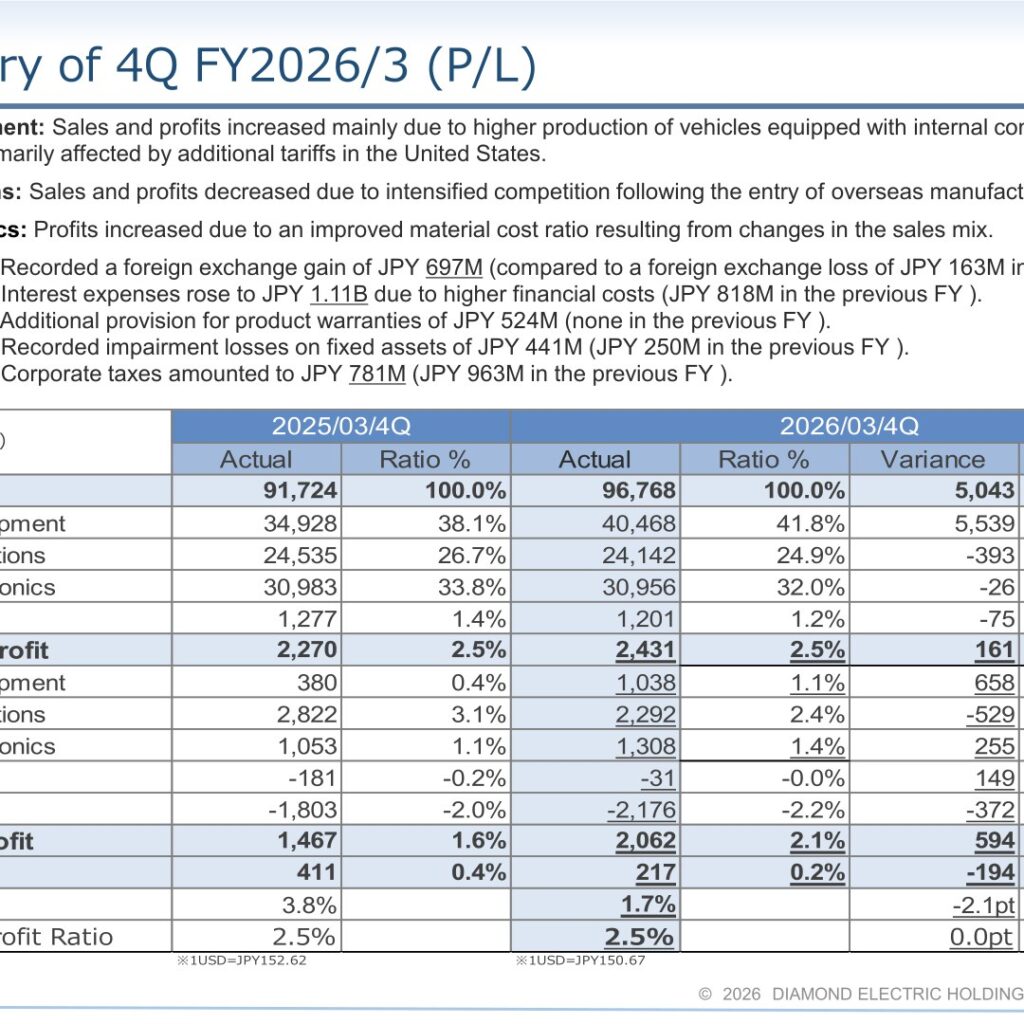
Diamond Electric Holdings Co., Ltd. (Tokyo Stock Exchange Standard Market, 6699) reported consolidated results for the fiscal year ended March 31, 2026, labeled 4Q FY2026/3 in the company’s materials. Net sales rose 5.5% year on year to 96,768 million yen and operating profit increased 7.1% to 2,431 million yen, while net profit declined 47.2% to 217 million yen. For FY2027/3, the company forecasts net sales of 99,400 million yen and operating income of 1,750 million yen.
Note: The company labels the fiscal year ended March 31, 2026 as “FY2026/3” (or “2026/03”) in its materials; this site classifies the most recently completed fiscal year as FY2025 in the article title, while labels in the body and tables follow the materials. This article is based on the corrected version of the presentation “Financial Statement for the Year Ended March 31, 2026,” which the company disclosed on June 29, 2026 together with a partial correction notice.
Consolidated Results (Full-Year Actual)
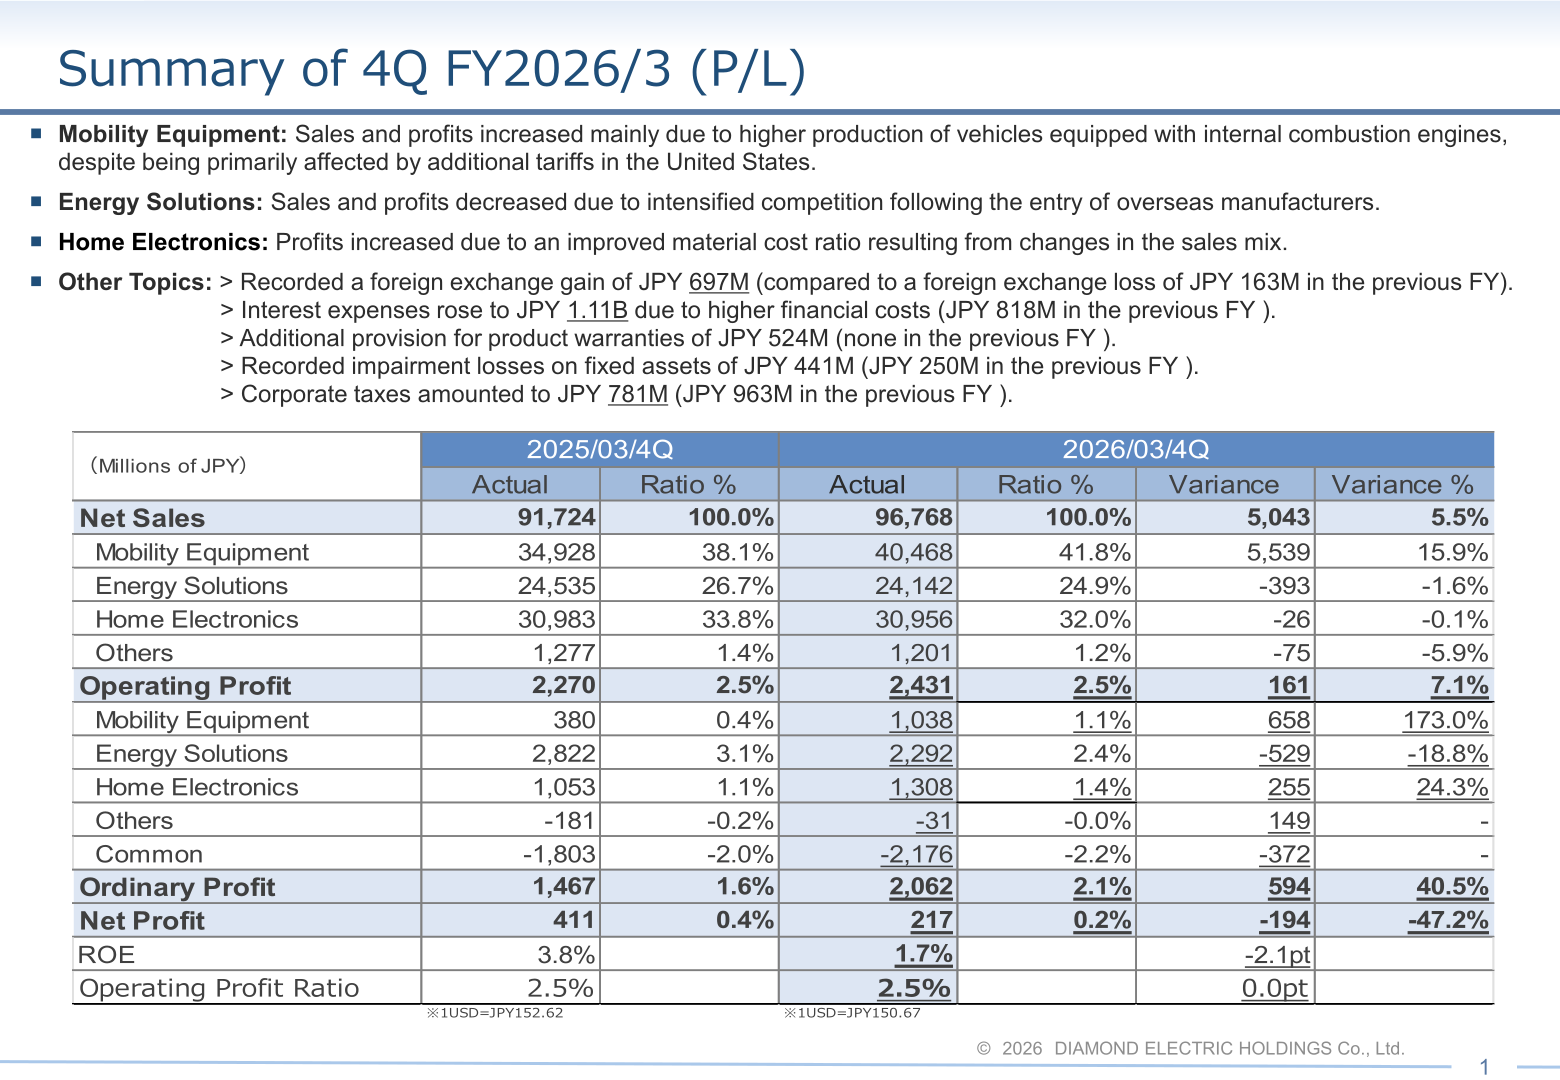
By business, Mobility Equipment sales and profits increased mainly due to higher production of vehicles equipped with internal combustion engines, despite being primarily affected by additional tariffs in the United States. Energy Solutions sales and profits decreased due to intensified competition following the entry of overseas manufacturers. In Home Electronics, profits increased due to an improved material cost ratio resulting from changes in the sales mix.
Other topics for the year: the company recorded a foreign exchange gain of JPY 697M (compared to a foreign exchange loss of JPY 163M in the previous fiscal year); interest expenses rose to JPY 1.11B due to higher financial costs (JPY 818M in the previous fiscal year); an additional provision for product warranties of JPY 524M was recorded (none in the previous fiscal year); impairment losses on fixed assets of JPY 441M were recorded (JPY 250M in the previous fiscal year); and corporate taxes amounted to JPY 781M (JPY 963M in the previous fiscal year).
| Item (Millions of JPY) | 2025/03/4Q Actual | 2026/03/4Q Actual | Variance | Variance % |
|---|---|---|---|---|
| Net Sales | 91,724 | 96,768 | 5,043 | 5.5% |
| Operating Profit | 2,270 | 2,431 | 161 | 7.1% |
| Ordinary Profit | 1,467 | 2,062 | 594 | 40.5% |
| Net Profit | 411 | 217 | -194 | -47.2% |
| ROE | 3.8% | 1.7% | -2.1pt | – |
| Operating Profit Ratio | 2.5% | 2.5% | 0.0pt | – |
Segment Results
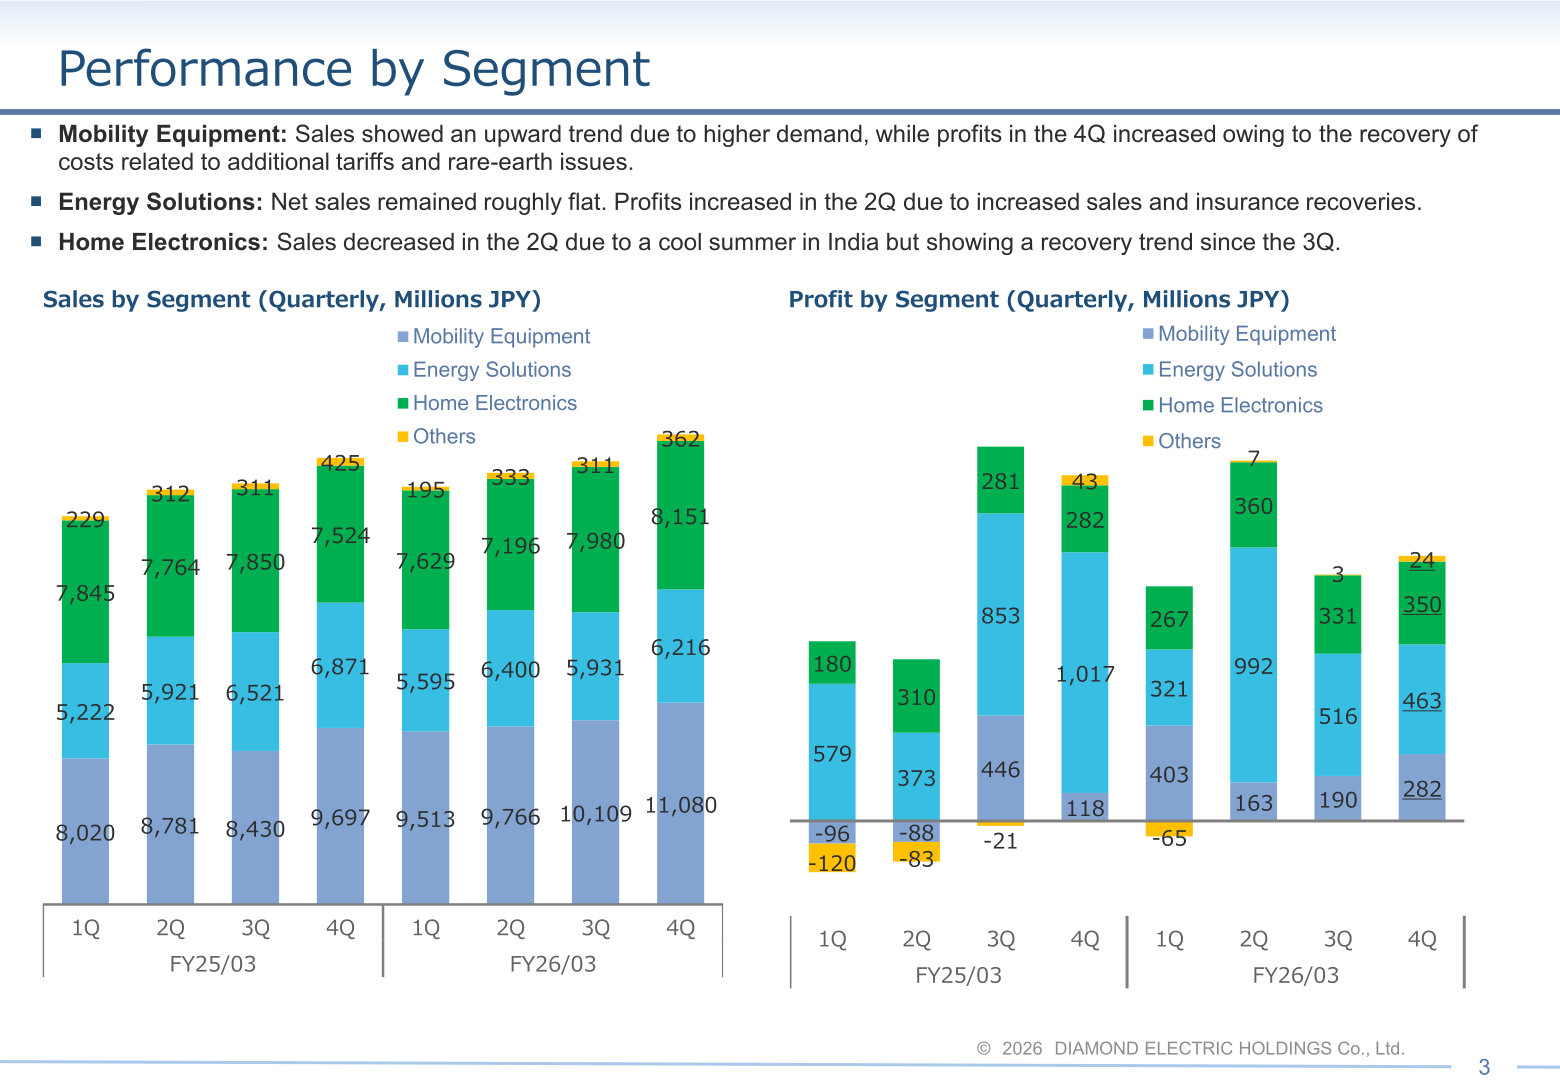
In Mobility Equipment, sales showed an upward trend due to higher demand, while profits in the 4Q increased owing to the recovery of costs related to additional tariffs and rare-earth issues. In Energy Solutions, net sales remained roughly flat, and profits increased in the 2Q due to increased sales and insurance recoveries. In Home Electronics, sales decreased in the 2Q due to a cool summer in India but have been showing a recovery trend since the 3Q.
| Segment | Metric (Millions of JPY) | 2025/03/4Q | 2026/03/4Q | Variance % |
|---|---|---|---|---|
| Mobility Equipment | Net sales | 34,928 | 40,468 | 15.9% |
| Mobility Equipment | Operating profit | 380 | 1,038 | 173.0% |
| Energy Solutions | Net sales | 24,535 | 24,142 | -1.6% |
| Energy Solutions | Operating profit | 2,822 | 2,292 | -18.8% |
| Home Electronics | Net sales | 30,983 | 30,956 | -0.1% |
| Home Electronics | Operating profit | 1,053 | 1,308 | 24.3% |
| Others | Net sales | 1,277 | 1,201 | -5.9% |
| Others | Operating profit | -181 | -31 | – |
| Common | Operating profit | -1,803 | -2,176 | – |
Balance Sheet and Cash Flow
Total assets stood at 83,943 million yen at fiscal year-end, up 4,665 million yen from a year earlier, and the equity ratio improved from 14.4% to 16.7%. Inventories increased by JPY 3.32B, of which JPY 1.12B was due to the impact of foreign exchange fluctuations; the remaining increase of JPY 2.20B was mainly driven by rare-earth-related issues and higher sales in the United States within the Mobility Equipment Business. Interest-bearing liabilities increased to 39,381 million yen to support the growing working capital requirements.
Operating cash flow was -1,379 million yen, investing cash flow was -1,270 million yen, and financial cash flow was +1,315 million yen, with cash and cash equivalents at the end of the period of 6,312 million yen. Free cash flow deteriorated from +JPY 2.94 billion in FY2025/3 to -JPY 2.64 billion (a decrease of JPY 5.59 billion).
Results vs Previous Forecast
Against the annual forecast as of February 12, net sales exceeded the plan by 1.9% and operating income by 15.8%, while net income came in 63.7% below the forecast. In Mobility Equipment, sales and profits increased mainly due to higher production of vehicles equipped with ICE in the U.S., as well as the recovery of costs related to additional tariffs and rare-earth export restrictions. In Energy Solutions, net sales were generally in line with plans, and profits increased due to reduced R&D expenses. In Home Electronics, both net sales and operating profit exceeded forecasts in Europe, resulting in increased sales and profits.
| Item (Millions of JPY) | 2026/03 Previous Forecast (as of Feb.12) | 2026/03 Actual | Variance | Variance % |
|---|---|---|---|---|
| Net Sales | 95,000 | 96,768 | 1,768 | 1.9% |
| Operating income | 2,100 | 2,431 | 331 | 15.8% |
| Ordinary profit | 1,700 | 2,062 | 362 | 21.3% |
| Net Income | 600 | 217 | -382 | -63.7% |
FY2027/3 Forecast
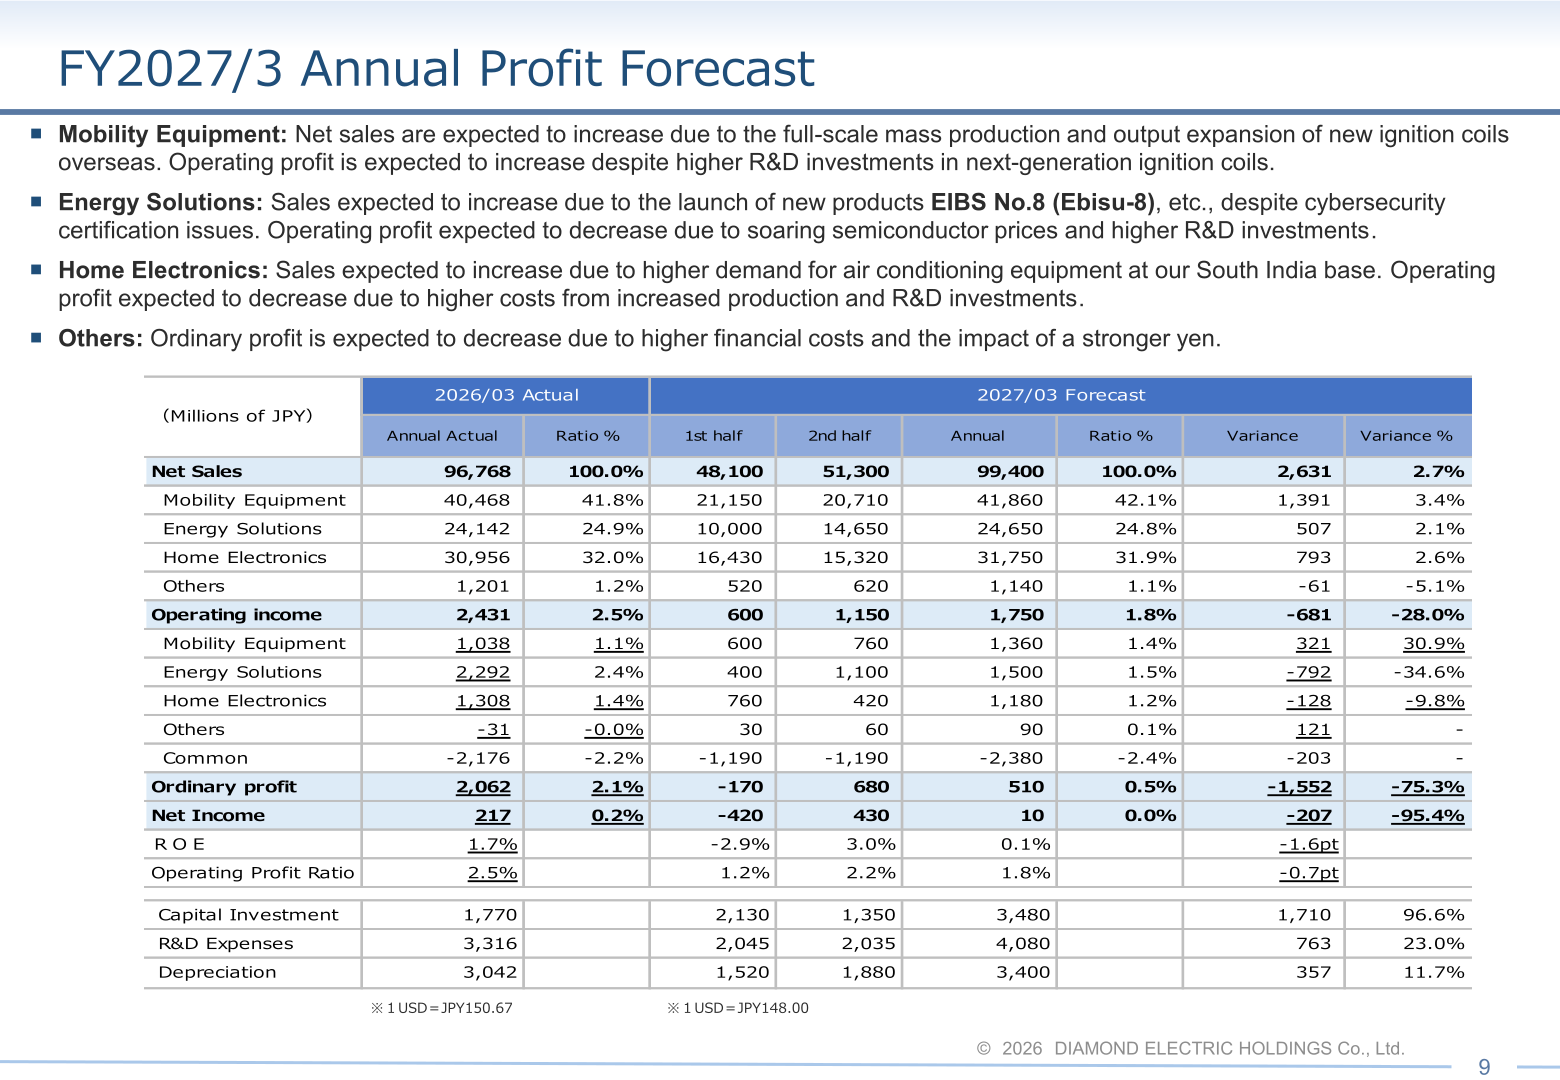
For FY2027/3, in Mobility Equipment, net sales are expected to increase due to the full-scale mass production and output expansion of new ignition coils overseas, and operating profit is expected to increase despite higher R&D investments in next-generation ignition coils. In Energy Solutions, sales are expected to increase due to the launch of new products such as EIBS No.8 (Ebisu-8), despite cybersecurity certification issues, while operating profit is expected to decrease due to soaring semiconductor prices and higher R&D investments. In Home Electronics, sales are expected to increase due to higher demand for air conditioning equipment at the company’s South India base, while operating profit is expected to decrease due to higher costs from increased production and R&D investments. Ordinary profit is expected to decrease due to higher financial costs and the impact of a stronger yen.
| Item (Millions of JPY) | 2026/03 Actual | 2027/03 Forecast | Variance | Variance % |
|---|---|---|---|---|
| Net Sales | 96,768 | 99,400 | 2,631 | 2.7% |
| Operating income | 2,431 | 1,750 | -681 | -28.0% |
| Ordinary profit | 2,062 | 510 | -1,552 | -75.3% |
| Net Income | 217 | 10 | -207 | -95.4% |
| Capital Investment | 1,770 | 3,480 | 1,710 | 96.6% |
| R&D Expenses | 3,316 | 4,080 | 763 | 23.0% |
| Depreciation | 3,042 | 3,400 | 357 | 11.7% |
Shareholder Returns
The consolidated cash flow slide shows dividend payments of 343 million yen as an outflow within financial cash flow for the fiscal year. Dividend per share and the company’s dividend forecast cannot be confirmed from the materials.
This article is an analysis based on publicly available information and is not a recommendation to buy or sell any specific securities. Investment decisions are your own responsibility.
![[Obayashi] Investors’ Guide 2026 — The Complete 24-Article Breakdown](https://japan-equity.com/wp-content/uploads/2026/07/hub_cover-1024x1024.png)
![[Obayashi] IR & SR Policy — Feeding Dialogue Back into Management](https://japan-equity.com/wp-content/uploads/2026/07/p32_sq-1024x1024.jpg)
![[Obayashi] Real Estate Development — 18.7% Margin, ¥287.7bn Unrealized Gains](https://japan-equity.com/wp-content/uploads/2026/07/p20_sq-1024x1024.jpg)
![[Obayashi] Domestic Civil Engineering — Resilience Spending Supports 9.6% Margin](https://japan-equity.com/wp-content/uploads/2026/07/p11_sq-1024x1024.jpg)
![[Obayashi] Share Price & External Ratings — vs TOPIX, ESG Index Inclusion](https://japan-equity.com/wp-content/uploads/2026/07/p40_sq-1024x1024.jpg)
![[Construction] ¥75.5tn Investment, Shrinking Workforce — Big-5 Market Share](https://japan-equity.com/wp-content/uploads/2026/07/p12_sq-1024x1024.jpg)



![[Obayashi] Capital Policy & Shareholder Returns — ROE 10%+, DOE ~5%, ¥100bn Buyback](https://japan-equity.com/wp-content/uploads/2026/07/p27_sq-1024x1024.jpg)
![[Obayashi] Reducing Cross-Shareholdings — ¥285.2bn Sold in Five Years](https://japan-equity.com/wp-content/uploads/2026/07/p29_sq-1024x1024.jpg)
![[Obayashi] ¥750bn Investment Plan — ¥300bn to Development, ¥190bn to Tech/DX](https://japan-equity.com/wp-content/uploads/2026/07/p30_sq-1024x1024.jpg)
![[Obayashi] MTP2022 KPIs — Operating Profit ~2x Target, ROE 14.4%](https://japan-equity.com/wp-content/uploads/2026/07/p25_sq-1024x1024.jpg)
![[Obayashi] Cash Allocation — ¥420bn Investment CF Over Five Years](https://japan-equity.com/wp-content/uploads/2026/07/p26_sq-1024x1024.jpg)
![[Obayashi] Green Energy — 44 Plants, 344MW, and the Green Hydrogen Challenge](https://japan-equity.com/wp-content/uploads/2026/07/p21_sq-1024x1024.jpg)
![[Obayashi] Tackling the Labor Shortage — Robotics Construction®](https://japan-equity.com/wp-content/uploads/2026/07/p14_sq-1024x1024.jpg)
