
This article is based on publicly available IR materials and is not a recommendation to buy or sell any specific securities.
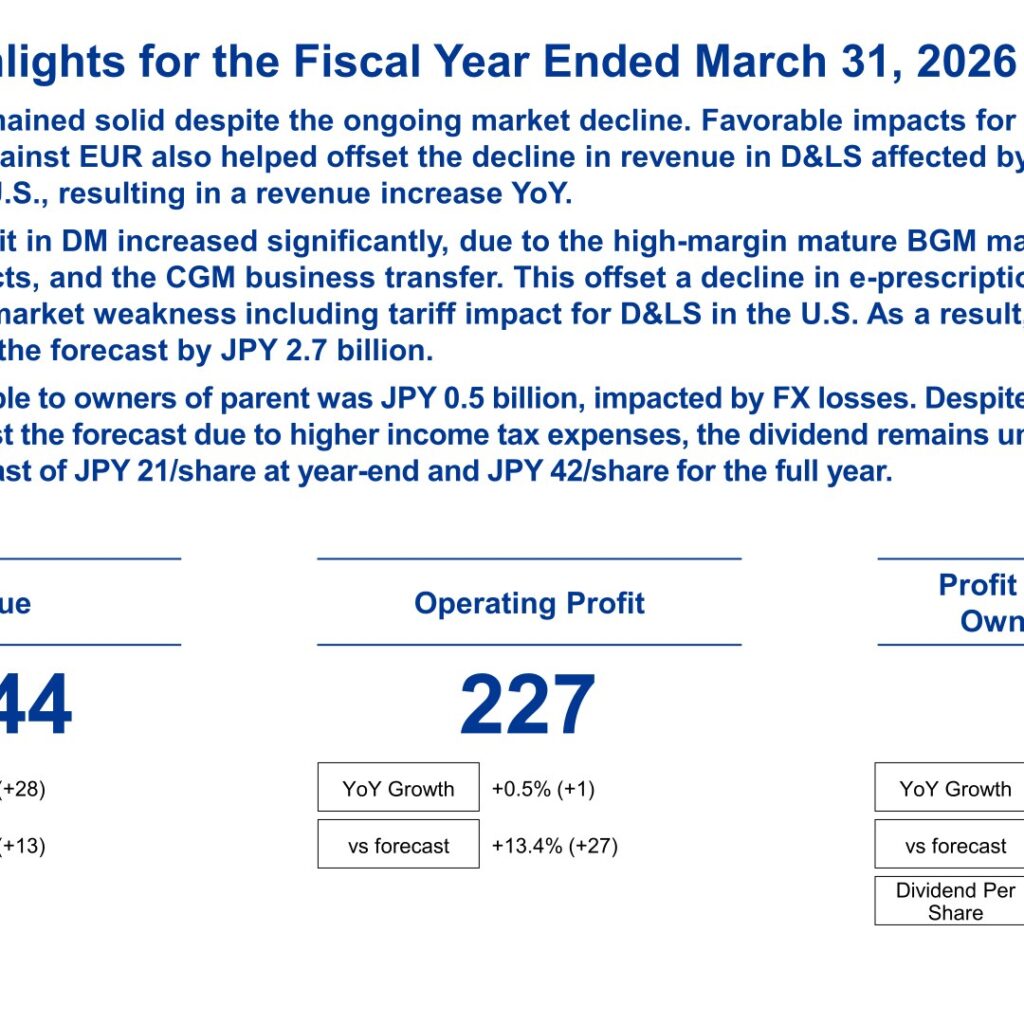
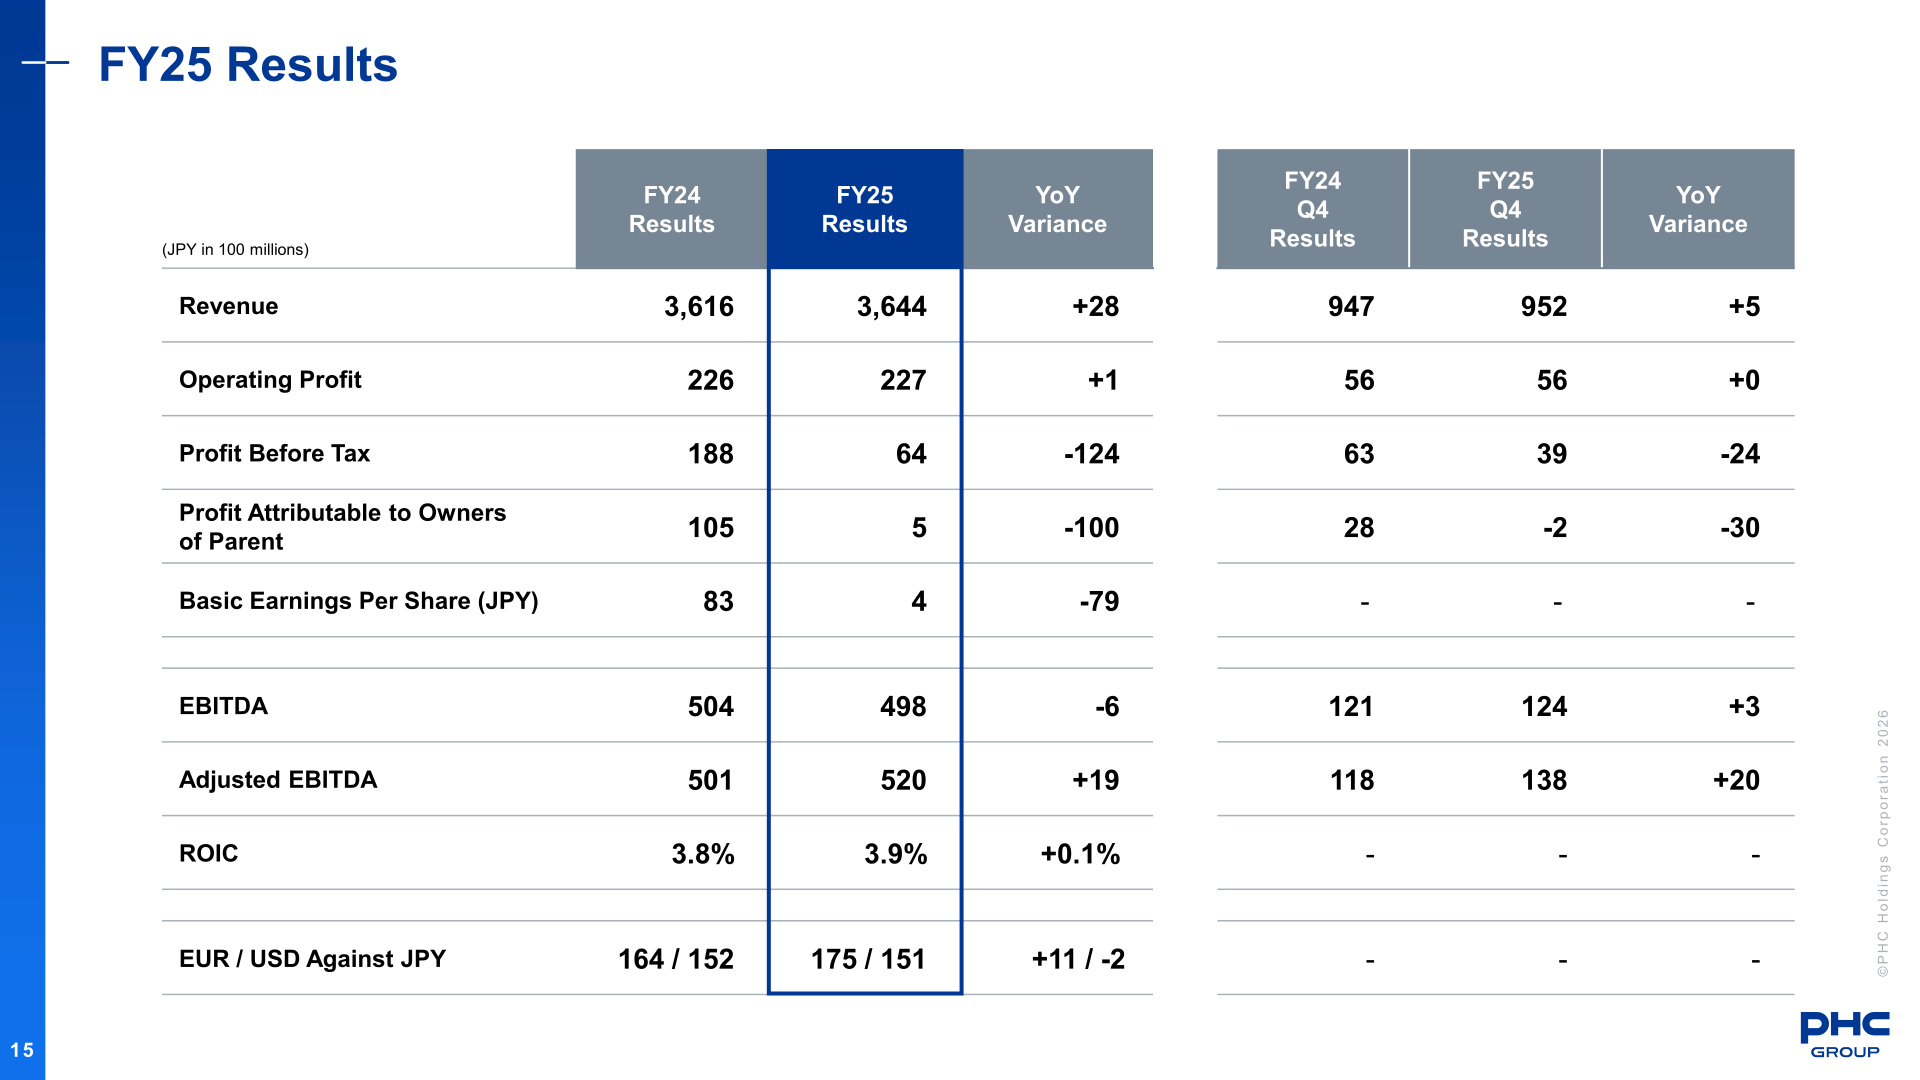
PHC Holdings Corporation (Tokyo Stock Exchange Prime Market, 6523) released its financial results presentation for the fiscal year ended March 31, 2026 (FY2025) on May 13, 2026. Revenue was JPY 3,644 (JPY in 100 millions), up 0.8% year on year, and operating profit was JPY 227 (JPY in 100 millions), up 0.5% year on year and JPY 2.7 billion above the forecast. Profit attributable to owners of parent was JPY 0.5 billion, impacted by FX losses. The dividend was JPY 42 per share for the full year (interim: JPY 21, year-end: JPY 21).
Consolidated Results (Full-Year Actual)
BGM (blood glucose monitoring) sales remained solid despite the ongoing market decline, and favorable impacts for BGM from the weaker JPY against EUR helped offset the decline in revenue in Diagnostics & Life Sciences (D&LS) affected by stagnant markets, mainly in the U.S., resulting in a revenue increase year on year. Operating profit in Diabetes Management increased significantly, due to the high-margin mature BGM market, cost-reduction effects, and the CGM business transfer. Profit attributable to owners of parent was impacted by FX losses: FX valuation losses included in financial expenses for FY25 were JPY 10.5 billion, incurred primarily on the Company’s EUR-denominated borrowings from a subsidiary outside Japan due to the weaker JPY against EUR. The U.S. tariff P&L impact for the year was approx. JPY 1.0 billion.
| Item (JPY in 100 millions) | FY24 Results | FY25 Results | YoY Variance |
|---|---|---|---|
| Revenue | 3,616 | 3,644 | +28 |
| Operating Profit | 226 | 227 | +1 |
| Profit Before Tax | 188 | 64 | -124 |
| Profit Attributable to Owners of Parent | 105 | 5 | -100 |
| Basic Earnings Per Share (JPY) | 83 | 4 | -79 |
| EBITDA | 504 | 498 | -6 |
| Adjusted EBITDA | 501 | 520 | +19 |
| ROIC | 3.8% | 3.9% | +0.1% |
| EUR / USD Against JPY | 164 / 152 | 175 / 151 | +11 / -2 |
Cash flow improved: operating cash flow totaled JPY +42.5 billion, investing cash flow was JPY -8.5 billion, and financing cash flow was JPY -39.8 billion, with cash flow improvement steadily progressing, driven by working capital reduction. Refinancing was completed at the fiscal year-end, shifting the finance structure from a full, long-term, fixed-term repayment to a committed revolving facility, and the net debt leverage ratio (Net Debt / Adjusted EBITDA) decreased to 3.7x.
Segment Results
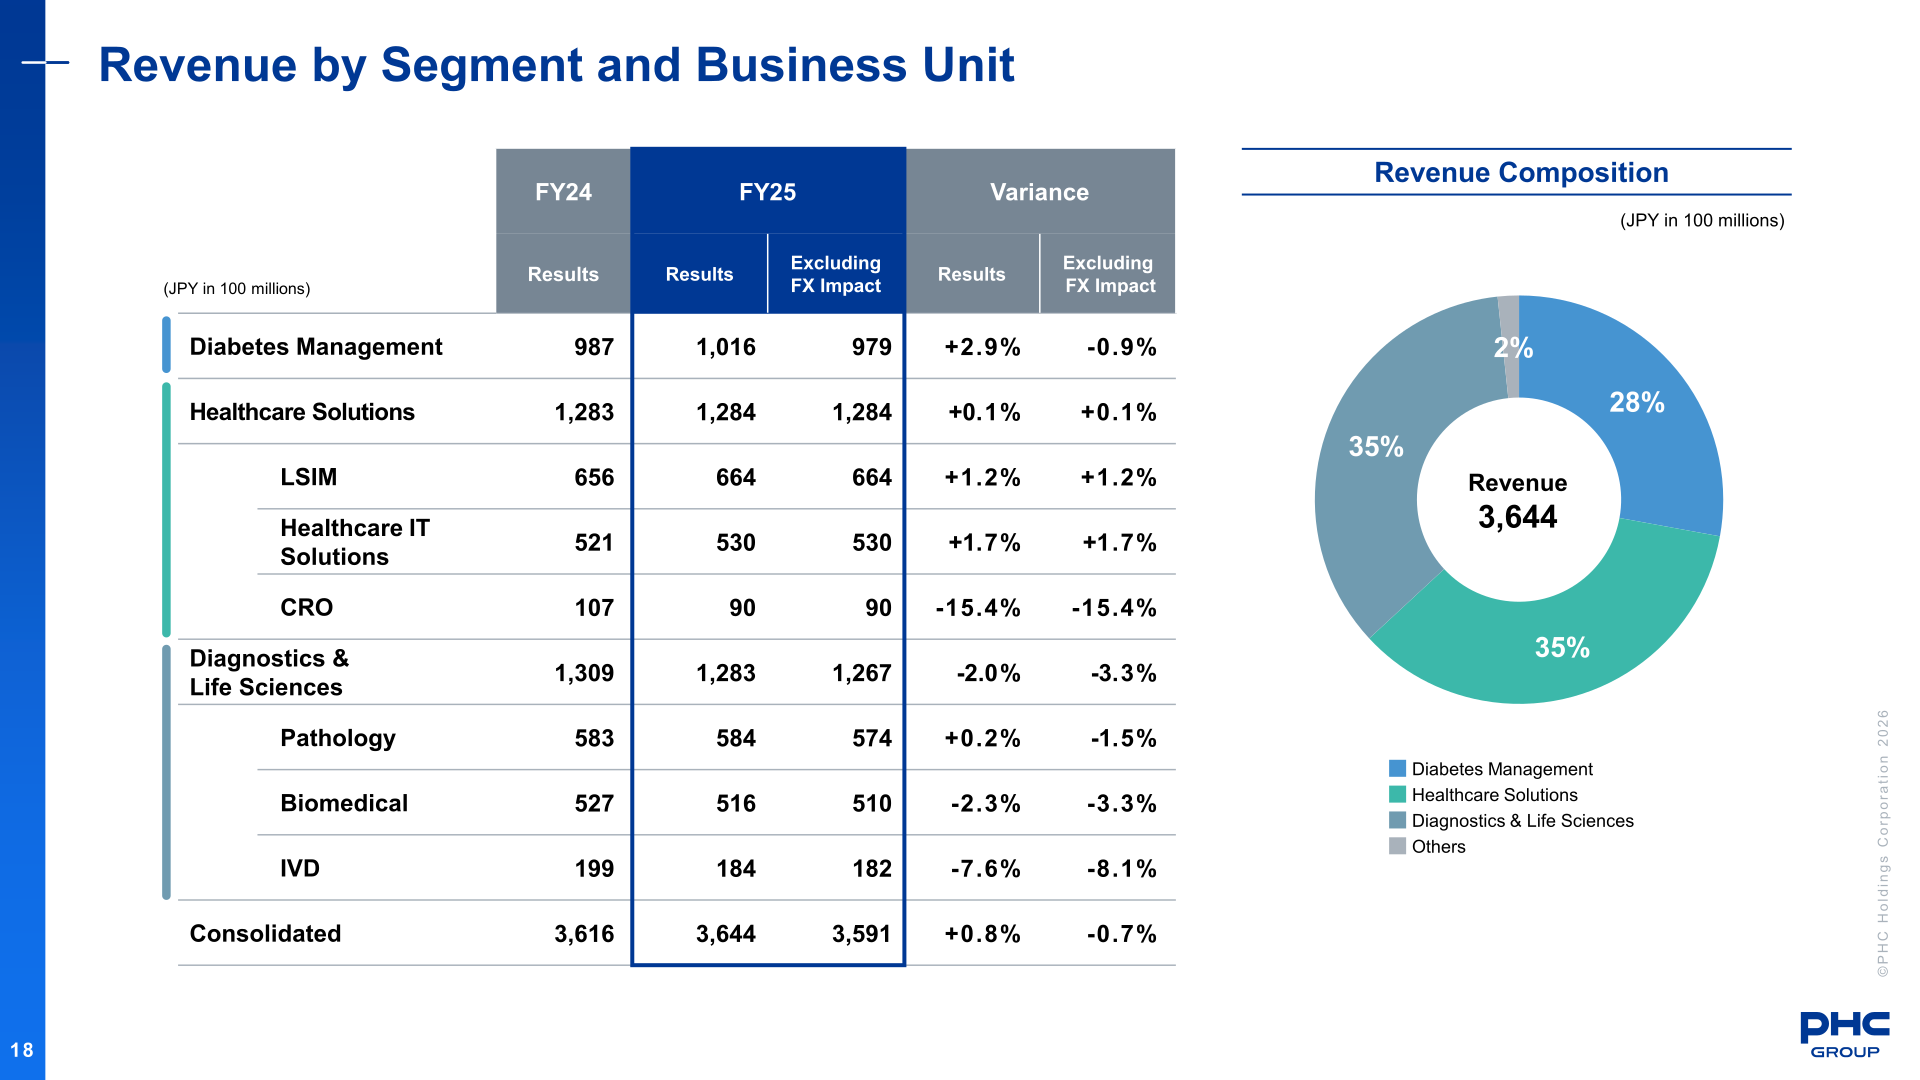
In Diabetes Management, despite the market decline impacting BGM, revenue grew year on year due to solid sales in Europe and the U.S., favorable FX impact against EUR, and increased CGM sales; operating profit increased significantly (margin: 19.8%), driven by strong BGM sales, cost-reduction initiatives, and lower amortization expenses. In Healthcare Solutions, revenue increased on growth in genetic testing at LSI Medience and higher sales of EMR/medical-receipt systems, but operating profit decreased (margin: 4.9%) due to sales mix change, higher procurement and amortization costs, lower CRO revenue, and restructuring costs. In Diagnostics & Life Sciences, revenue declined due to weak equipment demand in the U.S. and lower sales of diagnostic reagents, and full-year operating profit declined substantially (margin: 3.0%), largely due to lower revenue, tariffs, and the corporate function transfer, although operating profit increased significantly in Q4 on price revisions and manufacturing footprint optimization.
| Segment (JPY in 100 millions) | Metric | FY24 Results | FY25 Results | Variance |
|---|---|---|---|---|
| Diabetes Management | Revenue | 987 | 1,016 | +2.9% |
| Healthcare Solutions | Revenue | 1,283 | 1,284 | +0.1% |
| Diagnostics & Life Sciences | Revenue | 1,309 | 1,283 | -2.0% |
| Consolidated | Revenue | 3,616 | 3,644 | +0.8% |
| Diabetes Management | Operating Profit | 139 | 201 | +62 |
| Healthcare Solutions | Operating Profit | 93 | 62 | -30 |
| Diagnostics & Life Sciences | Operating Profit | 72 | 39 | -34 |
| HQ & Others | Operating Profit | -78 | -75 | +3 |
| Consolidated | Operating Profit | 226 | 227 | +1 |
By region, revenue in Japan was JPY 1,546 (JPY in 100 millions, -1.1% YoY), Europe JPY 910 (+8.1%), North America JPY 750 (-5.0%), and Others JPY 438 (+3.9%). In Japan, despite growth in LSIM and Healthcare IT Solutions, revenue decreased slightly due to declines in CRO and IVD. In Europe, revenue increased due to solid performance in BGM and D&LS, as well as favorable FX. In North America, revenue declined due to the lower demand in D&LS, despite growth in DM.
FY26 Full Year Forecasts
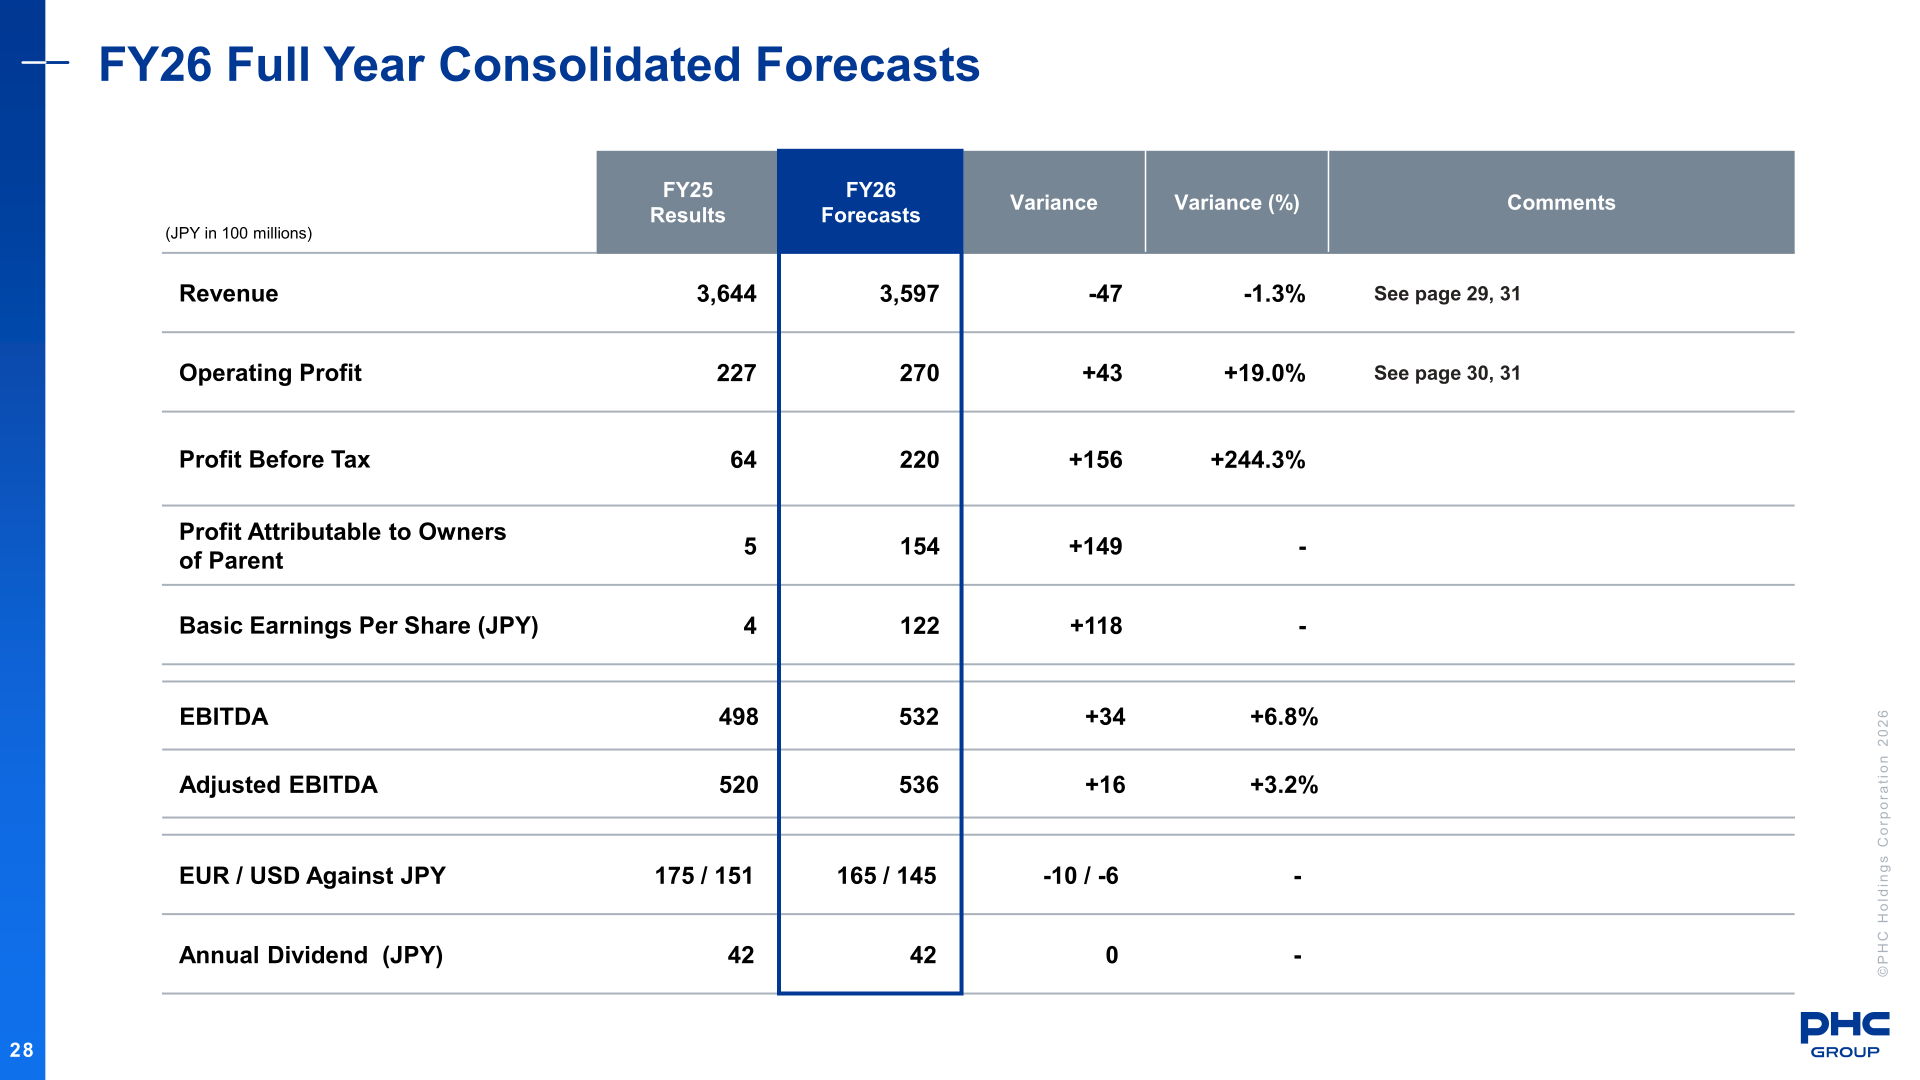
For FY26, the company expects revenue growth of 1.2% excluding FX impact, despite a decrease in reported revenue due to an FX assumption of a stronger JPY year on year and the CGM divestiture. Profitability is expected to improve through the CGM divestiture and cost improvement initiatives, with operating profit forecast to increase by JPY 4.3 billion to JPY 27.0 billion. Profit attributable to owners of parent is forecast to increase by JPY 14.9 billion to JPY 15.4 billion, assuming no FX impact despite higher interest expenses. The annual dividend is planned to be JPY 42 per share, unchanged from the previous year.
| Item (JPY in 100 millions) | FY25 Results | FY26 Forecasts | Variance | Variance (%) |
|---|---|---|---|---|
| Revenue | 3,644 | 3,597 | -47 | -1.3% |
| Operating Profit | 227 | 270 | +43 | +19.0% |
| Profit Before Tax | 64 | 220 | +156 | +244.3% |
| Profit Attributable to Owners of Parent | 5 | 154 | +149 | – |
| Basic Earnings Per Share (JPY) | 4 | 122 | +118 | – |
| EBITDA | 498 | 532 | +34 | +6.8% |
| Adjusted EBITDA | 520 | 536 | +16 | +3.2% |
| EUR / USD Against JPY | 175 / 151 | 165 / 145 | -10 / -6 | – |
| Annual Dividend (JPY) | 42 | 42 | 0 | – |
By segment, FY26 revenue is forecast at JPY 923 (JPY in 100 millions) for Diabetes Management (-9.1%), JPY 1,321 for Healthcare Solutions (+2.9%), and JPY 1,352 for Diagnostics & Life Sciences (+5.4%); segment operating profit is forecast at JPY 240 for Diabetes Management (+19.5%), JPY 65 for Healthcare Solutions (+4.3%), and JPY 49 for Diagnostics & Life Sciences (+25.9%). Starting in FY26, the B2B business in Indonesia, previously included under HQ and Others, was transferred to Diagnostics and Life Sciences. Also effective FY26, the Biomedical and IVD Business Units were integrated into a single business unit called the Life Sciences Business Unit.
Shareholder Returns
The FY25 dividend per share was JPY 42 for the full year (interim: JPY 21, year-end: JPY 21), unchanged from the previous forecast despite the profit shortfall against the forecast due to higher income tax expenses. For FY26, the annual dividend is planned at JPY 42, unchanged from the previous year. On cash allocation, the company states it will maintain the dividend at the upper limit of shareholder returns indicated in the Value Creation Plan. The tradable share ratio improved by 4.6% to 40.4% through partial divestment by the major shareholders.
Medium-Term Plan: Value Creation Plan Progress
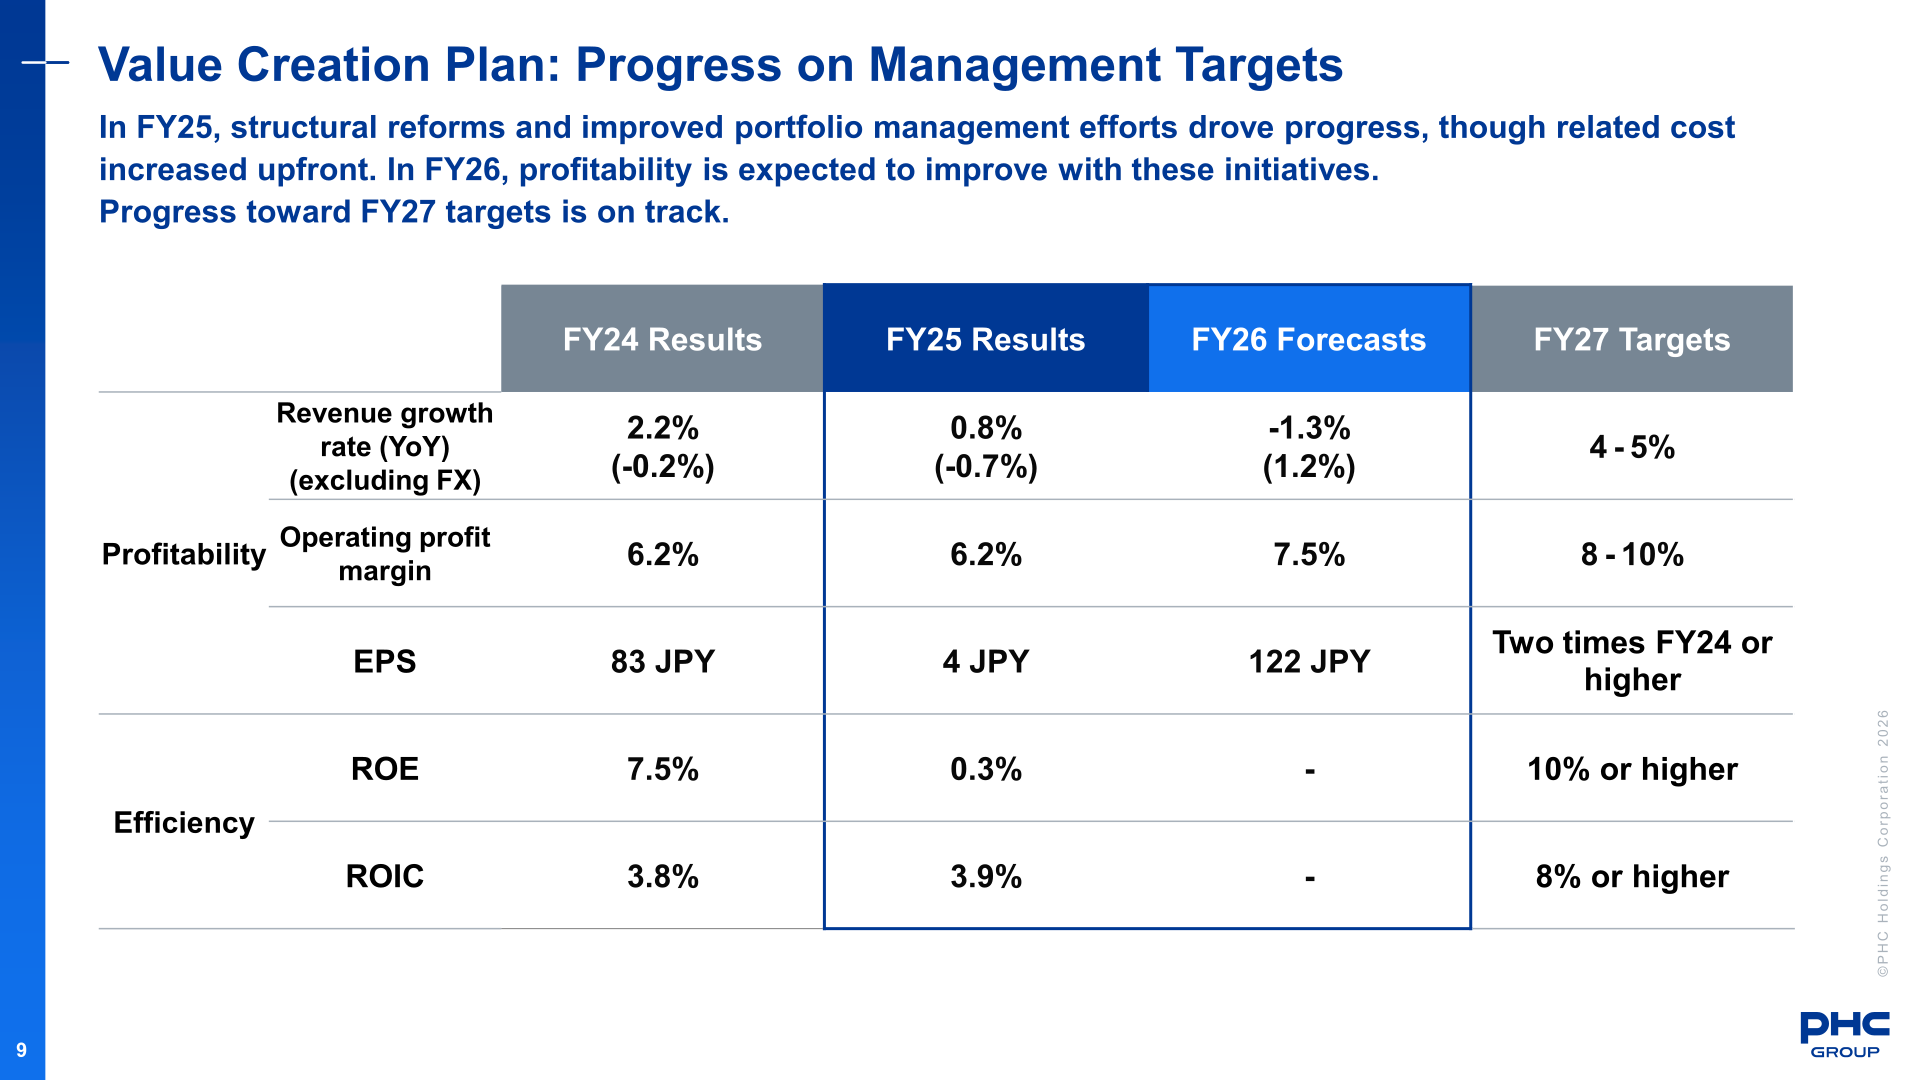
FY25 was the first year of the Value Creation Plan, and restructuring and portfolio management initiatives progressed on track. Structural reform to strengthen the profit base delivered approx. JPY 3.1 billion of improvement in FY25 (FY26 forecast: approx. JPY 3.6 billion), against a targeted impact of +8-12 billion JPY in FY27 compared to FY24. Under improved portfolio management, the CGM divestiture agreement was signed, with the U.S. business transfer completed and completion expected in FY26. Against the FY27 targets — revenue growth rate of 4-5%, operating profit margin of 8-10%, EPS of two times FY24 or higher, ROE of 10% or higher, and ROIC of 8% or higher — FY25 results were revenue growth of 0.8% (-0.7% excluding FX), an operating profit margin of 6.2%, EPS of JPY 4, ROE of 0.3%, and ROIC of 3.9%, with FY26 forecasts of -1.3% revenue growth (+1.2% excluding FX), a 7.5% operating profit margin, and EPS of JPY 122. The company states that progress toward the FY27 targets is on track.
This article is an analysis based on publicly available information and is not a recommendation to buy or sell any specific securities. Investment decisions are your own responsibility.
![[Obayashi] Investors’ Guide 2026 — The Complete 24-Article Breakdown](https://japan-equity.com/wp-content/uploads/2026/07/hub_cover-1024x1024.png)
![[Obayashi] IR & SR Policy — Feeding Dialogue Back into Management](https://japan-equity.com/wp-content/uploads/2026/07/p32_sq-1024x1024.jpg)
![[Obayashi] Domestic Civil Engineering — Resilience Spending Supports 9.6% Margin](https://japan-equity.com/wp-content/uploads/2026/07/p11_sq-1024x1024.jpg)
![[Obayashi] Overseas Construction — Orders Reach ¥1.2tn](https://japan-equity.com/wp-content/uploads/2026/07/p15_sq-1024x1024.jpg)
![[Obayashi] Share Price & External Ratings — vs TOPIX, ESG Index Inclusion](https://japan-equity.com/wp-content/uploads/2026/07/p40_sq-1024x1024.jpg)
![[Construction] ¥75.5tn Investment, Shrinking Workforce — Big-5 Market Share](https://japan-equity.com/wp-content/uploads/2026/07/p12_sq-1024x1024.jpg)



![[Obayashi] Capital Policy & Shareholder Returns — ROE 10%+, DOE ~5%, ¥100bn Buyback](https://japan-equity.com/wp-content/uploads/2026/07/p27_sq-1024x1024.jpg)
![[Obayashi] Reducing Cross-Shareholdings — ¥285.2bn Sold in Five Years](https://japan-equity.com/wp-content/uploads/2026/07/p29_sq-1024x1024.jpg)
![[Obayashi] ¥750bn Investment Plan — ¥300bn to Development, ¥190bn to Tech/DX](https://japan-equity.com/wp-content/uploads/2026/07/p30_sq-1024x1024.jpg)
![[Obayashi] MTP2022 KPIs — Operating Profit ~2x Target, ROE 14.4%](https://japan-equity.com/wp-content/uploads/2026/07/p25_sq-1024x1024.jpg)
![[Obayashi] Cash Allocation — ¥420bn Investment CF Over Five Years](https://japan-equity.com/wp-content/uploads/2026/07/p26_sq-1024x1024.jpg)
![[Obayashi] Green Energy — 44 Plants, 344MW, and the Green Hydrogen Challenge](https://japan-equity.com/wp-content/uploads/2026/07/p21_sq-1024x1024.jpg)
![[Obayashi] Tackling the Labor Shortage — Robotics Construction®](https://japan-equity.com/wp-content/uploads/2026/07/p14_sq-1024x1024.jpg)
