
This article is based on publicly available IR materials and is not a recommendation to buy or sell any specific securities.
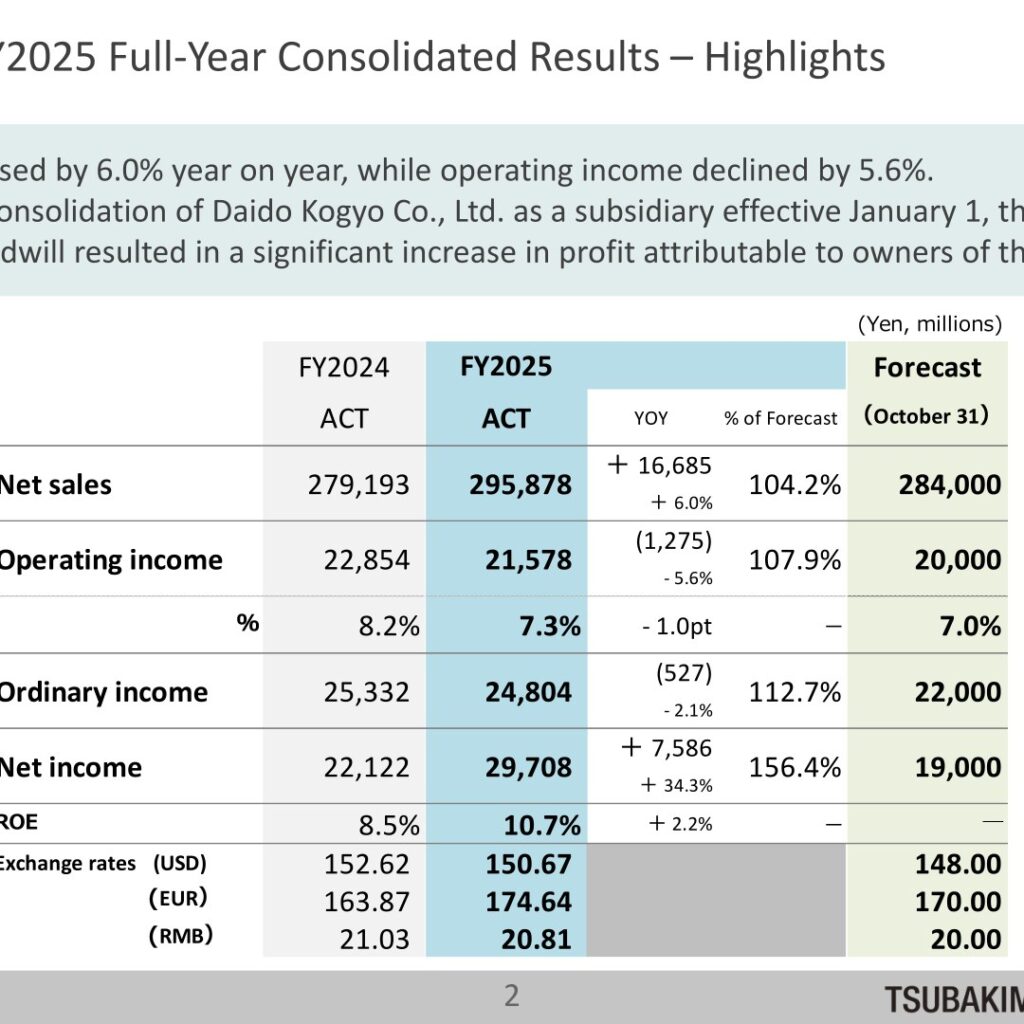
Tsubakimoto Chain Co. reported FY2025 full-year consolidated net sales of 295,878 million yen, up 16,685 million yen or 6.0% year on year, while operating income declined by 1,275 million yen, or 5.6%, to 21,578 million yen. Following the consolidation of Daido Kogyo Co., Ltd. as a subsidiary effective January 1, the recognition of negative goodwill resulted in a significant increase in profit attributable to owners of the parent, which rose 34.3% to 29,708 million yen. All four reported figures came in above the forecast announced on October 31, with net income reaching 156.4% of that forecast. The materials label the fiscal year covered here as FY2025, defined on the company’s disclosure page as the year from April 1, 2025 to March 31, 2026.
Consolidated Results (Full-Year Actual)
Net sales grew 6.0% year on year and beat the October 31 forecast of 284,000 million yen. Operating income fell 5.6% and the operating margin narrowed by 1.0pt to 7.3%, but still exceeded the 7.0% assumed in the forecast. ROE improved by 2.2% to 10.7%. Average exchange rates used were 150.67 yen to the U.S. dollar, 174.64 yen to the euro and 20.81 yen to the renminbi.
| Item (Yen, millions) | FY2024 ACT | FY2025 ACT | YOY | % of Forecast | Forecast (October 31) |
|---|---|---|---|---|---|
| Net sales | 279,193 | 295,878 | + 16,685 (+ 6.0%) | 104.2% | 284,000 |
| Operating income | 22,854 | 21,578 | (1,275) (- 5.6%) | 107.9% | 20,000 |
| Operating margin (%) | 8.2% | 7.3% | – 1.0pt | ― | 7.0% |
| Ordinary income | 25,332 | 24,804 | (527) (- 2.1%) | 112.7% | 22,000 |
| Net income | 22,122 | 29,708 | + 7,586 (+ 34.3%) | 156.4% | 19,000 |
| ROE | 8.5% | 10.7% | + 2.2% | ― | ― |
| Exchange rates (USD) | 152.62 | 150.67 | ― | ― | 148.00 |
| Exchange rates (EUR) | 163.87 | 174.64 | ― | ― | 170.00 |
| Exchange rates (RMB) | 21.03 | 20.81 | ― | ― | 20.00 |
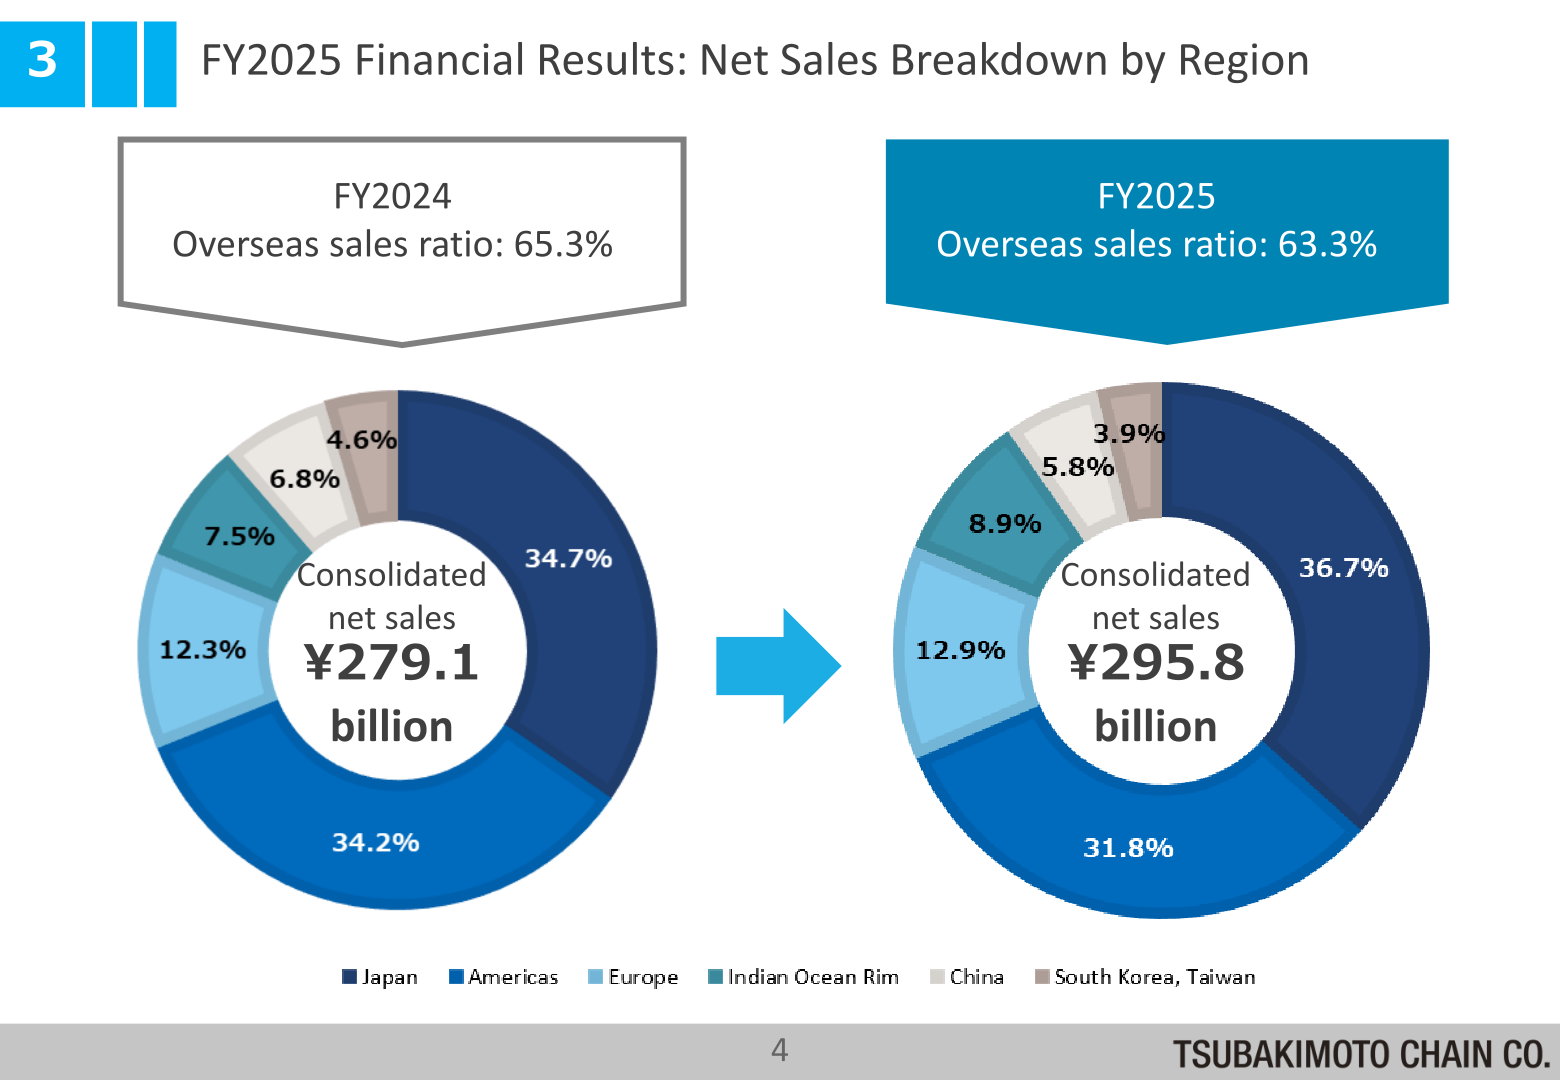
By region, the overseas sales ratio moved from 65.3% in FY2024 to 63.3% in FY2025, against consolidated net sales of ¥279.1 billion and ¥295.8 billion respectively. The regional mix shifted from Japan 34.7%, the Americas 34.2%, Europe 12.3%, Indian Ocean Rim 7.5%, China 6.8% and South Korea/Taiwan 4.6% in FY2024, to Japan 36.7%, the Americas 31.8%, Europe 12.9%, Indian Ocean Rim 8.9%, China 5.8% and South Korea/Taiwan 3.9% in FY2025.
Analysis of Change in Consolidated Operating Income
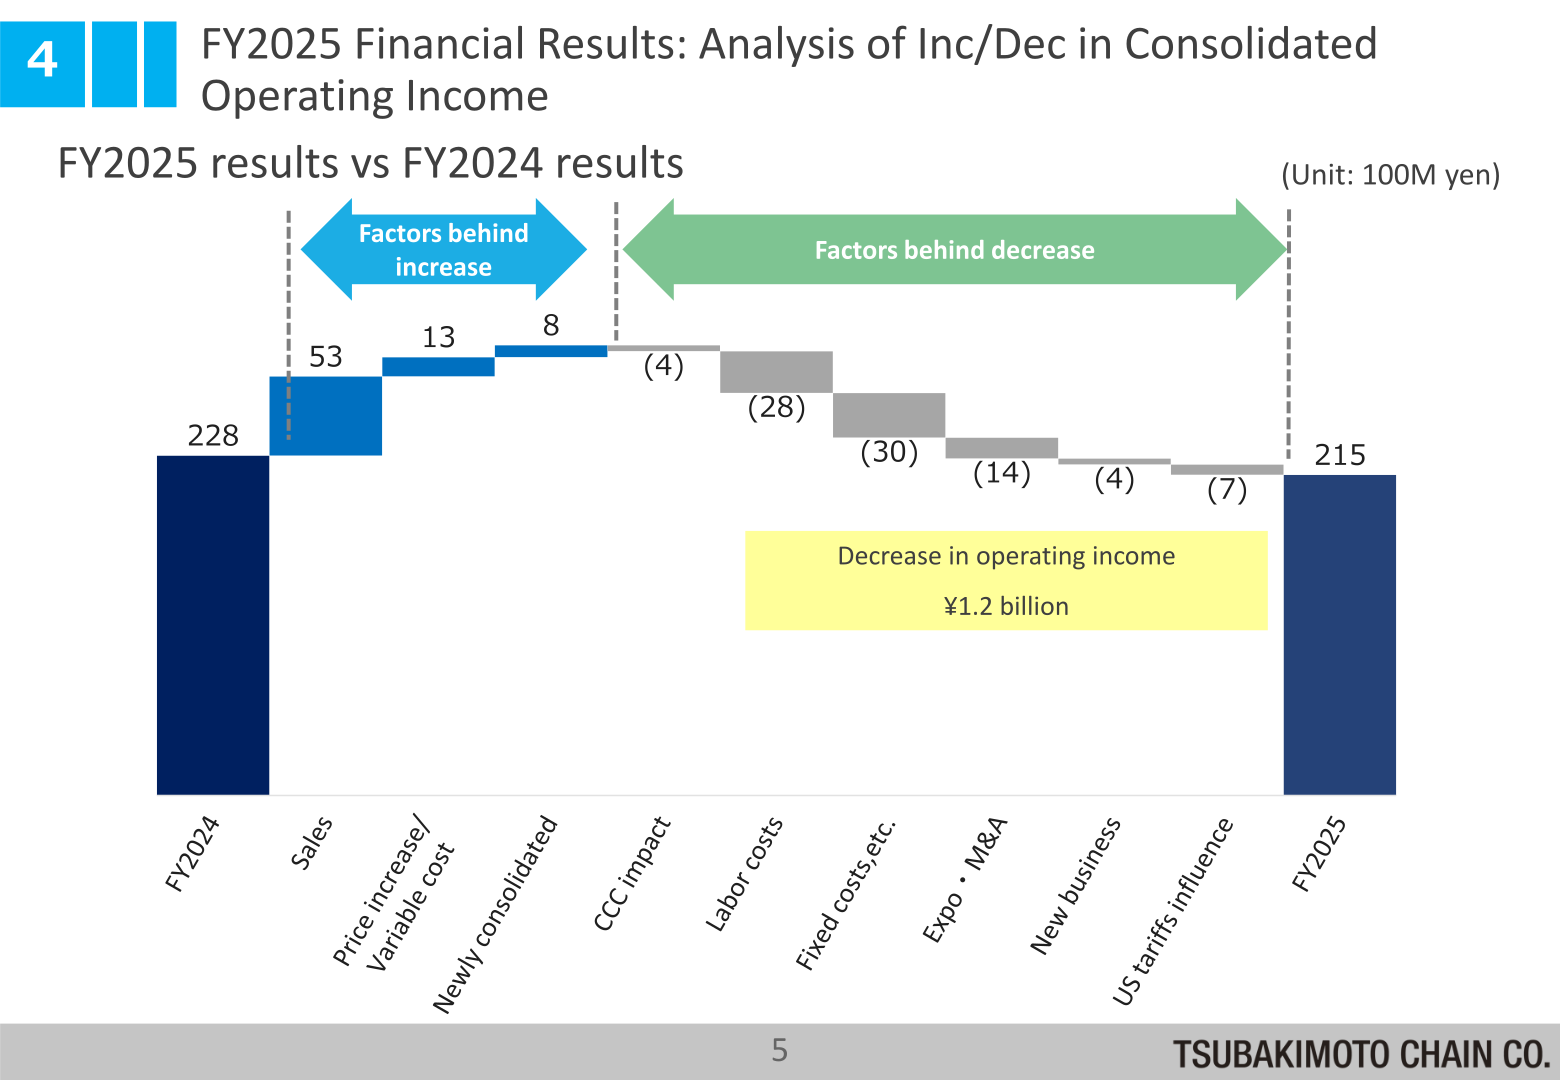
The company bridges operating income from 228 to 215 (unit: 100M yen), attributing the ¥1.2 billion decrease in operating income to cost factors that outweighed volume and price gains.
| Factor (Unit: 100M yen) | Amount |
|---|---|
| FY2024 | 228 |
| Sales | 53 |
| Price increase / Variable cost | 13 |
| Newly consolidated | 8 |
| CCC impact | (4) |
| Labor costs | (28) |
| Fixed costs, etc. | (30) |
| Expo・M&A | (14) |
| New business | (4) |
| US tariffs influence | (7) |
| FY2025 | 215 |
Segment Results
Sales increased across all businesses, while operating income increased in the Motion Control and Mobility businesses. In the Chain business, sales rose 5,519 million yen (+5.7%) driven by strong performance in the Americas, the consolidation of Daido Kogyo, and a European acquisition, but segment income fell 232 million yen (-1.5%) on lower sales in Germany and China. Motion Control sales rose 1,152 million yen (+4.9%) on recovery in Japan and sustained strong performance at ATR (manufacturing and sales of couplings) in North America, with segment income up 226 million yen (+29.4%) including price effects. Mobility sales rose 6,209 million yen (+6.8%) and segment income rose 1,749 million yen (+21.1%), mainly attributable to higher revenue in Japan. Materials Handling sales rose 2,456 million yen (+3.6%) on higher sales of systems for the logistics and construction machinery sectors in Japan plus newly consolidated subsidiaries, while segment income fell 284 million yen (-22.8%) reflecting weaker sales of systems for automotive manufacturing lines in the U.S.
| Segment (Yen, millions) | Sales FY2024 ACT | Sales FY2025 ACT | Sales YOY | Operating income FY2024 ACT | Operating income FY2025 ACT | Operating income YOY |
|---|---|---|---|---|---|---|
| Chain | 96,277 | 101,796 | + 5.7% | 15,585 | 15,353 | -1.5% |
| Motion Control | 23,387 | 24,539 | + 4.9% | 770 | 996 | + 29.4% |
| Mobility | 91,193 | 97,403 | + 6.8% | 8,287 | 10,036 | + 21.1% |
| Materials Handling | 68,313 | 70,770 | + 3.6% | 1,247 | 963 | -22.8% |
| Other*2 | 3,547 | 5,041 | + 42.1% | (833) | (1,180) | ― |
| Adjust | (3,525) | (3,672) | ― | (2,203) | (4,589) | ― |
| Total | 279,193 | 295,878 | + 6.0% | 22,854 | 21,578 | -5.6% |
Notes as printed in the materials: 1 Net sales include intersegment sales and transfers. 2 “Other” is not a reportable segment.
FY2026 Full Year Forecast
For FY2026 the company forecasts net sales of 350,000 million yen, up 18.3% year on year, and operating income of 25,500 million yen, up 18.2%. While potential cost increases due to geopolitical factors, including the situation in the Middle East, are conservatively factored in, the operating margin is expected to remain at a level comparable to the previous fiscal year at 7.3%. Ordinary income is forecast at 26,000 million yen (+4.8%) and net income at 22,000 million yen (-25.9%). Assumed rates are 148.00 yen to the U.S. dollar, 180.00 yen to the euro and 21.00 yen to the renminbi. On the summary forecast slide (P.11) the column headers are printed as “FY2024 ACT” and “FY2025”, while the slide is titled “FY2026 Full Year Forecast” and the leftmost column carries the same figures shown as FY2025 actuals on P.2; the segment forecast slide (P.12) labels the same columns “FY2025 Actual” and “FY2026 FCT.”
| Item (Yen, millions) | FY2025 Actual | FY2026 1H FCT | FY2026 2H FCT | FY2026 Full Year FCT | YoY |
|---|---|---|---|---|---|
| Net sales | 295,878 | 170,000 | 180,000 | 350,000 | + 18.3% |
| Operating income | 21,578 | 10,700 | 14,800 | 25,500 | + 18.2% |
| Operating margin (%) | 7.3% | 6.3% | 8.2% | 7.3% | ― |
| Ordinary income | 24,804 | 12,000 | 14,000 | 26,000 | + 4.8% |
| Net income | 29,708 | 10,000 | 12,000 | 22,000 | -25.9% |
| Exchange rates (USD) | 150.67 | 148.00 | ― | ||
| Exchange rates (EUR) | 174.64 | 180.00 | ― | ||
| Exchange rates (RMB) | 20.81 | 21.00 | ― |
By segment, following the consolidation of Daido Kogyo Co., Ltd. as a consolidated subsidiary effective January 1, 2026, sales are expected to increase across all businesses, with operating income also expected to increase in all segments except “Other.” The materials note that, with respect to sales and operating income of the Power Transmission business for FY2025, as the figures are currently under calculation, the Chain business and the Motion Control business are presented on a combined basis in the forecast table.
| Segment (Yen, millions) | Sales FY2025 Actual | Sales FY2026 Full year FCT | Sales YOY | Operating income FY2025 Actual | Operating income FY2026 Full year FCT | Operating income YOY |
|---|---|---|---|---|---|---|
| Power Transmission *2 | 126,336 | 141,500 | + 12.0% | 16,349 | 17,300 | + 5.8% |
| Mobility | 97,403 | 128,000 | + 31.4% | 10,036 | 11,800 | + 17.6% |
| Materials Handling | 70,770 | 72,000 | + 1.7% | 963 | 1,500 | + 55.7% |
| Other *3 | 5,041 | 13,000 | + 157.9% | (1,180) | (2,400) | ― |
| Adjust | (3,672) | (4,500) | ― | (4,589) | (2,700) | ― |
| All | 295,878 | 350,000 | + 18.3% | 21,578 | 25,500 | + 18.2% |
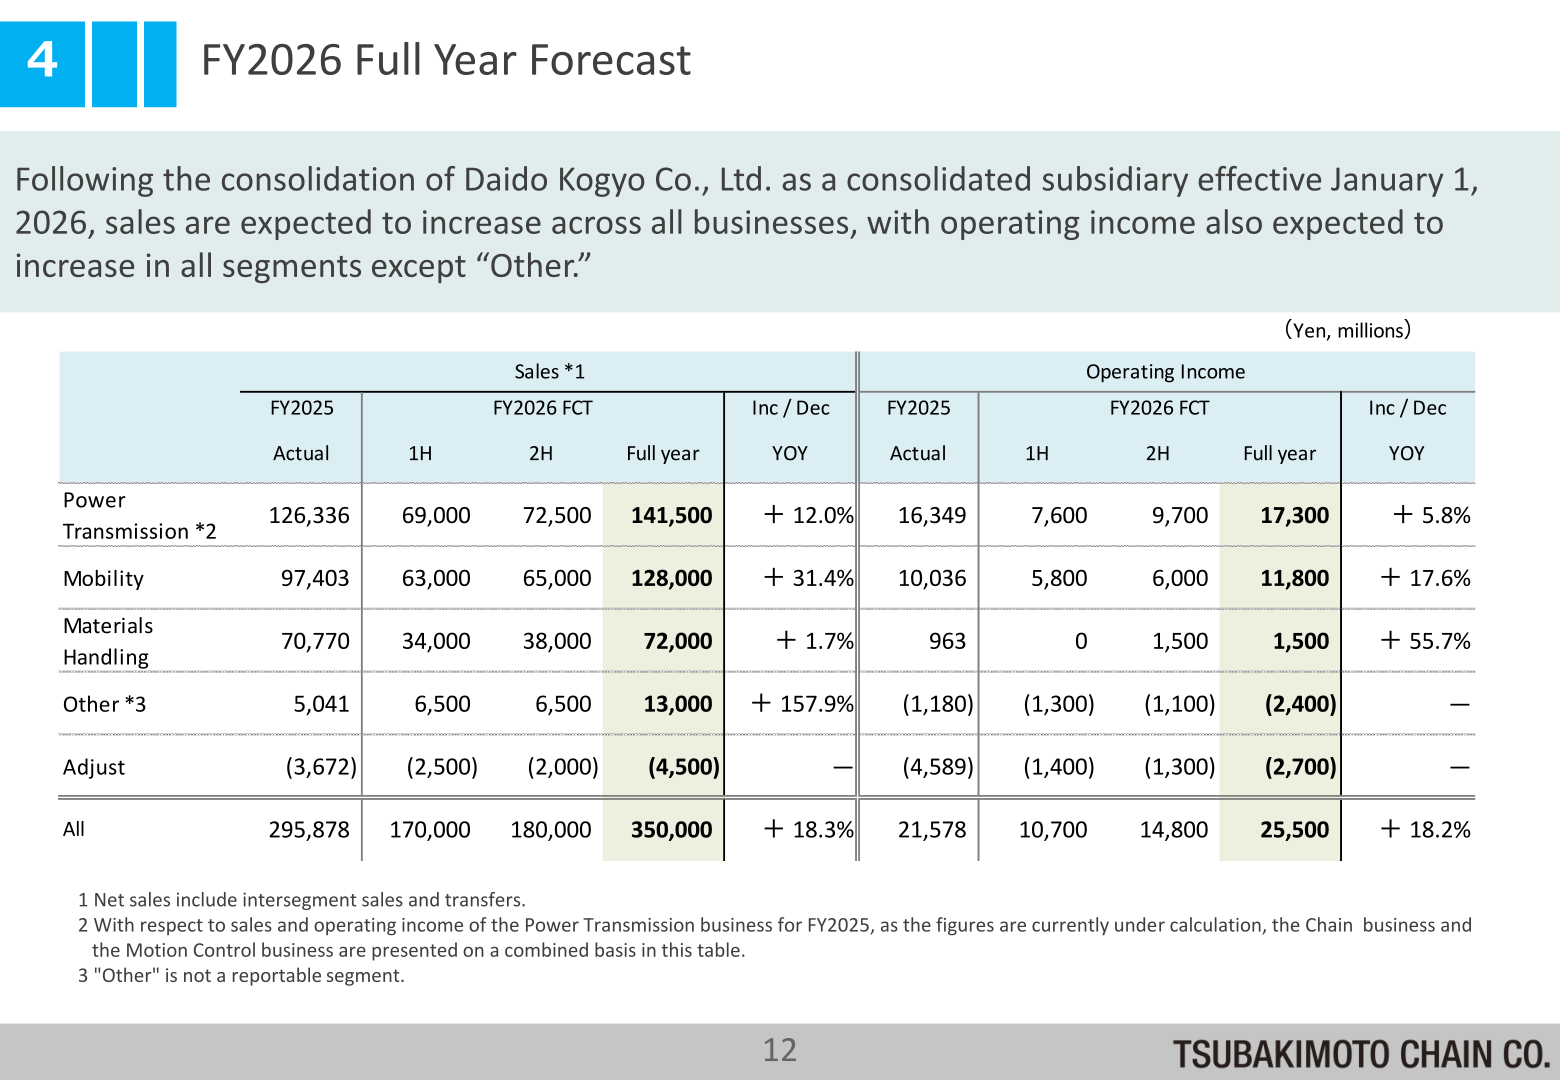
For Power Transmission, net sales are projected to increase, driven by solid demand in Japan and the Americas and the full consolidation of Daido Kogyo, and operating income is projected to increase, driven by revenue growth and the optimization of indirect costs following the integration of the Chain Business and Motion Control Business. For Mobility, net sales are projected to increase, notwithstanding uncertainties related to the situation in the Middle East, driven by the full consolidation of Daido Kogyo. For Materials Handling, net sales are projected to increase, driven by sustained strong sales of powder and bulk material handling systems in India and the full consolidation effect of Daido Kogyo, with operating income supported by improved profitability in the U.S. business (including lower amortization expenses).
Capital Expenditure Plan
The capital expenditure plan slide cites capital investment to strengthen growth potential, specifically investment in factory expansion to enhance production capacity and investment in automation and efficiency improvements of production operations. In units of 100 million yen, capital investment is shown as 169.6 in FY2025 and 275.5 in the FY2026 forecast, against depreciation of 144.8 and 182.2 respectively.
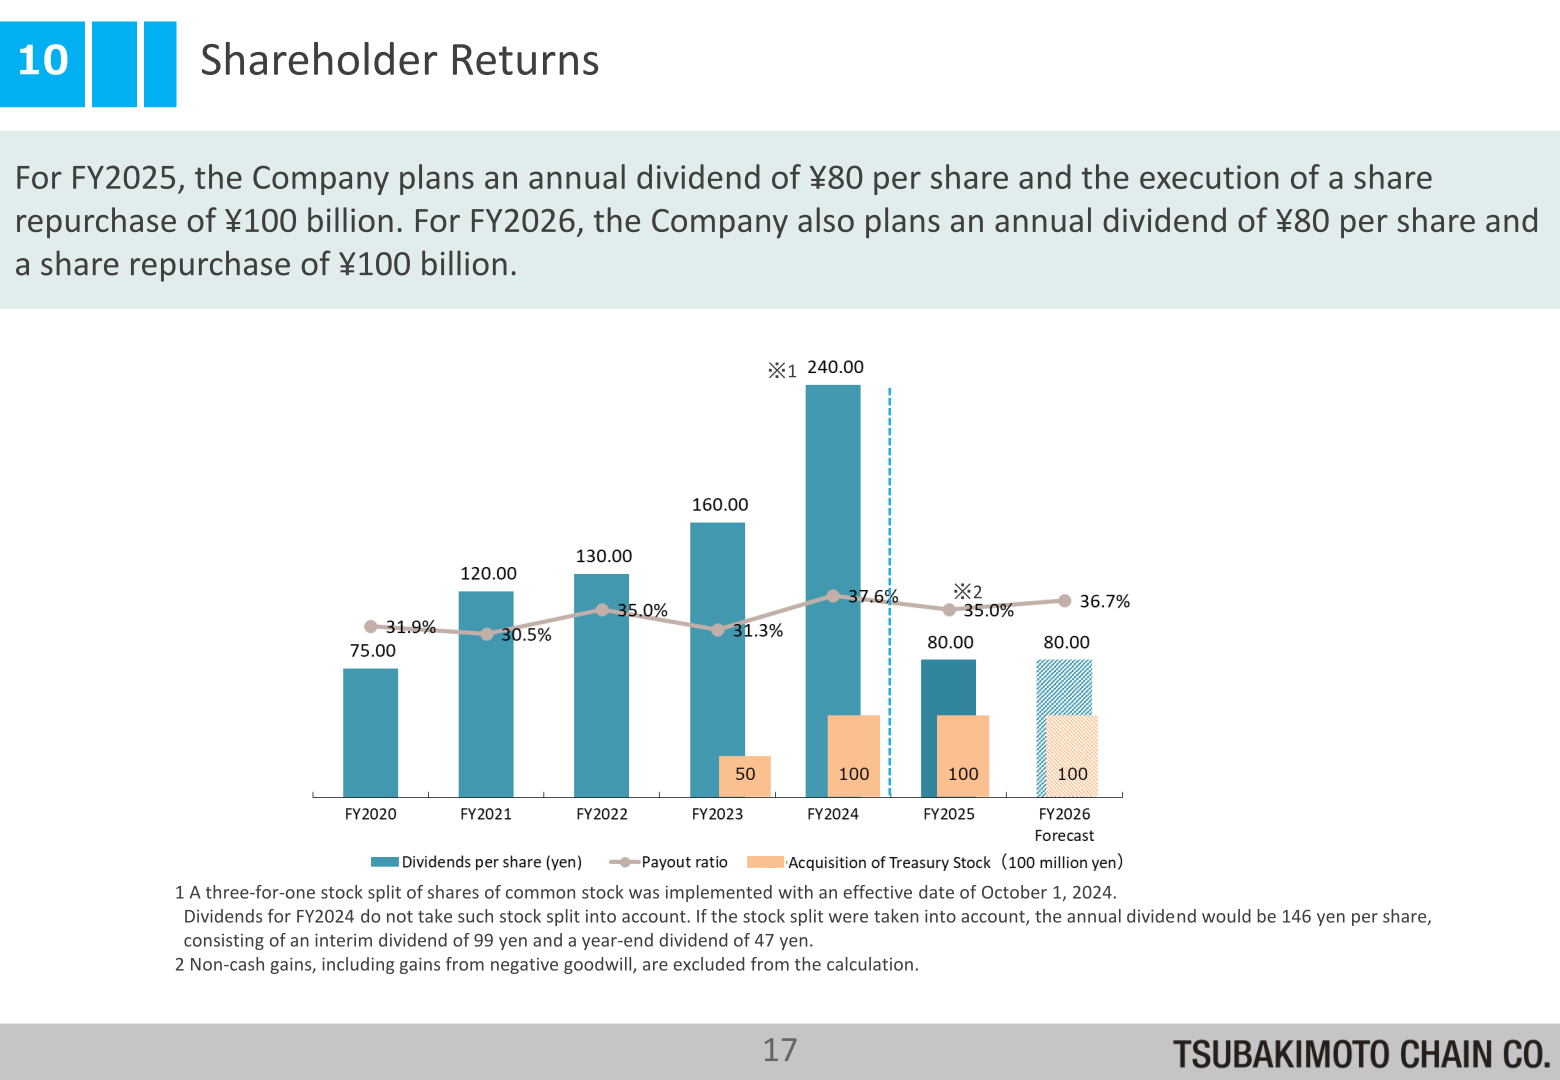
Shareholder Returns
The slide states: “For FY2025, the Company plans an annual dividend of ¥80 per share and the execution of a share repurchase of ¥100 billion. For FY2026, the Company also plans an annual dividend of ¥80 per share and a share repurchase of ¥100 billion.” The accompanying chart plots dividends per share of 80.00 yen for FY2025 and 80.00 yen for the FY2026 forecast, payout ratios of 35.0% and 36.7%, and acquisition of treasury stock of 100 for each of FY2024, FY2025 and the FY2026 forecast, on an axis labelled “Acquisition of Treasury Stock(100 million yen).” Dividends per share for the preceding years are shown as 75.00 (FY2020), 120.00 (FY2021), 130.00 (FY2022), 160.00 (FY2023) and 240.00 (FY2024).
Notes as printed in the materials: 1 A three-for-one stock split of shares of common stock was implemented with an effective date of October 1, 2024. Dividends for FY2024 do not take such stock split into account. If the stock split were taken into account, the annual dividend would be 146 yen per share, consisting of an interim dividend of 99 yen and a year-end dividend of 47 yen. 2 Non-cash gains, including gains from negative goodwill, are excluded from the calculation.
Topics: Business Integration with Daido Kogyo
The materials devote a dedicated section to the business integration with Daido Kogyo Co., Ltd. The stated purpose is to maximize corporate value and achieve a growth rate and profitability that would be difficult to realize independently. In Mobility Operations, Tsubaki and Daido’s motorcycle and automotive businesses are to be reorganized and resources at overseas locations utilized, in order to expand market share and sales and maximize profits for both companies in the mobility sector. Listed transformation challenges include accelerating growth by utilizing existing resources of both companies, minimizing investment, internalizing production through plastic forming and expanding sales by utilizing DID’s sales channels for motorcycles; improving profitability by establishing a cost management system, mutually complementing manufacturing capabilities, reducing costs through VA/VE and expanding sales in the two-wheel aftermarket; reorganizing GOP and BCP; and improving manufacturing reform and the workplace environment.
In Power Transmission Operations, the company aims to strengthen global competitiveness through integration of overlapping areas: integrating products and core technologies in overlapping and similar areas, optimizing production bases globally, expanding sales of highly competitive proprietary products (DID-brand sealed chains, etc.) and cross-selling through mutual sales channels. In New Business, the company plans to accelerate commercialization through collaboration and integration, combining the strengths of both companies in areas such as welfare, services and new mobility, citing Stairlift × Chainwaiter (CW, a wheelchair step lift) and UNI-ONE × bed transfer assist device as examples.
This article is an analysis based on publicly available information and is not a recommendation to buy or sell any specific securities. Investment decisions are your own responsibility.
![[Obayashi] Investors’ Guide 2026 — The Complete 24-Article Breakdown](https://japan-equity.com/wp-content/uploads/2026/07/hub_cover-1024x1024.png)
![[Obayashi] IR & SR Policy — Feeding Dialogue Back into Management](https://japan-equity.com/wp-content/uploads/2026/07/p32_sq-1024x1024.jpg)
![[Obayashi] Real Estate Development — 18.7% Margin, ¥287.7bn Unrealized Gains](https://japan-equity.com/wp-content/uploads/2026/07/p20_sq-1024x1024.jpg)
![[Obayashi] Domestic Civil Engineering — Resilience Spending Supports 9.6% Margin](https://japan-equity.com/wp-content/uploads/2026/07/p11_sq-1024x1024.jpg)
![[Obayashi] Share Price & External Ratings — vs TOPIX, ESG Index Inclusion](https://japan-equity.com/wp-content/uploads/2026/07/p40_sq-1024x1024.jpg)
![[Construction] ¥75.5tn Investment, Shrinking Workforce — Big-5 Market Share](https://japan-equity.com/wp-content/uploads/2026/07/p12_sq-1024x1024.jpg)



![[Obayashi] Capital Policy & Shareholder Returns — ROE 10%+, DOE ~5%, ¥100bn Buyback](https://japan-equity.com/wp-content/uploads/2026/07/p27_sq-1024x1024.jpg)
![[Obayashi] Reducing Cross-Shareholdings — ¥285.2bn Sold in Five Years](https://japan-equity.com/wp-content/uploads/2026/07/p29_sq-1024x1024.jpg)
![[Obayashi] ¥750bn Investment Plan — ¥300bn to Development, ¥190bn to Tech/DX](https://japan-equity.com/wp-content/uploads/2026/07/p30_sq-1024x1024.jpg)
![[Obayashi] MTP2022 KPIs — Operating Profit ~2x Target, ROE 14.4%](https://japan-equity.com/wp-content/uploads/2026/07/p25_sq-1024x1024.jpg)
![[Obayashi] Cash Allocation — ¥420bn Investment CF Over Five Years](https://japan-equity.com/wp-content/uploads/2026/07/p26_sq-1024x1024.jpg)
![[Obayashi] Green Energy — 44 Plants, 344MW, and the Green Hydrogen Challenge](https://japan-equity.com/wp-content/uploads/2026/07/p21_sq-1024x1024.jpg)
![[Obayashi] Tackling the Labor Shortage — Robotics Construction®](https://japan-equity.com/wp-content/uploads/2026/07/p14_sq-1024x1024.jpg)
