
This article is based on publicly available IR materials and is not a recommendation to buy or sell any specific securities.
Note: This article covers the fiscal year ended March 31, 2026, which this site classifies as FY2025; the company’s dividend chart labels the same year “FY2026.” Labels in the text, tables and segment data below follow the presentation.
Sakai Heavy Industries, LTD., the road construction machinery maker known for its rollers, reported consolidated net sales of ¥27,541 million for the fiscal year ended March 31, 2026, down 1.1% year on year, with operating profit of ¥1,588 million, up 0.3%. Profit attributable to owners of parent rose 22.8% to ¥1,763 million, helped by a gain on sale of investment securities of ¥940 million recorded as part of measures on the cross-shareholdings balance. The company describes the slowdown in sales over the past two fiscal years as having “finally bottomed out,” with domestic sales up 4.2% while North America and Asia declined.
Consolidated Results (Full-Year Actual)
Net sales declined ¥312 million YoY. Gross profit decreased by ¥86 million in line with the decrease in net sales, but the cost-of-sales ratio improved by 0.4% and gross profit increased by ¥96 million; SG&A expenses rose ¥6 million as a result of a rise in wages, an increase in exhibition costs and a decrease in other expenses. As a result, operating profit increased by ¥4 million YoY to ¥1,588 million and the operating profit margin increased 0.1 percentage points YoY to 5.8%.
| Item (Millions of yen) | Fiscal year ended March 31, 2025 | Fiscal year ended March 31, 2026 | YoY change (Amount) | YoY change (%) |
|---|---|---|---|---|
| Net sales | 27,854 | 27,541 | ▲ 312 | ▲1.1% |
| Japan | 12,000 | 12,505 | 505 | 4.2% |
| Overseas | 15,853 | 15,035 | ▲ 817 | ▲5.2% |
| Operating profit | 1,583 | 1,588 | 4 | 0.3% |
| Operating profit ratio | (5.7%) | (5.8%) | — | — |
| Ordinary profit | 1,494 | 1,581 | 87 | 5.8% |
| Profit attributable to owners of parent | 1,435 | 1,763 | 327 | 22.8% |
| Cost-of-sales ratio | (72.4%) | (72.1%) | — | — |
Sales by Region in Which Customers Are Located
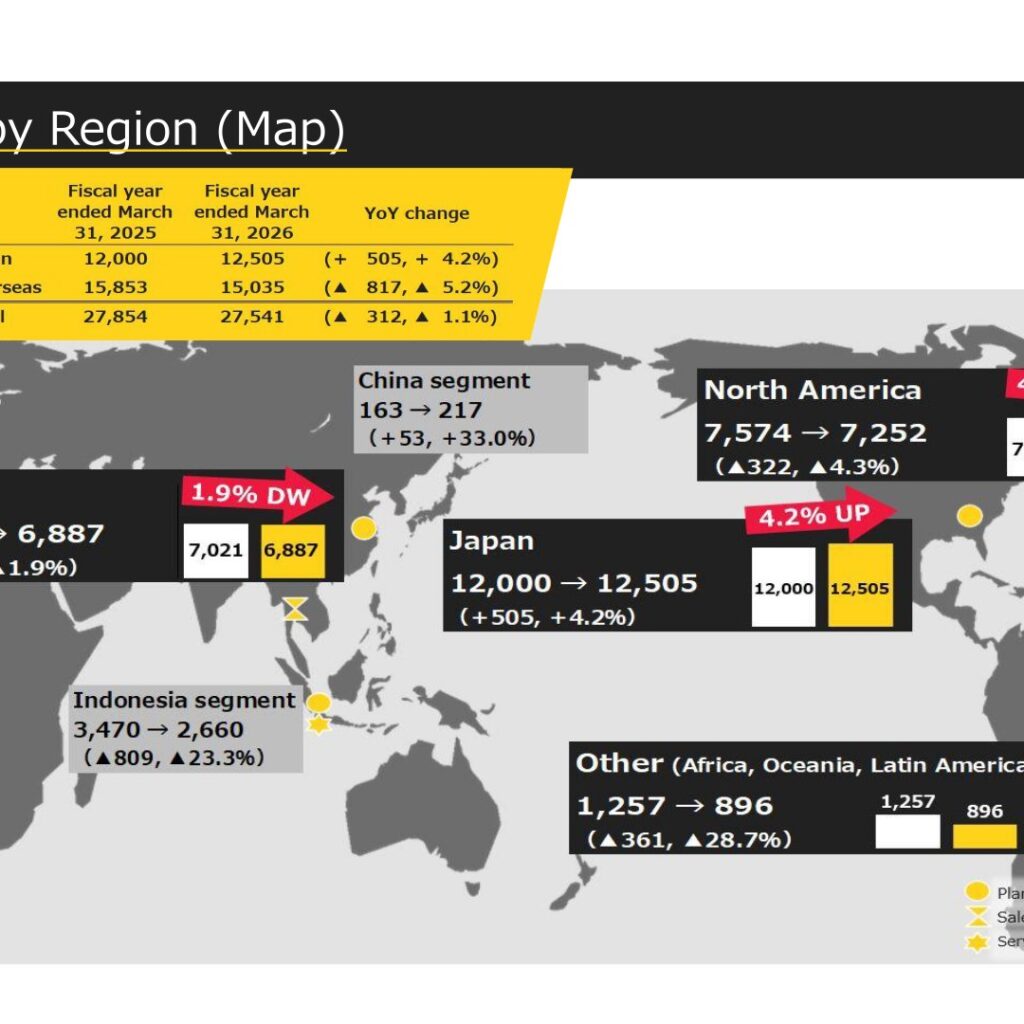
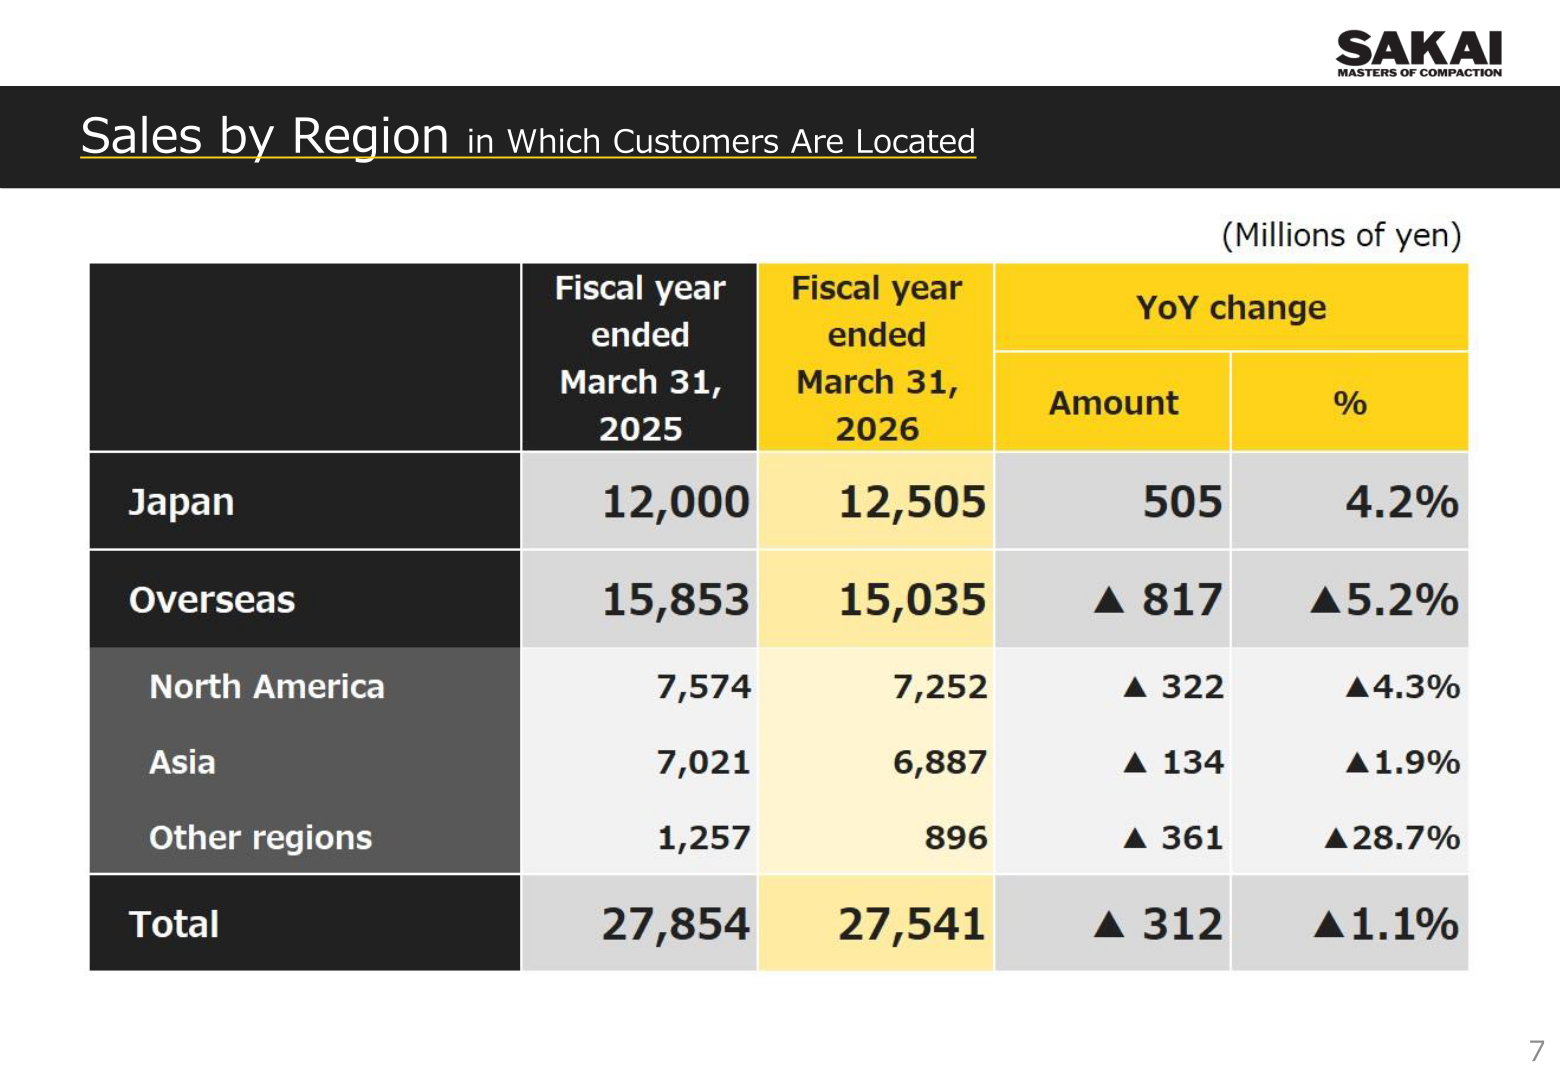
Sales in Japan rose 4.2% to ¥12,505 million as the slowdown in line with adjustments to distribution inventory bottomed out amid strong government construction investment against the backdrop of measures to accelerate national land resilience. Sales in North America fell 4.3% to ¥7,252 million, where the slowdown from distribution inventory adjustments and high-tariff policies started to bottom out amid ongoing investment in high levels of road construction and AI-related construction against the backdrop of the Infrastructure Investment and Jobs Act. Sales in Asia declined 1.9% to ¥6,887 million: sales remained sluggish in Indonesia, while sales increased in Vietnam, the Philippines and Laos, etc.
| Region (Millions of yen) | Fiscal year ended March 31, 2025 | Fiscal year ended March 31, 2026 | YoY change (Amount) | YoY change (%) |
|---|---|---|---|---|
| Japan | 12,000 | 12,505 | 505 | 4.2% |
| Overseas | 15,853 | 15,035 | ▲ 817 | ▲5.2% |
| North America | 7,574 | 7,252 | ▲ 322 | ▲4.3% |
| Asia | 7,021 | 6,887 | ▲ 134 | ▲1.9% |
| Other regions | 1,257 | 896 | ▲ 361 | ▲28.7% |
| Total | 27,854 | 27,541 | ▲ 312 | ▲1.1% |
Segment Results
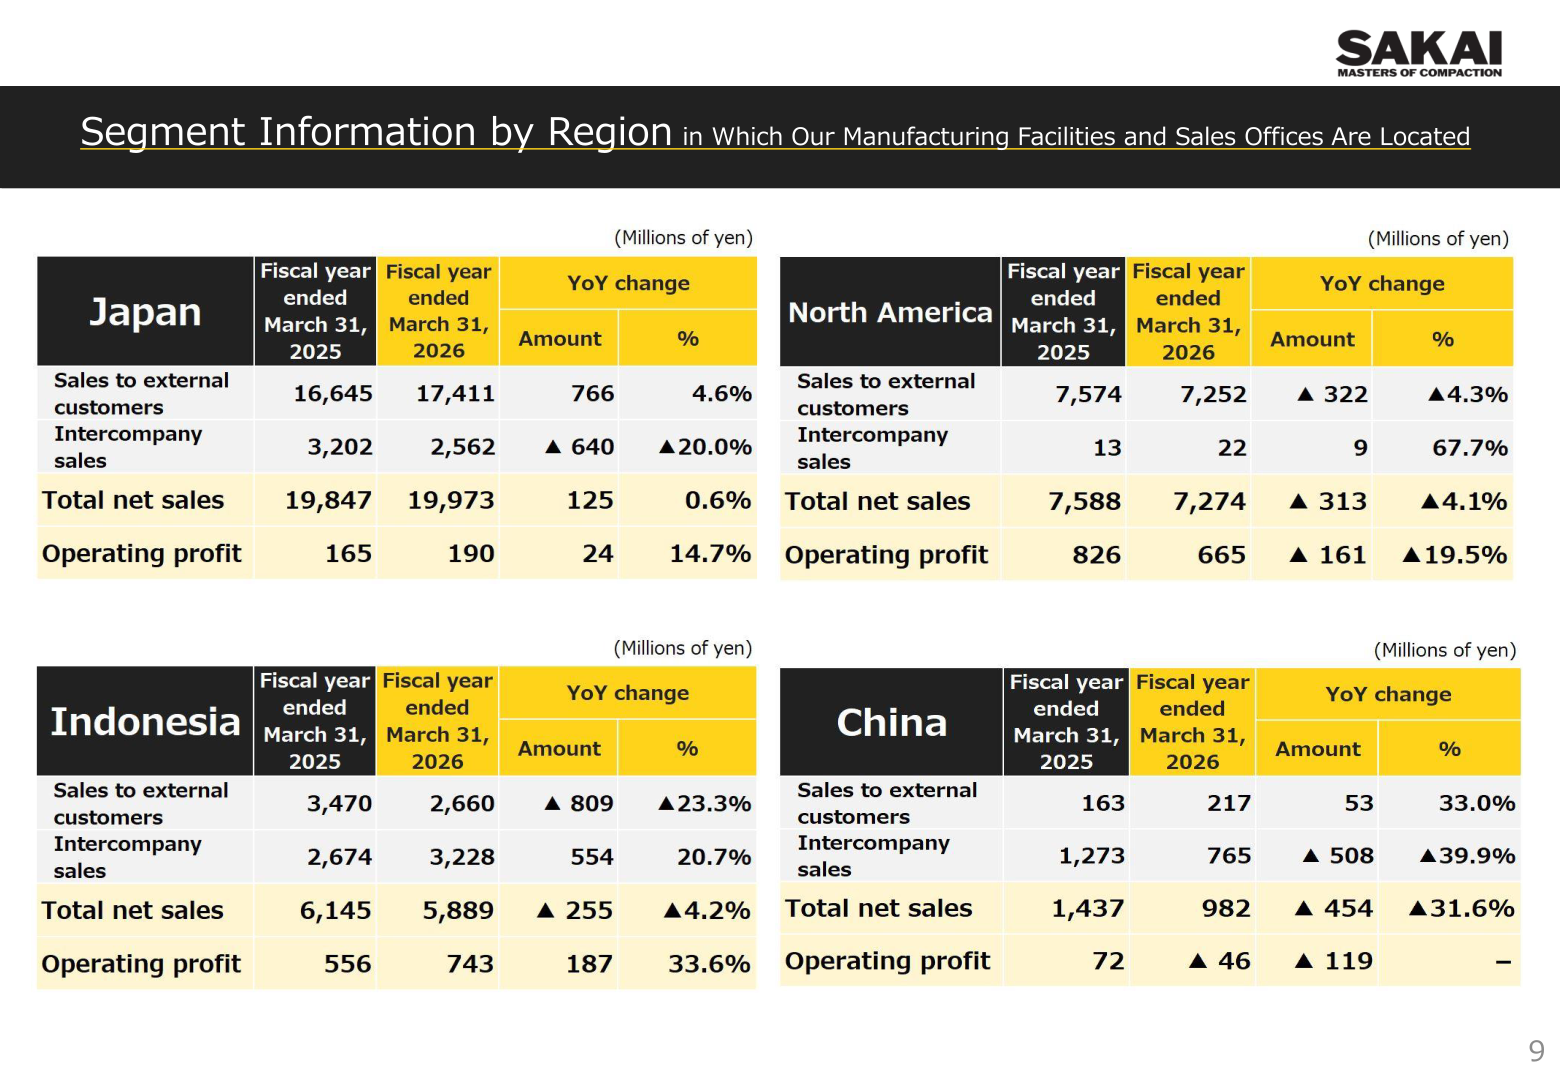
By reportable segment, defined by the region in which the Group’s manufacturing facilities and sales offices are located, Japan posted total net sales of ¥19,973 million (up 0.6%) and operating profit of ¥190 million (up 14.7%). North America recorded total net sales of ¥7,274 million (down 4.1%) and operating profit of ¥665 million (down 19.5%). Indonesia’s total net sales were ¥5,889 million (down 4.2%) while operating profit rose 33.6% to ¥743 million. China’s total net sales fell 31.6% to ¥982 million and the segment swung to an operating loss of ¥46 million from a profit of ¥72 million.
| Segment (Millions of yen) | Item | Fiscal year ended March 31, 2025 | Fiscal year ended March 31, 2026 | YoY change (%) |
|---|---|---|---|---|
| Japan | Sales to external customers | 16,645 | 17,411 | 4.6% |
| Japan | Intercompany sales | 3,202 | 2,562 | ▲20.0% |
| Japan | Total net sales | 19,847 | 19,973 | 0.6% |
| Japan | Operating profit | 165 | 190 | 14.7% |
| North America | Sales to external customers | 7,574 | 7,252 | ▲4.3% |
| North America | Intercompany sales | 13 | 22 | 67.7% |
| North America | Total net sales | 7,588 | 7,274 | ▲4.1% |
| North America | Operating profit | 826 | 665 | ▲19.5% |
| Indonesia | Sales to external customers | 3,470 | 2,660 | ▲23.3% |
| Indonesia | Intercompany sales | 2,674 | 3,228 | 20.7% |
| Indonesia | Total net sales | 6,145 | 5,889 | ▲4.2% |
| Indonesia | Operating profit | 556 | 743 | 33.6% |
| China | Sales to external customers | 163 | 217 | 33.0% |
| China | Intercompany sales | 1,273 | 765 | ▲39.9% |
| China | Total net sales | 1,437 | 982 | ▲31.6% |
| China | Operating profit | 72 | ▲ 46 | — |
Forecast for the Fiscal Year Ending March 31, 2027
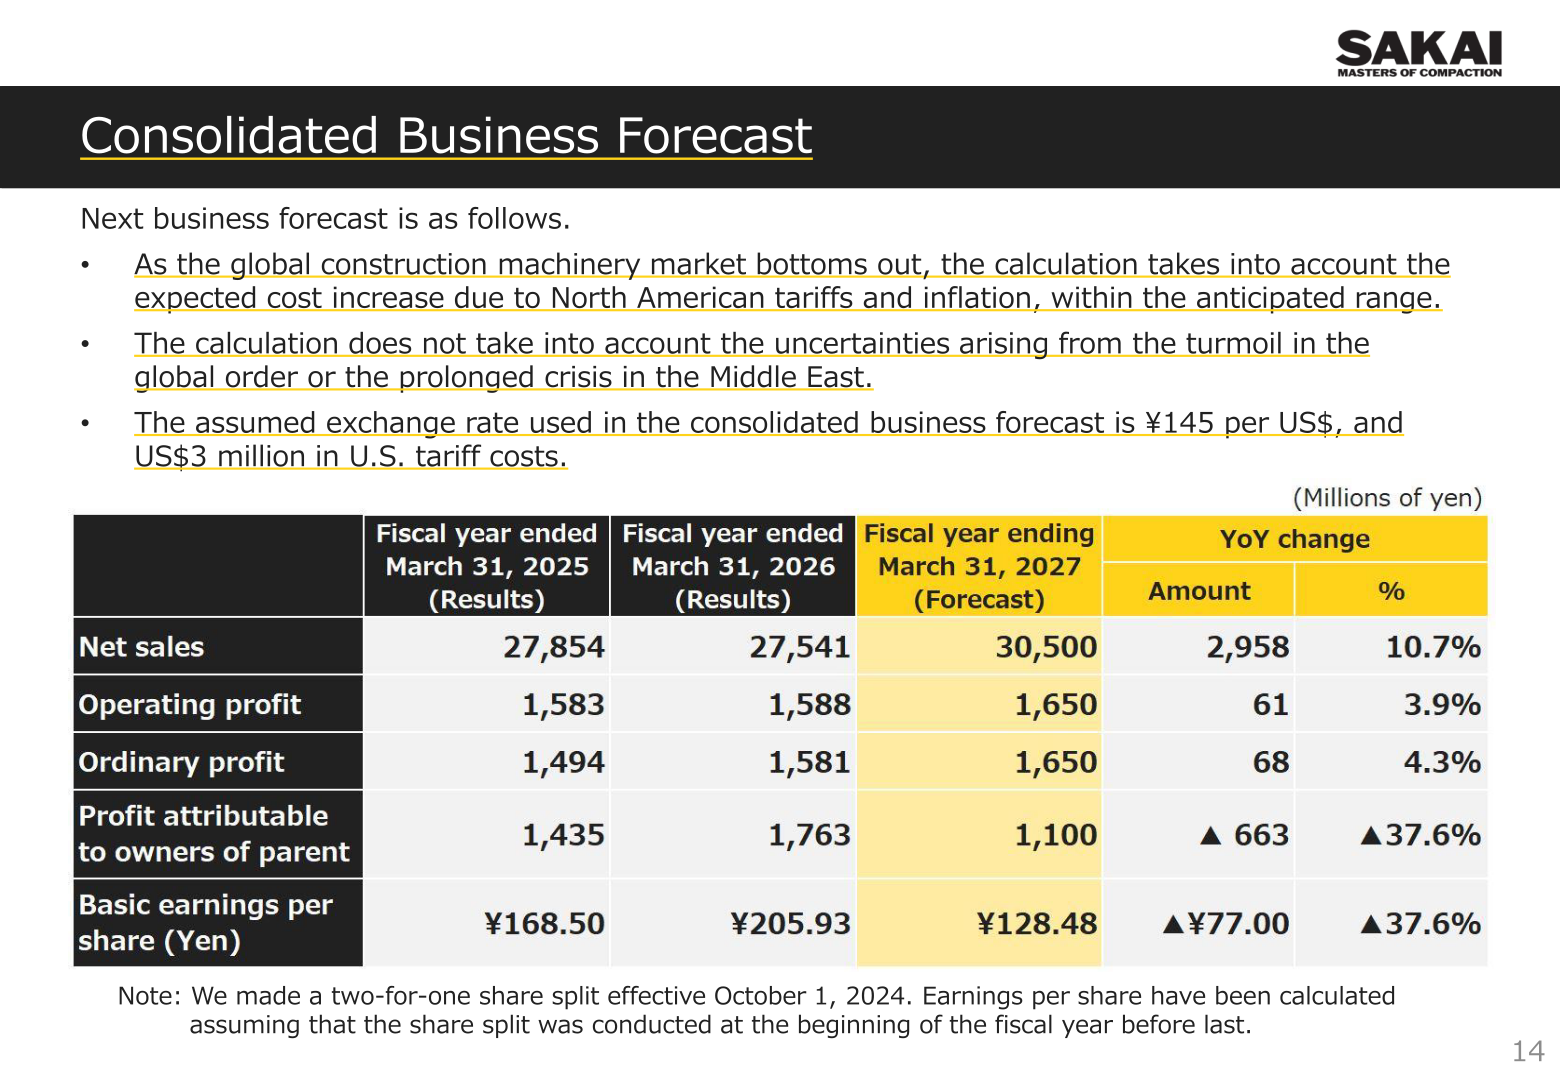
For the fiscal year ending March 31, 2027 the company forecasts net sales of ¥30,500 million (up 10.7%), operating profit of ¥1,650 million (up 3.9%), ordinary profit of ¥1,650 million (up 4.3%) and profit attributable to owners of parent of ¥1,100 million (down 37.6%), with basic earnings per share of ¥128.48. The company states that, as the global construction machinery market bottoms out, the calculation takes into account the expected cost increase due to North American tariffs and inflation within the anticipated range, and does not take into account the uncertainties arising from the turmoil in the global order or the prolonged crisis in the Middle East. The assumed exchange rate used in the consolidated business forecast is ¥145 per US$, and US$3 million in U.S. tariff costs.
| Item (Millions of yen) | Fiscal year ended March 31, 2025 (Results) | Fiscal year ended March 31, 2026 (Results) | Fiscal year ending March 31, 2027 (Forecast) | YoY change (%) |
|---|---|---|---|---|
| Net sales | 27,854 | 27,541 | 30,500 | 10.7% |
| Operating profit | 1,583 | 1,588 | 1,650 | 3.9% |
| Ordinary profit | 1,494 | 1,581 | 1,650 | 4.3% |
| Profit attributable to owners of parent | 1,435 | 1,763 | 1,100 | ▲37.6% |
| Basic earnings per share (Yen) | ¥168.50 | ¥205.93 | ¥128.48 | ▲37.6% |
Shareholder Returns
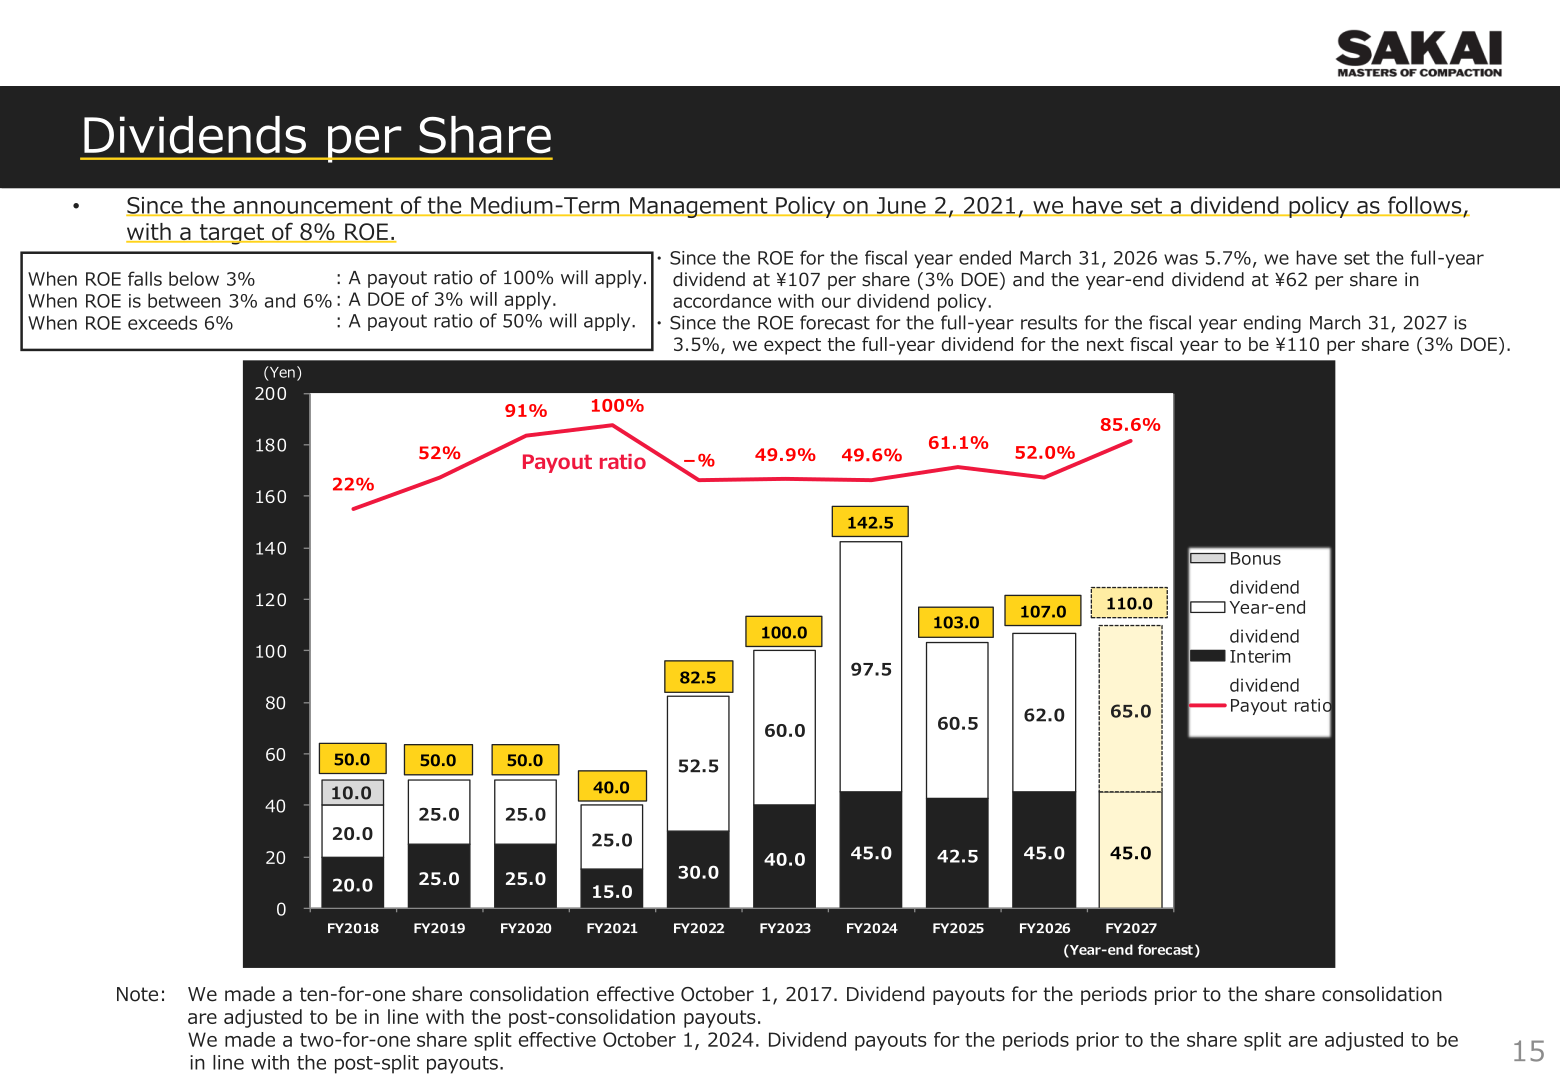
Since the announcement of the Medium-Term Management Policy on June 2, 2021, the company has set a dividend policy with a target of 8% ROE: a payout ratio of 100% applies when ROE falls below 3%, a DOE of 3% applies when ROE is between 3% and 6%, and a payout ratio of 50% applies when ROE exceeds 6%. Since ROE for the fiscal year ended March 31, 2026 was 5.7%, the full-year dividend was set at ¥107 per share (3% DOE), with the year-end dividend at ¥62 per share; the payout ratio for the year is shown as 52.0%. Since the ROE forecast for the fiscal year ending March 31, 2027 is 3.5%, the company expects the full-year dividend for the next fiscal year to be ¥110 per share (3% DOE), of which the year-end dividend is forecast at ¥65.0. Dividend payouts have been adjusted for the ten-for-one share consolidation effective October 1, 2017 and the two-for-one share split effective October 1, 2024.
Medium-Term Management Policy and Topics
The fiscal year under review was the fifth and final year of the five-year medium-term management policy, whose KPIs were net sales of ¥30,000 million, operating profit of ¥3,100 million and ROE of 8.0%. In the third fiscal year the company achieved those KPIs, with net sales of ¥33.0 billion, operating profit of ¥3.3 billion and a ROE of 9%. Starting in the fourth fiscal year the construction machinery market entered a downturn cycle, and the final year closed with net sales increased by 27% from the zeroth fiscal year to ¥27.5 billion, operating profit increased 2.3 times from the zeroth fiscal year to ¥1.59 billion, and ROE of 5.7%. The KPI for share buybacks of ¥0.5 billion to ¥2.0 billion resulted in ¥0.34 billion, with the company refraining from additional purchases because the improvements in capital efficiency and share price were minimal. The next medium-term management policy is planned to be announced in late July of this year.
On capital efficiency, the presentation shows the share price at ¥2,035 and PBR at 0.55 times for the current (fifth) fiscal year, against a medium-term KPI of PBR of 1.0 times. Other initiatives cited include profit structure reform through sales price revisions, high added value and efficiency (cost-of-sales ratio of 72.1% versus 72.4% a year earlier); increased investment in human capital, including wage rises of 6.0% in the fiscal year ended March 31, 2026 and a planned 5.0% in the fiscal year ending March 31, 2027; dealing with volatile demand, with inventory turnover of 2.51 times, up 0.10 times (¥11.5 billion to ¥10.9 billion); and responses to North American tariffs through price revisions and supply chain streamlining. Net working capital increased by ¥1,916 million YoY (up 13.6%) to ¥16,054 million, as trade payables decreased by ¥912 million (down 26.2%) to ¥2,563 million following application of the 60-day payment rule under the Proper Transactions Act, while inventories decreased by ¥565 million (down 4.9%) to ¥10,972 million. On ESG, the cross-shareholdings balance stood at ¥6,051 million as of March 31, 2026, equal to 19.1% of consolidated net assets of ¥31,677 million, back below the company’s stated 20% policy threshold, and in April 2026 its electric walk-behind rollers became the first roller to receive “GX Construction Machinery” certification.
This article is an analysis based on publicly available information and is not a recommendation to buy or sell any specific securities. Investment decisions are your own responsibility.
![[Obayashi] Investors’ Guide 2026 — The Complete 24-Article Breakdown](https://japan-equity.com/wp-content/uploads/2026/07/hub_cover-1024x1024.png)
![[Obayashi] IR & SR Policy — Feeding Dialogue Back into Management](https://japan-equity.com/wp-content/uploads/2026/07/p32_sq-1024x1024.jpg)
![[Obayashi] Real Estate Development — 18.7% Margin, ¥287.7bn Unrealized Gains](https://japan-equity.com/wp-content/uploads/2026/07/p20_sq-1024x1024.jpg)
![[Obayashi] Domestic Civil Engineering — Resilience Spending Supports 9.6% Margin](https://japan-equity.com/wp-content/uploads/2026/07/p11_sq-1024x1024.jpg)
![[Obayashi] Share Price & External Ratings — vs TOPIX, ESG Index Inclusion](https://japan-equity.com/wp-content/uploads/2026/07/p40_sq-1024x1024.jpg)
![[Construction] ¥75.5tn Investment, Shrinking Workforce — Big-5 Market Share](https://japan-equity.com/wp-content/uploads/2026/07/p12_sq-1024x1024.jpg)



![[Obayashi] Capital Policy & Shareholder Returns — ROE 10%+, DOE ~5%, ¥100bn Buyback](https://japan-equity.com/wp-content/uploads/2026/07/p27_sq-1024x1024.jpg)
![[Obayashi] Reducing Cross-Shareholdings — ¥285.2bn Sold in Five Years](https://japan-equity.com/wp-content/uploads/2026/07/p29_sq-1024x1024.jpg)
![[Obayashi] ¥750bn Investment Plan — ¥300bn to Development, ¥190bn to Tech/DX](https://japan-equity.com/wp-content/uploads/2026/07/p30_sq-1024x1024.jpg)
![[Obayashi] MTP2022 KPIs — Operating Profit ~2x Target, ROE 14.4%](https://japan-equity.com/wp-content/uploads/2026/07/p25_sq-1024x1024.jpg)
![[Obayashi] Cash Allocation — ¥420bn Investment CF Over Five Years](https://japan-equity.com/wp-content/uploads/2026/07/p26_sq-1024x1024.jpg)
![[Obayashi] Green Energy — 44 Plants, 344MW, and the Green Hydrogen Challenge](https://japan-equity.com/wp-content/uploads/2026/07/p21_sq-1024x1024.jpg)
![[Obayashi] Tackling the Labor Shortage — Robotics Construction®](https://japan-equity.com/wp-content/uploads/2026/07/p14_sq-1024x1024.jpg)
