
This article is based on publicly available IR materials and is not a recommendation to buy or sell any specific securities.
Toyo Engineering Corporation reported net sales of ¥182.9 billion and a net loss attributable to owners of parent of ¥14.9 billion for FY2025 (the fiscal year ended March 2026), in line with the forecast announced at the Q3 financial results briefing on February 12. Losses were recognized mainly due to margin deterioration in certain projects, including the Brazil power project. Order intake including equity-method affiliates reached ¥420.4 billion, exceeding the full-year forecast. For FY2026 the company plans a return to profitability with net sales of ¥190.0 billion and net profit attributable to owners of parent of ¥6.0 billion, and expects to resume dividends with ¥25 per share.
Consolidated Results (Full-Year Actual)
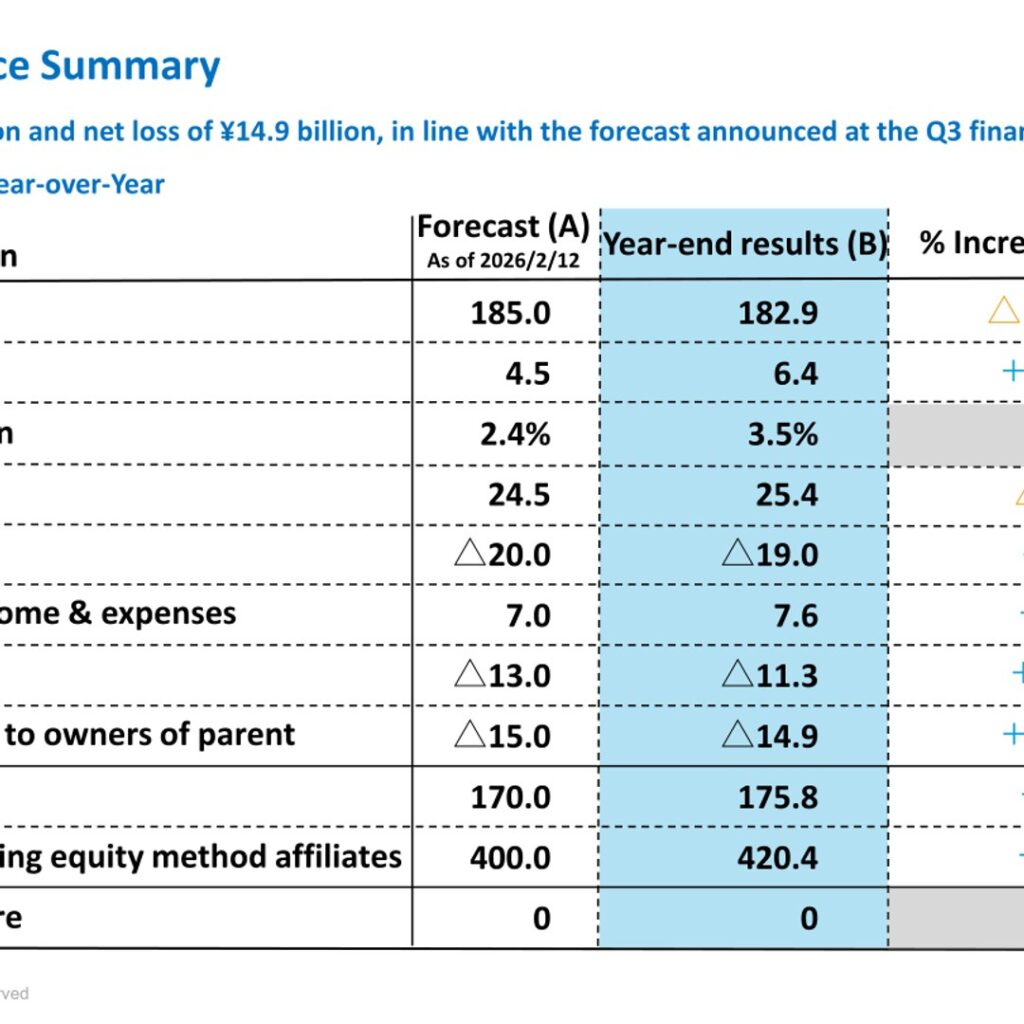
Net sales came to ¥182.9 billion with gross profit of ¥6.4 billion and a gross profit margin of 3.5%. SG&A expenses were ¥25.4 billion, producing an operating loss of ¥19.0 billion and an ordinary loss of ¥11.3 billion after non-operating income and expenses of ¥7.6 billion. Net loss attributable to owners of parent was ¥14.9 billion. Against the forecast announced as of February 12, 2026, net sales came in ¥2.1 billion lower while every profit line finished ahead of plan. New orders were ¥175.8 billion, and new orders including equity-method affiliates were ¥420.4 billion, versus a forecast of ¥400.0 billion.
| Unit: Billions of yen | Forecast (A) as of 2026/2/12 | Year-end results (B) | Diff.(B-A) |
|---|---|---|---|
| Net sales | 185.0 | 182.9 | △2.1 |
| Gross profit | 4.5 | 6.4 | +1.9 |
| Gross profit margin | 2.4% | 3.5% | +1.1pp |
| SG&A expenses | 24.5 | 25.4 | △0.9 |
| Operating income | △20.0 | △19.0 | +1.0 |
| Non-operating income & expenses | 7.0 | 7.6 | +0.6 |
| Ordinary income | △13.0 | △11.3 | +1.7 |
| Profit attributable to owners of parent | △15.0 | △14.9 | +0.1 |
| New orders | 170.0 | 175.8 | +5.8 |
| New orders including equity method affiliates | 400.0 | 420.4 | +20.4 |
| Dividends per share | 0 | 0 | – |
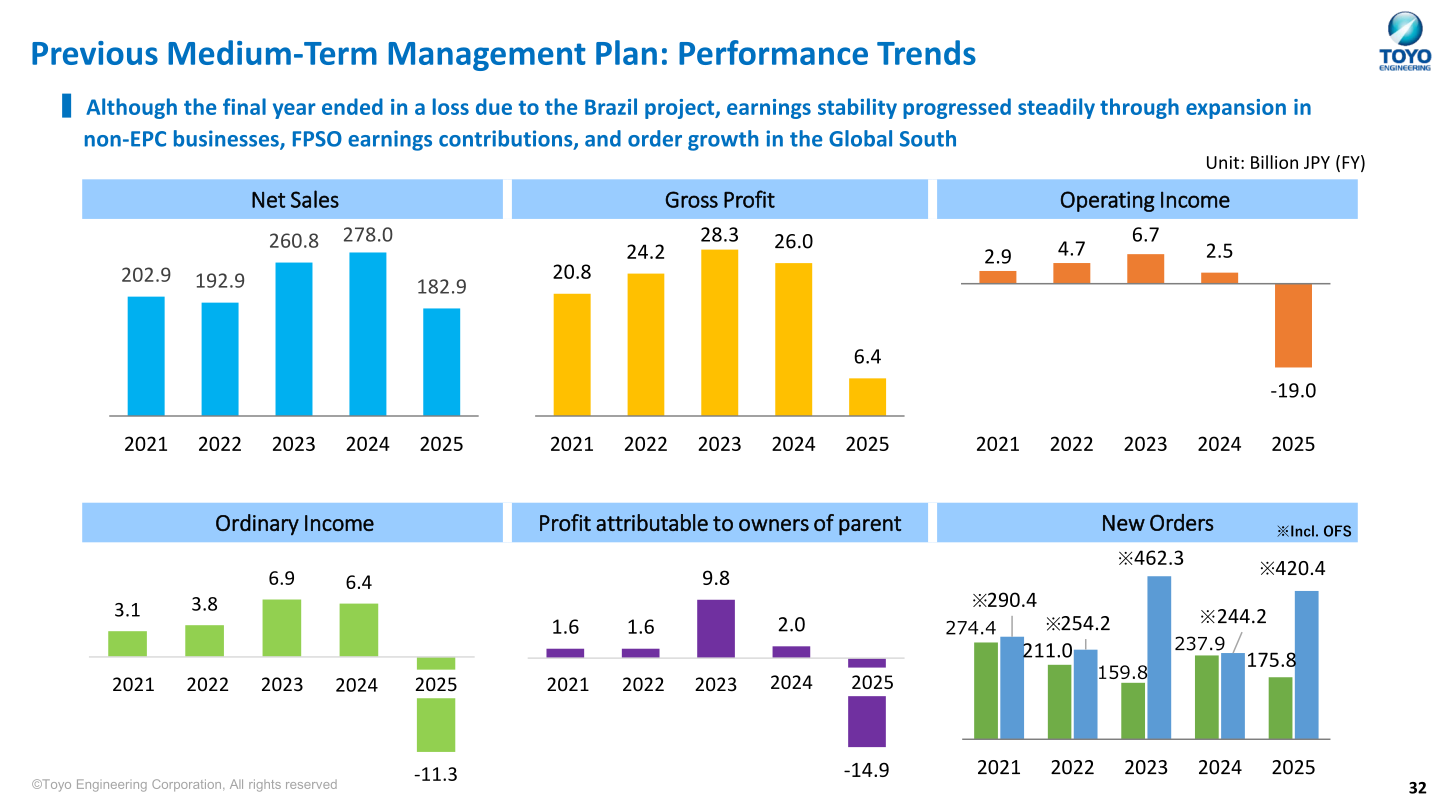
On a year-over-year basis, revenue and profit both declined due to the impact of unprofitable projects. Order intake including equity-method affiliates, however, rose sharply, driven by projects in Japan (high-performance chemicals), India (petrochemicals), Turkmenistan (petrochemical revamp), and two FPSO projects through Offshore Frontier Solutions (OFS), an equity-method affiliate.
| Unit: Billion JPY (FY) | FY2024 | FY2025 |
|---|---|---|
| Net sales | 278.0 | 182.9 |
| Gross profit | 26.0 | 6.4 |
| Operating income | 2.5 | -19.0 |
| Ordinary income | 6.4 | -11.3 |
| Profit attributable to owners of parent | 2.0 | -14.9 |
| New orders | 237.9 | 175.8 |
| New orders (incl. OFS) | 244.2 | 420.4 |
Net Sales by Region and Product
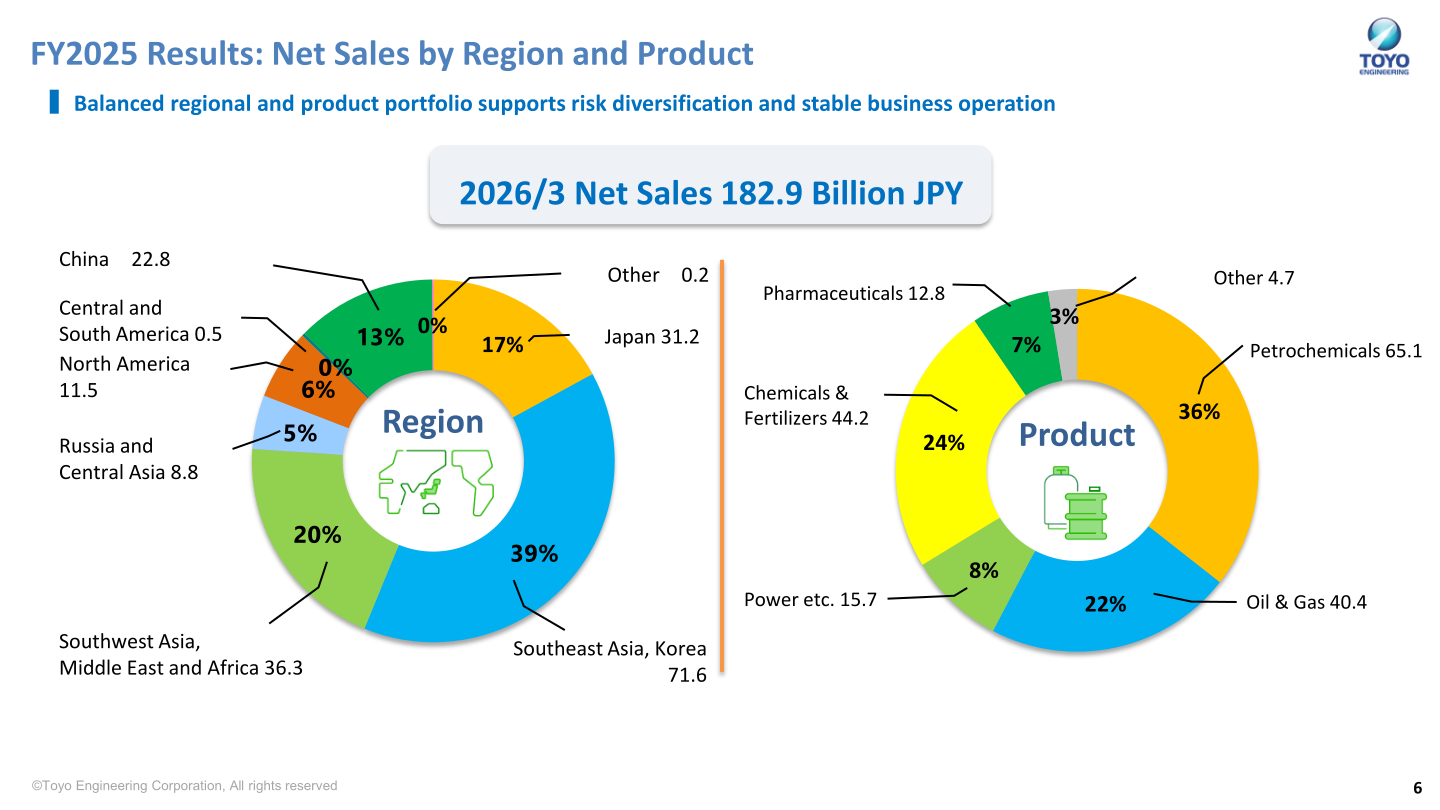
The company describes its regional and product portfolio as balanced, supporting risk diversification and stable business operation. Of the ¥182.9 billion of net sales for the year ended March 2026, Southeast Asia and Korea accounted for 39% and petrochemicals for 36%.
| Region | Net sales (Billion JPY) | Share |
|---|---|---|
| Japan | 31.2 | 17% |
| Southeast Asia, Korea | 71.6 | 39% |
| Southwest Asia, Middle East and Africa | 36.3 | 20% |
| Russia and Central Asia | 8.8 | 5% |
| China | 22.8 | 13% |
| North America | 11.5 | 6% |
| Central and South America | 0.5 | 0% |
| Other | 0.2 | 0% |
| Product | Net sales (Billion JPY) | Share |
|---|---|---|
| Petrochemicals | 65.1 | 36% |
| Oil & Gas | 40.4 | 22% |
| Chemicals & Fertilizers | 44.2 | 24% |
| Power etc. | 15.7 | 8% |
| Pharmaceuticals | 12.8 | 7% |
| Other | 4.7 | 3% |
FY2026 Forecast
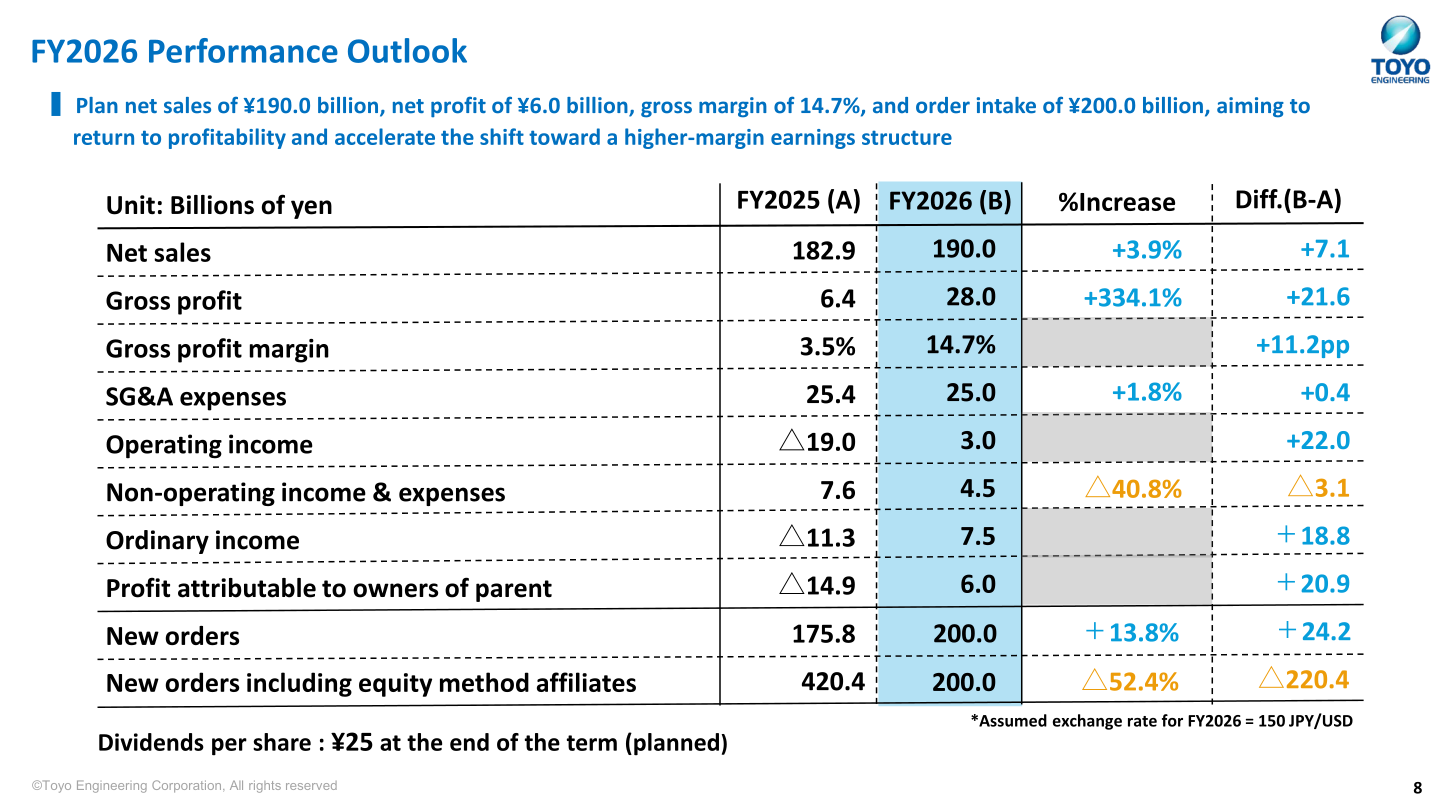
For FY2026 the company plans net sales of ¥190.0 billion, gross profit of ¥28.0 billion and a gross profit margin of 14.7%, a significant improvement from 3.5% in the previous year. Operating income is planned at ¥3.0 billion and ordinary income at ¥7.5 billion, supported by equity-method income from OFS as FPSO projects progress steadily, with net profit attributable to owners of parent of ¥6.0 billion. Order intake is planned at ¥200.0 billion, focusing on growth markets such as India, Africa and Central Asia, and expanding orders across high-margin fertilizer licensing, O&M and other new fields, GX, geothermal, and conventional energy projects. The assumed exchange rate for FY2026 is 150 JPY/USD.
| Unit: Billions of yen | FY2025 (A) | FY2026 (B) | %Increase | Diff.(B-A) |
|---|---|---|---|---|
| Net sales | 182.9 | 190.0 | +3.9% | +7.1 |
| Gross profit | 6.4 | 28.0 | +334.1% | +21.6 |
| Gross profit margin | 3.5% | 14.7% | – | +11.2pp |
| SG&A expenses | 25.4 | 25.0 | +1.8% | +0.4 |
| Operating income | △19.0 | 3.0 | – | +22.0 |
| Non-operating income & expenses | 7.6 | 4.5 | △40.8% | △3.1 |
| Ordinary income | △11.3 | 7.5 | – | +18.8 |
| Profit attributable to owners of parent | △14.9 | 6.0 | – | +20.9 |
| New orders | 175.8 | 200.0 | +13.8% | +24.2 |
| New orders including equity method affiliates | 420.4 | 200.0 | △52.4% | △220.4 |
Shareholder Returns
Dividends per share for FY2025 were ¥0, unchanged from the forecast. For FY2026 the company expects to resume dividends with ¥25 per share at the end of the term (planned), aiming to restore shareholder returns while advancing earnings recovery and stabilizing the financial base. Under the previous medium-term management plan, the reinstatement of dividends within the mid-term period was set as a target and dividends were paid in FY2023 and FY2024, with the company stating that it continues efforts to balance sustainable growth with shareholder returns.
Previous Medium-Term Management Plan (2021–2025): Review
The company assesses that profit targets were not achieved due to losses in some domestic and Brazil projects, while the expansion of non-EPC businesses and earnings contributions from overseas hubs made steady progress. Against a consolidated net income KGI of more than ¥5 billion on average in FY2023-2025 and ¥10 billion in FY2030, the result was “Not achieved”; the consolidated net sales KGI (focus on profit rather than sales, target net sales ¥300 billion) was assessed as “Achieved” because orders including OFS reached the target. ROE, targeted at 10% or more from FY2025, was also not achieved, deteriorating to -28.9% in FY2025 from 9.3% in FY2023 due to losses in the Brazil project and other factors; the company expects a recovery to 12.9% in FY2026.
On the KPI side, the non-EPC gross profit composition reached 68% in FY2025 against a target of 25% or more (“Achieved”), driven by urea licensing and EPs-related projects, and the group companies gross profit composition reached 59% against a target of 45% or more (“Achieved”). The new business areas gross profit composition was 20% against a target of 25% or more (“Not achieved”), as commercialization of new businesses slowed due to delays in investment decisions for CN projects. The employee engagement score improved to 3.8 from the previous score of 3.58. The company notes that FY2025 KPIs exclude the impact of the Brazil power project, which is treated as an outlier due to its large one-off loss impact.
New Medium-Term Management Plan (2026–2030)
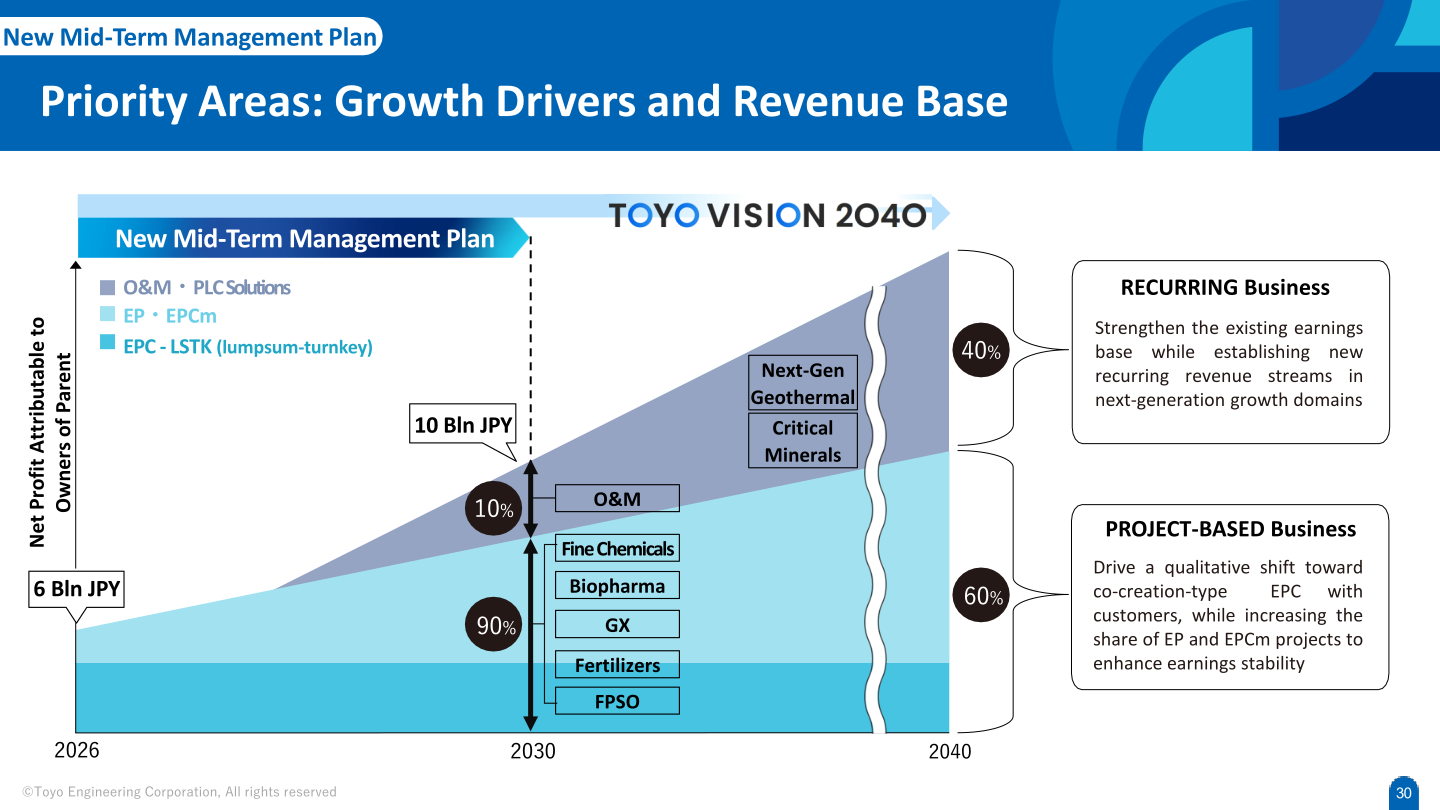
The company positions the next five years as the foundation for a Project-based x Recurring dual-revenue model under TOYO VISION 2040, maintaining the FY2030 net profit target of ¥10.0 billion while accelerating the qualitative strengthening of EPC and the shift toward recurring revenue. Net profit attributable to owners of parent is shown at 6 Bln JPY in 2026 and 10 Bln JPY in 2030, with the project-based / recurring mix moving from 90% / 10% in 2030 to 60% / 40% in 2040. O&M, next-generation geothermal, critical minerals, biopharma and fine chemicals are designated as growth drivers, with FPSO, fertilizers (ammonia and urea) and GX forming the revenue base, and India, Central Asia / the Middle East and Sub-Saharan Africa as focus regions.
Major Projects and Topics
In Central Asia, an MOU was signed for the Phase 2 overhaul of a large-scale gas chemical complex in Turkmenistan with the state-owned company Turkmenhimiya, covering a gas separation unit of 5.0 billion m³/year, ethylene production of 400,000 tons/year, polypropylene production of 81,000 tons/year and high-density polyethylene production of 386,000 tons/year, to be executed jointly with the Turkish construction company Rönesans. In India, TOYO secured a large-scale polypropylene EPC project for Bharat Petroleum Corporation Limited (400,000 tons per year) and an ammonium nitrate melt plant EPC project for Gujarat Narmada Valley Fertilizers & Chemicals Limited (480 tons per day), both scheduled for completion in FY2027.
In urea licensing, TOYO’s technology was adopted for Kazakhstan’s first urea plant (1,750 t/d) and a PDP was provided for one of the world’s largest urea plants in Nigeria (4,000 t/d × 2 trains). At the BASF Zhanjiang Verbund Site in China, TOYO completed a core project of BASF’s largest-ever investment on schedule; the Acrylic Acid Cluster achieved over 17.6 million work hours without a lost-time injury, the butyl acrylate plant achieved the shortest start-up period in BASF’s history, and TOYO received BASF’s “Outstanding Engineering Partner” award.
This article is an analysis based on publicly available information and is not a recommendation to buy or sell any specific securities. Investment decisions are your own responsibility.
![[Obayashi] Investors’ Guide 2026 — The Complete 24-Article Breakdown](https://japan-equity.com/wp-content/uploads/2026/07/hub_cover-1024x1024.png)
![[Obayashi] IR & SR Policy — Feeding Dialogue Back into Management](https://japan-equity.com/wp-content/uploads/2026/07/p32_sq-1024x1024.jpg)
![[Obayashi] Real Estate Development — 18.7% Margin, ¥287.7bn Unrealized Gains](https://japan-equity.com/wp-content/uploads/2026/07/p20_sq-1024x1024.jpg)
![[Obayashi] Domestic Civil Engineering — Resilience Spending Supports 9.6% Margin](https://japan-equity.com/wp-content/uploads/2026/07/p11_sq-1024x1024.jpg)
![[Obayashi] Share Price & External Ratings — vs TOPIX, ESG Index Inclusion](https://japan-equity.com/wp-content/uploads/2026/07/p40_sq-1024x1024.jpg)
![[Construction] ¥75.5tn Investment, Shrinking Workforce — Big-5 Market Share](https://japan-equity.com/wp-content/uploads/2026/07/p12_sq-1024x1024.jpg)



![[Obayashi] Capital Policy & Shareholder Returns — ROE 10%+, DOE ~5%, ¥100bn Buyback](https://japan-equity.com/wp-content/uploads/2026/07/p27_sq-1024x1024.jpg)
![[Obayashi] Reducing Cross-Shareholdings — ¥285.2bn Sold in Five Years](https://japan-equity.com/wp-content/uploads/2026/07/p29_sq-1024x1024.jpg)
![[Obayashi] ¥750bn Investment Plan — ¥300bn to Development, ¥190bn to Tech/DX](https://japan-equity.com/wp-content/uploads/2026/07/p30_sq-1024x1024.jpg)
![[Obayashi] MTP2022 KPIs — Operating Profit ~2x Target, ROE 14.4%](https://japan-equity.com/wp-content/uploads/2026/07/p25_sq-1024x1024.jpg)
![[Obayashi] Cash Allocation — ¥420bn Investment CF Over Five Years](https://japan-equity.com/wp-content/uploads/2026/07/p26_sq-1024x1024.jpg)
![[Obayashi] Green Energy — 44 Plants, 344MW, and the Green Hydrogen Challenge](https://japan-equity.com/wp-content/uploads/2026/07/p21_sq-1024x1024.jpg)
![[Obayashi] Tackling the Labor Shortage — Robotics Construction®](https://japan-equity.com/wp-content/uploads/2026/07/p14_sq-1024x1024.jpg)
