
This article is based on publicly available IR materials and is not a recommendation to buy or sell any specific securities.
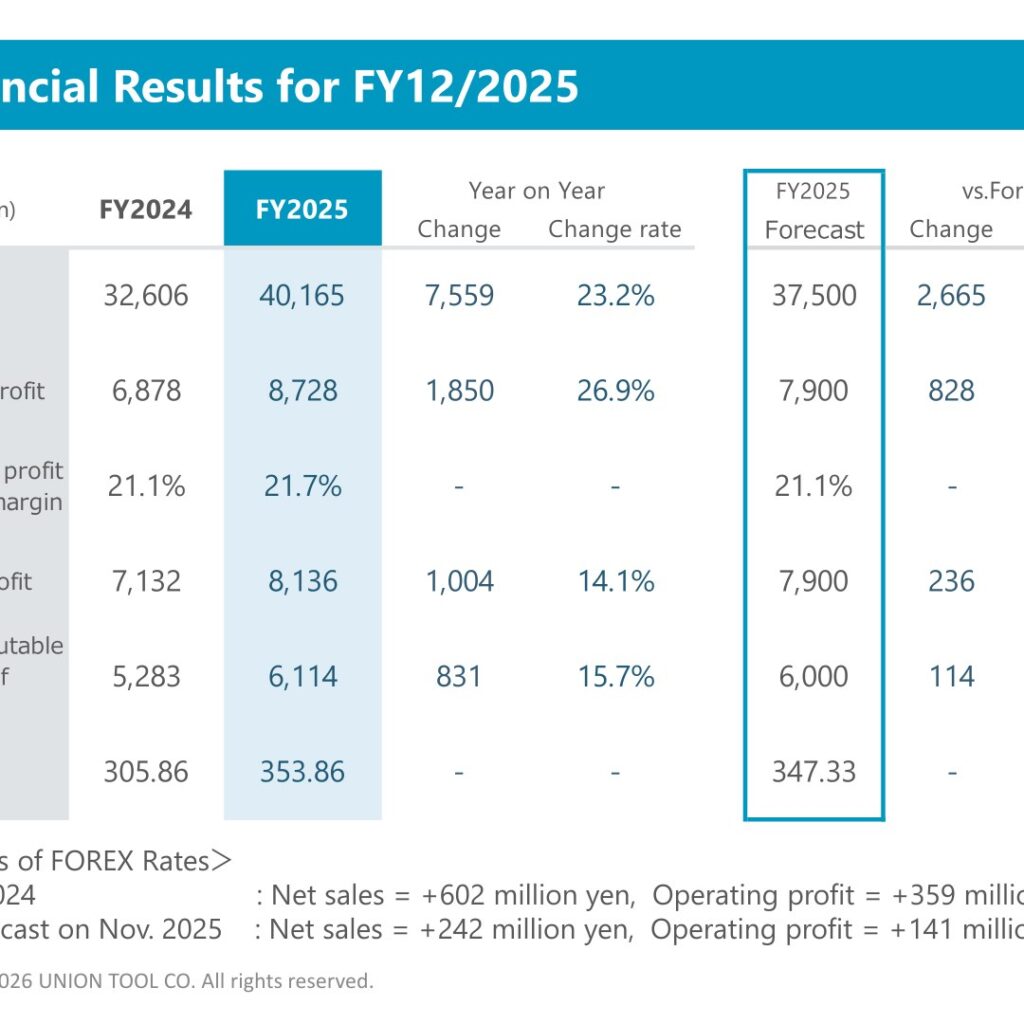
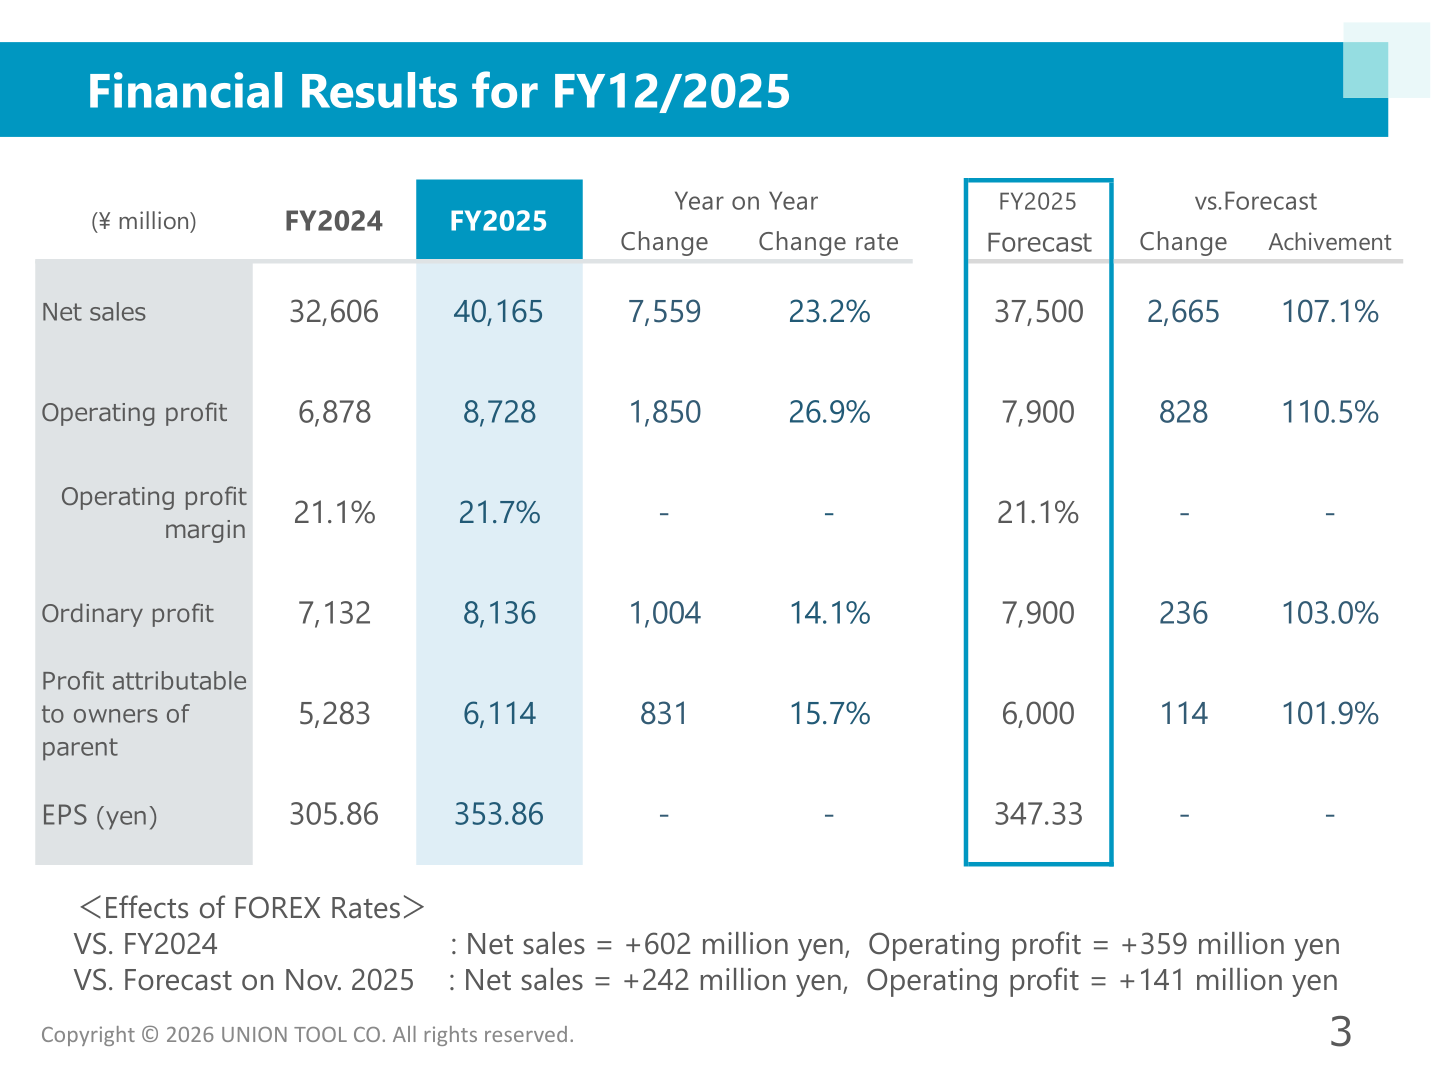
UNION TOOL CO. reported net sales of 40,165 million yen and operating profit of 8,728 million yen for FY12/2025 (the fiscal year ended December 31, 2025), and states that both consolidated sales and operating profit reached record highs. Results also exceeded the company’s own forecast, with net sales at 107.1% and operating profit at 110.5% of plan. The company attributes the year to increased demand for its products used in data center servers, driven by the expansion of the generative AI market, and says it rapidly expanded production capacity by leveraging its in-house facilities and strengthening group-wide collaboration on production planning and control.
Consolidated Results (Full-Year Actual)
Net sales rose 7,559 million yen, or 23.2%, year on year, and operating profit rose 1,850 million yen, or 26.9%. The operating profit margin improved to 21.7% from 21.1%. Ordinary profit increased 14.1% to 8,136 million yen and profit attributable to owners of parent increased 15.7% to 6,114 million yen, with EPS of 353.86 yen. Against the FY2025 forecast, net sales were 2,665 million yen higher, operating profit 828 million yen higher, ordinary profit 236 million yen higher and profit attributable to owners of parent 114 million yen higher. The company discloses the effects of FOREX rates as follows: versus FY2024, net sales +602 million yen and operating profit +359 million yen; versus the forecast made in November 2025, net sales +242 million yen and operating profit +141 million yen.
| (¥ million) | FY2024 | FY2025 | YoY Change | YoY Change rate | FY2025 Forecast | vs. Forecast Change | Achievement |
|---|---|---|---|---|---|---|---|
| Net sales | 32,606 | 40,165 | 7,559 | 23.2% | 37,500 | 2,665 | 107.1% |
| Operating profit | 6,878 | 8,728 | 1,850 | 26.9% | 7,900 | 828 | 110.5% |
| Operating profit margin | 21.1% | 21.7% | – | – | 21.1% | – | – |
| Ordinary profit | 7,132 | 8,136 | 1,004 | 14.1% | 7,900 | 236 | 103.0% |
| Profit attributable to owners of parent | 5,283 | 6,114 | 831 | 15.7% | 6,000 | 114 | 101.9% |
| EPS (yen) | 305.86 | 353.86 | – | – | 347.33 | – | – |
On a quarterly basis, net sales were 8,802 million yen in Q1, 9,444 million yen in Q2, 9,768 million yen in Q3 and 12,150 million yen in Q4, with operating profit of 2,210 million yen, 1,977 million yen, 2,426 million yen and 2,113 million yen respectively. The quarterly operating profit margin moved from 25.1% in Q1 to 20.9% in Q2, 24.8% in Q3 and 17.4% in Q4. The USD/JPY FOREX rates shown for each quarter were 149.52, 144.81, 148.88 and 156.56.
Sales by Product
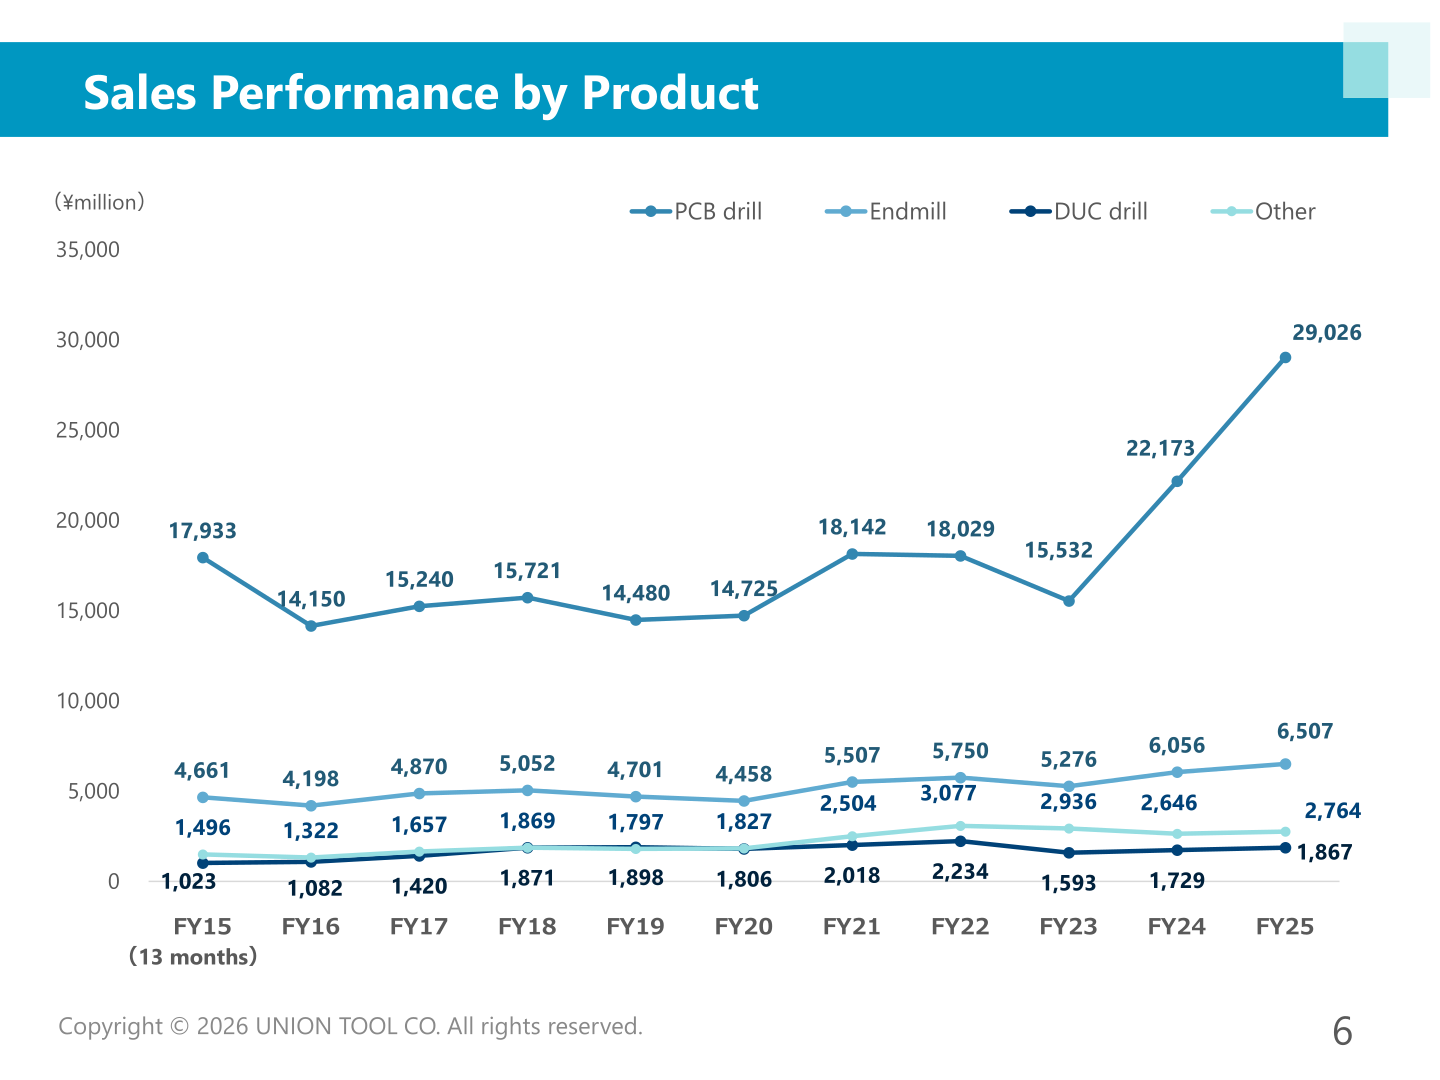
PCB drill sales, the largest product line, rose to 29,026 million yen in FY25 from 22,173 million yen in FY24. Endmill sales rose to 6,507 million yen from 6,056 million yen, DUC drill sales to 1,867 million yen from 1,729 million yen, and Other to 2,764 million yen from 2,646 million yen.
| Product | FY24 (¥ million) | FY25 (¥ million) |
|---|---|---|
| PCB drill | 22,173 | 29,026 |
| Endmill | 6,056 | 6,507 |
| DUC drill | 1,729 | 1,867 |
| Other | 2,646 | 2,764 |
PCB drill volumes rose through the year: sales quantity was 89, 98, 103 and 112 million pieces in FY25 Q1 to Q4 against an FY24 average of 78 million pieces, while production quantity was 90, 103, 108 and 118 million pieces against an FY24 average of 81 million pieces. The sales ratio of ULF coated products within the PCB drill range rose to 35.0% in FY25 from 31.7% in FY24. In the slide on major PCB drill users — which the company notes is domestic data in Japan for a single month of December — PKG accounted for 54% in FY25 (46% in FY24), automotive 16% (17%), telecommunication 9% (15%), digital & mobile 5% (6%) and others 16% (16%). Consolidated end mill sales are shown at 6,507 million yen for FY25 with an FY26 forecast of 6,873 million yen.
FY12/2026 Forecast
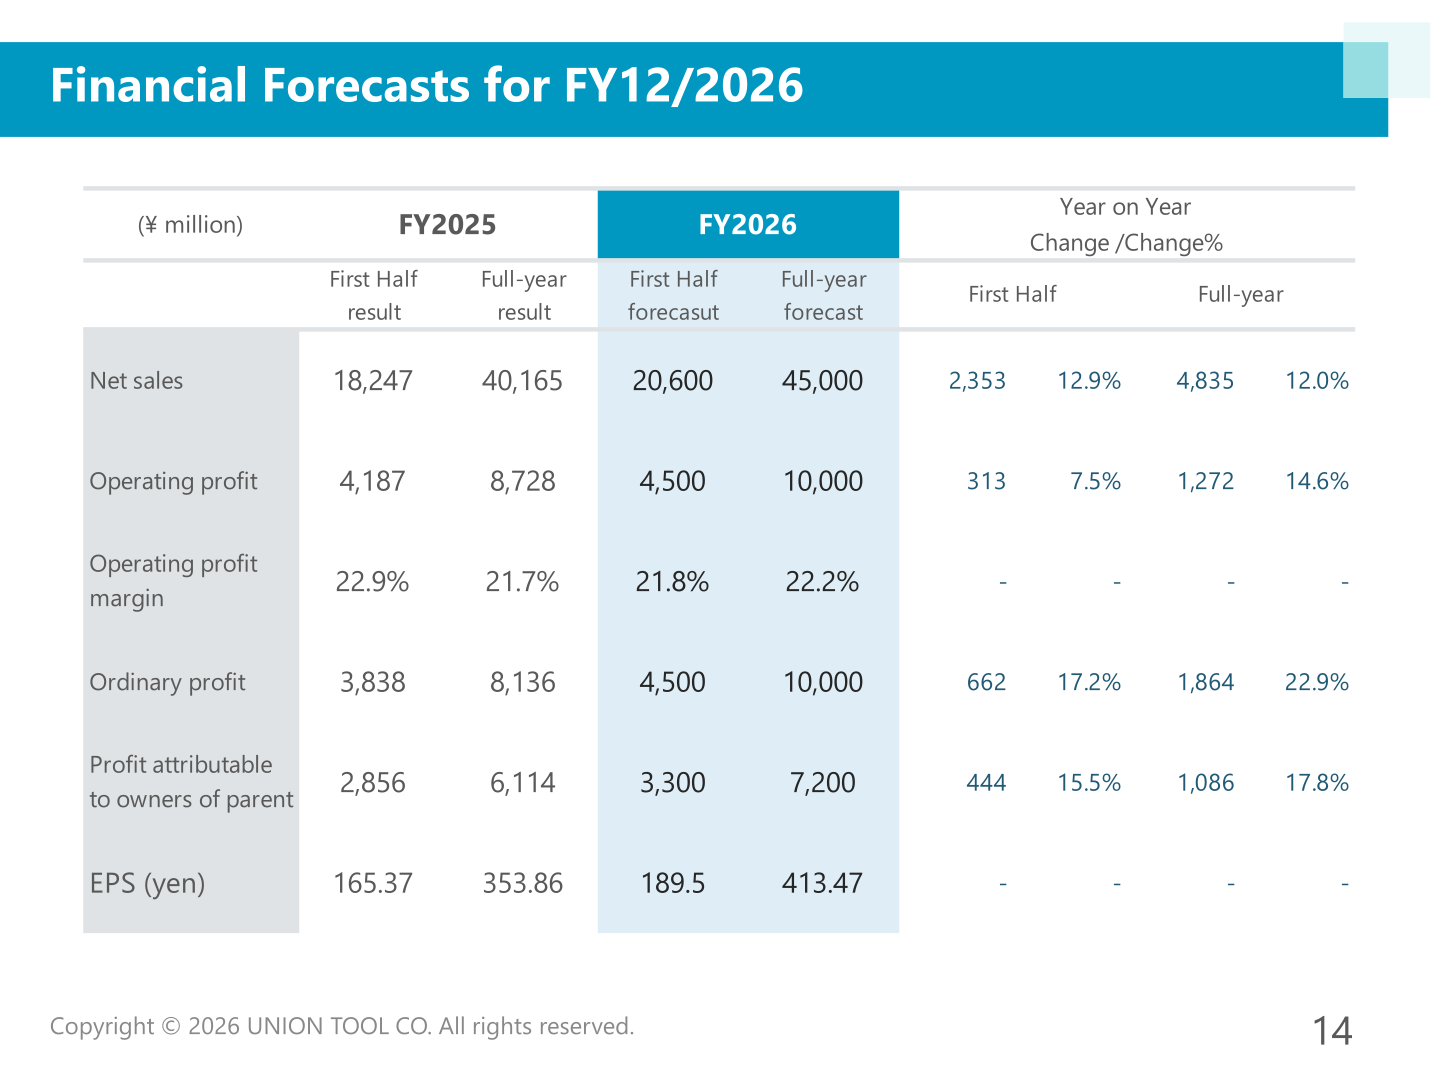
For FY12/2026 the company forecasts net sales of 45,000 million yen (+12.0% year on year), operating profit of 10,000 million yen (+14.6%), ordinary profit of 10,000 million yen (+22.9%) and profit attributable to owners of parent of 7,200 million yen (+17.8%), with an operating profit margin of 22.2% and EPS of 413.47 yen. For the first half it forecasts net sales of 20,600 million yen (+12.9%) and operating profit of 4,500 million yen (+7.5%). The assumed FX rates for FY2026 are 150.00 yen to the US dollar, 165.00 yen to the euro, 20.00 yen to the RMB and 4.60 yen to the NT dollar, against FY2025 actuals of 156.56, 184.33, 22.36 and 4.98 respectively.
| (¥ million) | FY2025 First Half result | FY2025 Full-year result | FY2026 First Half forecast | FY2026 Full-year forecast | Full-year YoY Change | Full-year YoY Change% |
|---|---|---|---|---|---|---|
| Net sales | 18,247 | 40,165 | 20,600 | 45,000 | 4,835 | 12.0% |
| Operating profit | 4,187 | 8,728 | 4,500 | 10,000 | 1,272 | 14.6% |
| Operating profit margin | 22.9% | 21.7% | 21.8% | 22.2% | – | – |
| Ordinary profit | 3,838 | 8,136 | 4,500 | 10,000 | 1,864 | 22.9% |
| Profit attributable to owners of parent | 2,856 | 6,114 | 3,300 | 7,200 | 1,086 | 17.8% |
| EPS (yen) | 165.37 | 353.86 | 189.5 | 413.47 | – | – |
Shareholder Returns
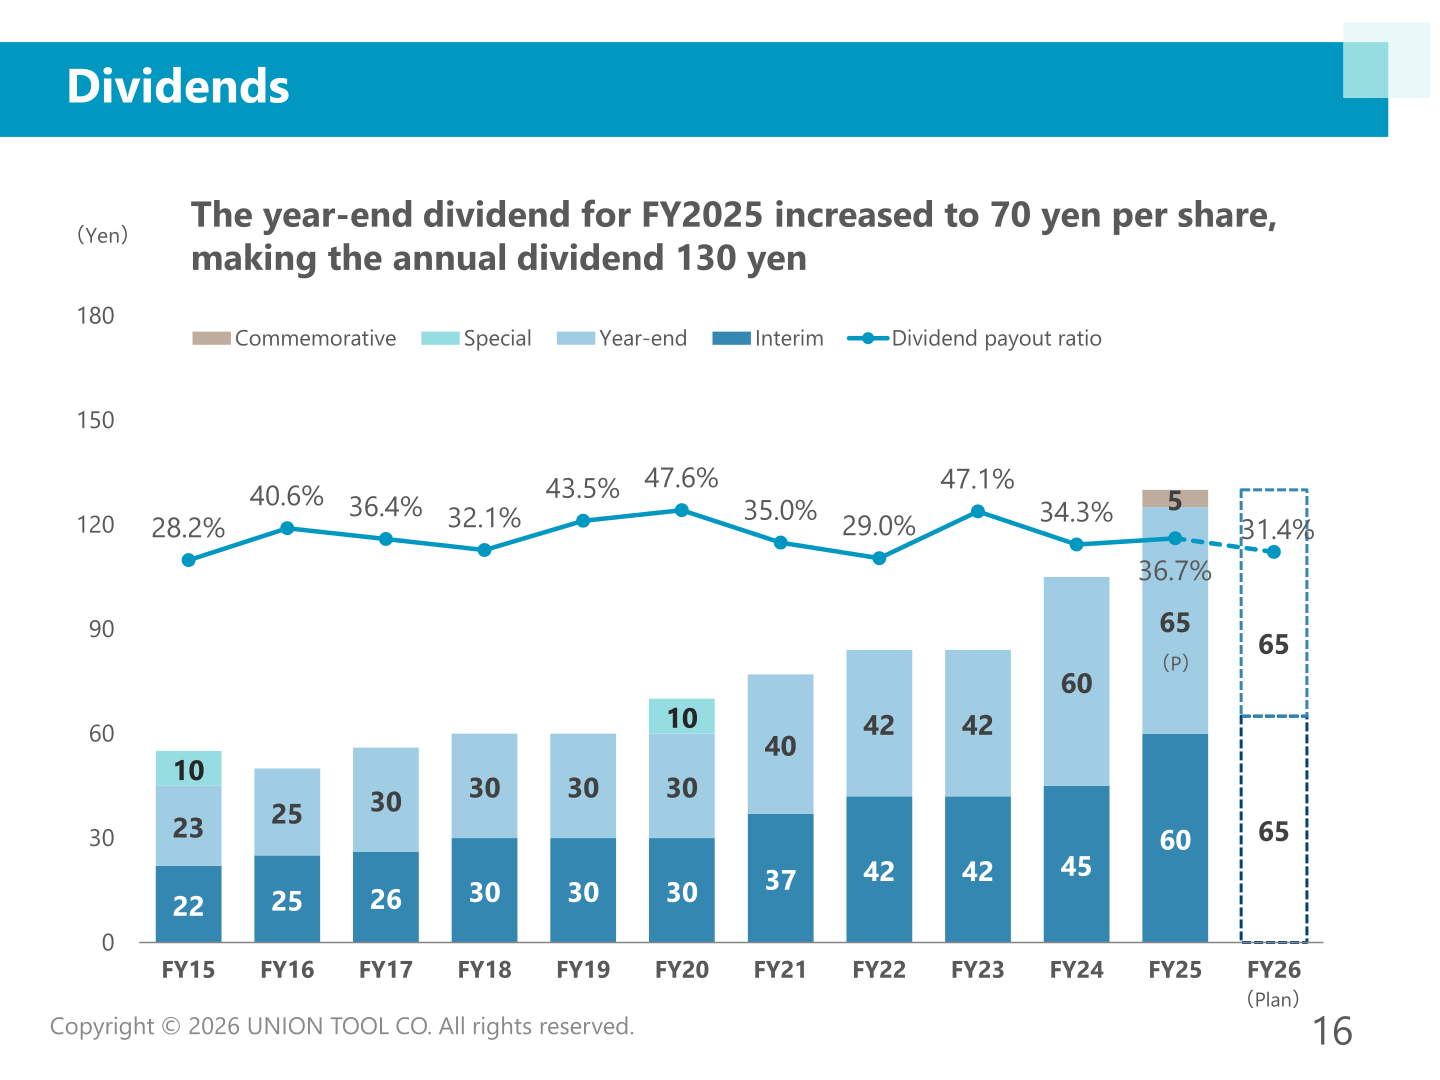
The dividend slide states that the year-end dividend for FY2025 increased to 70 yen per share, making the annual dividend 130 yen. The chart shows FY25 broken down into an interim dividend of 60 yen, a year-end dividend of 65 yen and a 5 yen commemorative dividend, with a dividend payout ratio of 36.7% against 34.3% in FY24. For FY26 the plan shown is 65 yen interim and 65 yen year-end, with a dividend payout ratio of 31.4%. On fund distribution, the company states that it believes in the importance of generating profits through its business activities and allocating funds by carefully balancing shareholder returns, growth investments, and management stability.
| Item (yen) | FY24 | FY25 | FY26 (Plan) |
|---|---|---|---|
| Interim | 45 | 60 | 65 |
| Year-end | 60 | 65 | 65 |
| Commemorative | – | 5 | – |
| Dividend payout ratio | 34.3% | 36.7% | 31.4% |
Capital Expenditure, R&D and Management Indicators
Capital expenditure was 5,720 million yen in FY2025 against 5,623 million yen in FY2024, of which 3,025 million yen was construction costs for the Mitsuke Plant, third factory. Depreciation was 3,316 million yen against 2,906 million yen. For FY2026 the company plans capital expenditure of 10,469 million yen and depreciation of 4,636 million yen, noting the construction of Factory No. 6 at the Nagaoka Plant, scheduled for completion in June 2027 with a planned investment of approximately JPY 6,200 million, and stating that it will accelerate investment in production equipment toward the start-up of operations. Research and development expenses were 2,341 million yen in FY2025 (5.8% of sales) against 1,968 million yen (6.0%) in FY2024, with 2,349 million yen (5.2%) planned for FY2026.
On the fund distribution slide, BPS was 4,594 yen at the end of FY2025 against 4,234 yen a year earlier, ROE was 8.0% against 7.5%, the closing share price at fiscal year end was 8,530 yen against 5,020 yen, PBR was 1.86 against 1.19 and PER was 24.1 against 16.4.
Topics
The company lists three topics for FY12/2025: demand for its products used in data center servers increased, driven by the expansion of the generative AI market, and it rapidly expanded production capacity by leveraging in-house facilities and strengthening group-wide collaboration on production planning and control; it established an optimal global sales strategy tailored to region-specific needs; and it launched new value-added products to meet increasingly diverse quality requirements. The materials do not contain a breakdown of sales by geographic region.
This article is an analysis based on publicly available information and is not a recommendation to buy or sell any specific securities. Investment decisions are your own responsibility.
![[Obayashi] Investors’ Guide 2026 — The Complete 24-Article Breakdown](https://japan-equity.com/wp-content/uploads/2026/07/hub_cover-1024x1024.png)
![[Obayashi] IR & SR Policy — Feeding Dialogue Back into Management](https://japan-equity.com/wp-content/uploads/2026/07/p32_sq-1024x1024.jpg)
![[Obayashi] Real Estate Development — 18.7% Margin, ¥287.7bn Unrealized Gains](https://japan-equity.com/wp-content/uploads/2026/07/p20_sq-1024x1024.jpg)
![[Obayashi] Domestic Civil Engineering — Resilience Spending Supports 9.6% Margin](https://japan-equity.com/wp-content/uploads/2026/07/p11_sq-1024x1024.jpg)
![[Obayashi] Share Price & External Ratings — vs TOPIX, ESG Index Inclusion](https://japan-equity.com/wp-content/uploads/2026/07/p40_sq-1024x1024.jpg)
![[Construction] ¥75.5tn Investment, Shrinking Workforce — Big-5 Market Share](https://japan-equity.com/wp-content/uploads/2026/07/p12_sq-1024x1024.jpg)



![[Obayashi] Capital Policy & Shareholder Returns — ROE 10%+, DOE ~5%, ¥100bn Buyback](https://japan-equity.com/wp-content/uploads/2026/07/p27_sq-1024x1024.jpg)
![[Obayashi] Reducing Cross-Shareholdings — ¥285.2bn Sold in Five Years](https://japan-equity.com/wp-content/uploads/2026/07/p29_sq-1024x1024.jpg)
![[Obayashi] ¥750bn Investment Plan — ¥300bn to Development, ¥190bn to Tech/DX](https://japan-equity.com/wp-content/uploads/2026/07/p30_sq-1024x1024.jpg)
![[Obayashi] MTP2022 KPIs — Operating Profit ~2x Target, ROE 14.4%](https://japan-equity.com/wp-content/uploads/2026/07/p25_sq-1024x1024.jpg)
![[Obayashi] Cash Allocation — ¥420bn Investment CF Over Five Years](https://japan-equity.com/wp-content/uploads/2026/07/p26_sq-1024x1024.jpg)
![[Obayashi] Green Energy — 44 Plants, 344MW, and the Green Hydrogen Challenge](https://japan-equity.com/wp-content/uploads/2026/07/p21_sq-1024x1024.jpg)
![[Obayashi] Tackling the Labor Shortage — Robotics Construction®](https://japan-equity.com/wp-content/uploads/2026/07/p14_sq-1024x1024.jpg)
