
This article is based on publicly available IR materials and is not a recommendation to buy or sell any specific securities.
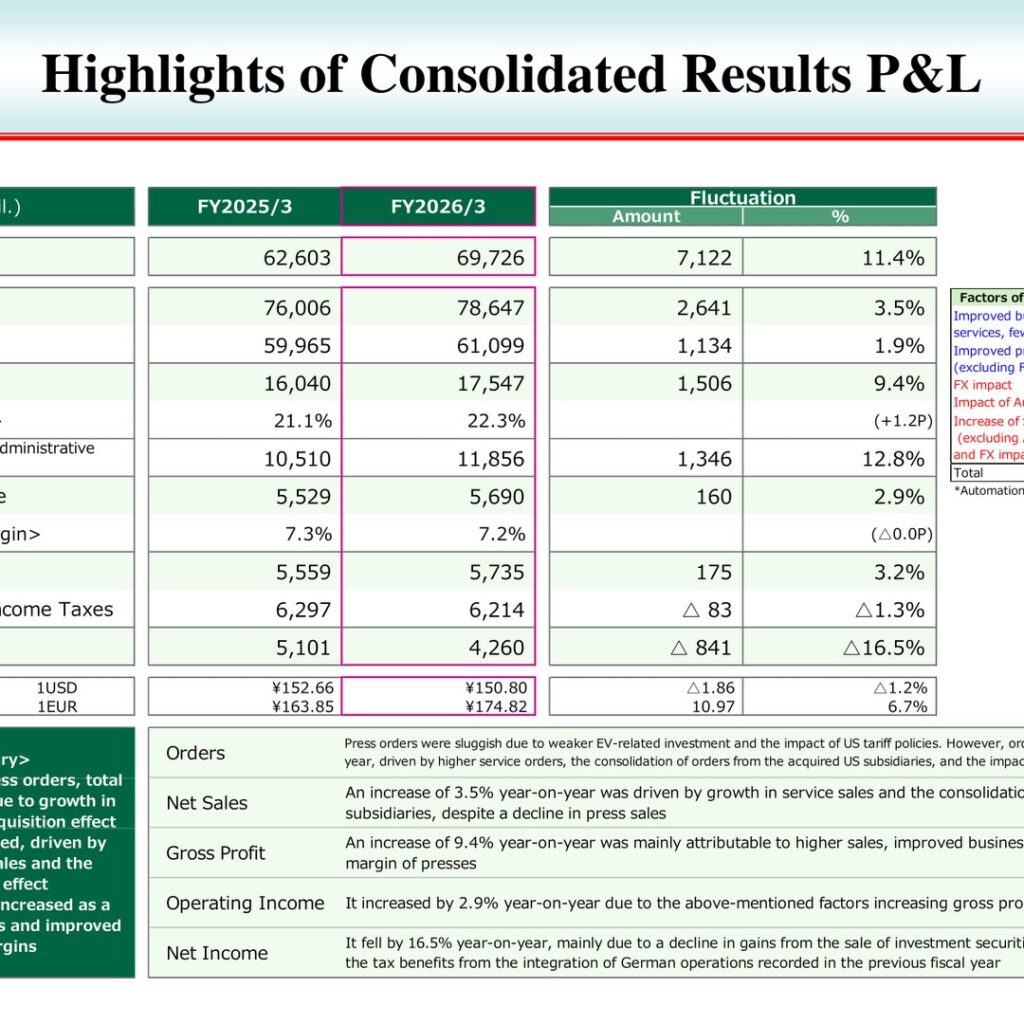
Note: AIDA ENGINEERING labels the fiscal year ended March 31, 2026 as “FY2026/3” and the prior year as “FY2025/3” in its presentation materials; the labels used in the text, tables and segment data below follow the materials. AIDA ENGINEERING reported orders of 69,726 million yen (up 11.4% year-on-year) and net sales of 78,647 million yen (up 3.5%) for FY2026/3. Operating income rose 2.9% to 5,690 million yen, while net income fell 16.5% to 4,260 million yen. According to the materials, press orders were sluggish due to weaker EV-related investment and the impact of US tariff policies, but total orders rose on higher service orders, the consolidation of orders from the acquired US subsidiaries, and the weaker yen.
Consolidated Results (Full-Year Actual)
Gross profit increased 9.4% to 17,547 million yen and the gross margin improved 1.2 points to 22.3%, which the company attributes to higher sales, an improved business portfolio and a better gross margin on presses. Selling, general and administrative expenses rose 12.8% to 11,856 million yen, so operating income increased 2.9% to 5,690 million yen and the operating margin edged down to 7.2%. Net income declined 16.5% to 4,260 million yen, which the materials state was mainly due to a decline in gains from the sale of investment securities and the absence of the tax benefits from the integration of German operations recorded in the previous fiscal year. The materials break down the change in operating income (unit: ¥100 million) as follows: improved business portfolio (more services, fewer presses) 4.0; improved presses gross margins (excluding FX impact) 3.7; FX impact △ 0.1; impact of Automation Subsidiaries (REJ, HMS, Dallas) △ 1.0; increase of SG&A expenses (excluding Automation Subsidiaries and FX impact) △ 5.0; total 1.6.
| Item (JPY mil.) | FY2025/3 | FY2026/3 | Change (Amount) | Change (%) |
|---|---|---|---|---|
| Orders | 62,603 | 69,726 | 7,122 | 11.4% |
| Net Sales | 76,006 | 78,647 | 2,641 | 3.5% |
| Cost of Sales | 59,965 | 61,099 | 1,134 | 1.9% |
| Gross Profit | 16,040 | 17,547 | 1,506 | 9.4% |
| <Gross Margin> | 21.1% | 22.3% | (+1.2P) | |
| Selling, general and administrative expenses | 10,510 | 11,856 | 1,346 | 12.8% |
| Operating Income | 5,529 | 5,690 | 160 | 2.9% |
| <Operating Margin> | 7.3% | 7.2% | (△0.0P) | |
| Ordinary Income | 5,559 | 5,735 | 175 | 3.2% |
| Income Before Income Taxes | 6,297 | 6,214 | △ 83 | △1.3% |
| Net Income | 5,101 | 4,260 | △ 841 | △16.5% |
| Exchange Rate: 1USD | ¥152.66 | ¥150.80 | △1.86 | △1.2% |
| Exchange Rate: 1EUR | ¥163.85 | ¥174.82 | 10.97 | 6.7% |
Orders and Order Backlog
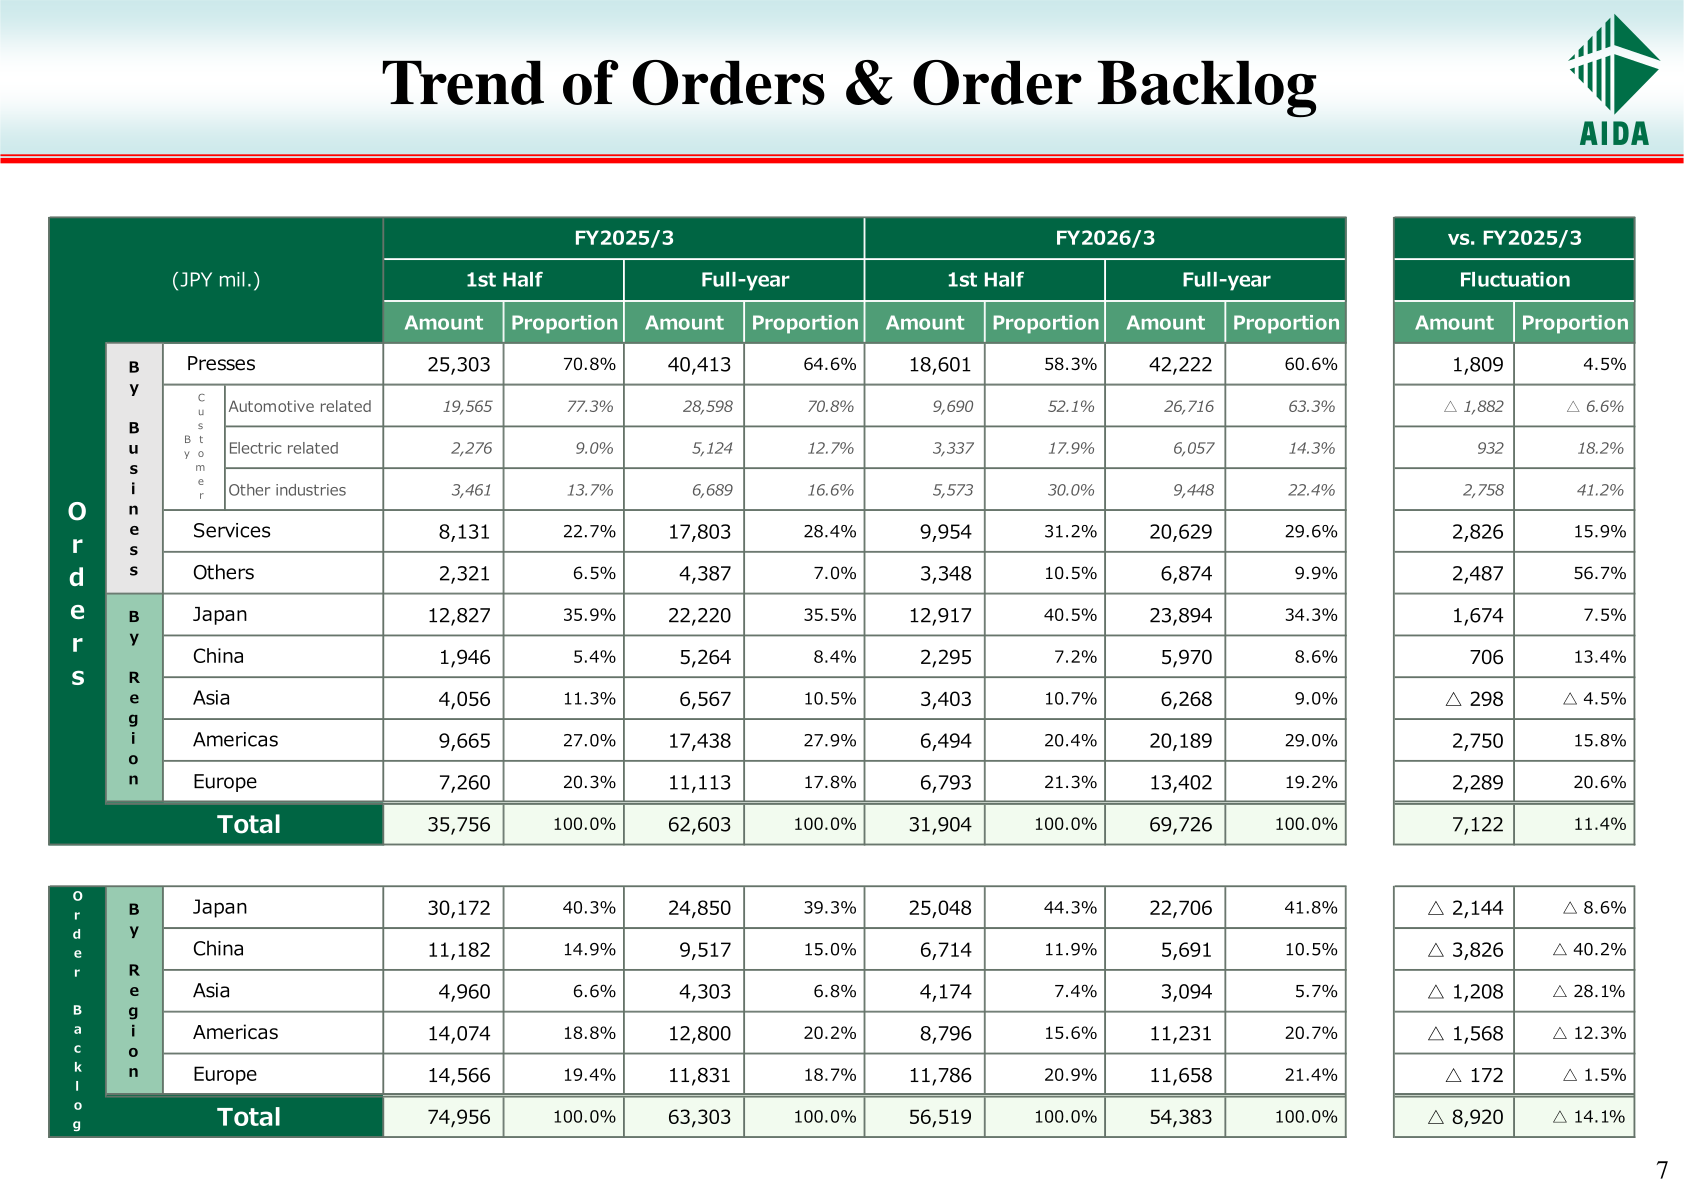
Full-year orders rose 11.4% to 69,726 million yen. By business, press orders were 42,222 million yen (up 4.5%), service orders 20,629 million yen (up 15.9%) and others 6,874 million yen (up 56.7%). By region, orders increased in Japan, China, the Americas and Europe, while Asia declined. The order backlog at the end of the period fell 14.1% to 54,383 million yen, with declines in every region.
| Category (JPY mil.) | FY2025/3 Full-year | FY2026/3 Full-year | Change (Amount) | Change (%) |
|---|---|---|---|---|
| Orders: Presses | 40,413 | 42,222 | 1,809 | 4.5% |
| Orders: Services | 17,803 | 20,629 | 2,826 | 15.9% |
| Orders: Others | 4,387 | 6,874 | 2,487 | 56.7% |
| Orders: Japan | 22,220 | 23,894 | 1,674 | 7.5% |
| Orders: China | 5,264 | 5,970 | 706 | 13.4% |
| Orders: Asia | 6,567 | 6,268 | △ 298 | △ 4.5% |
| Orders: Americas | 17,438 | 20,189 | 2,750 | 15.8% |
| Orders: Europe | 11,113 | 13,402 | 2,289 | 20.6% |
| Orders: Total | 62,603 | 69,726 | 7,122 | 11.4% |
| Order Backlog: Japan | 24,850 | 22,706 | △ 2,144 | △ 8.6% |
| Order Backlog: China | 9,517 | 5,691 | △ 3,826 | △ 40.2% |
| Order Backlog: Asia | 4,303 | 3,094 | △ 1,208 | △ 28.1% |
| Order Backlog: Americas | 12,800 | 11,231 | △ 1,568 | △ 12.3% |
| Order Backlog: Europe | 11,831 | 11,658 | △ 172 | △ 1.5% |
| Order Backlog: Total | 63,303 | 54,383 | △ 8,920 | △ 14.1% |
Segment Results
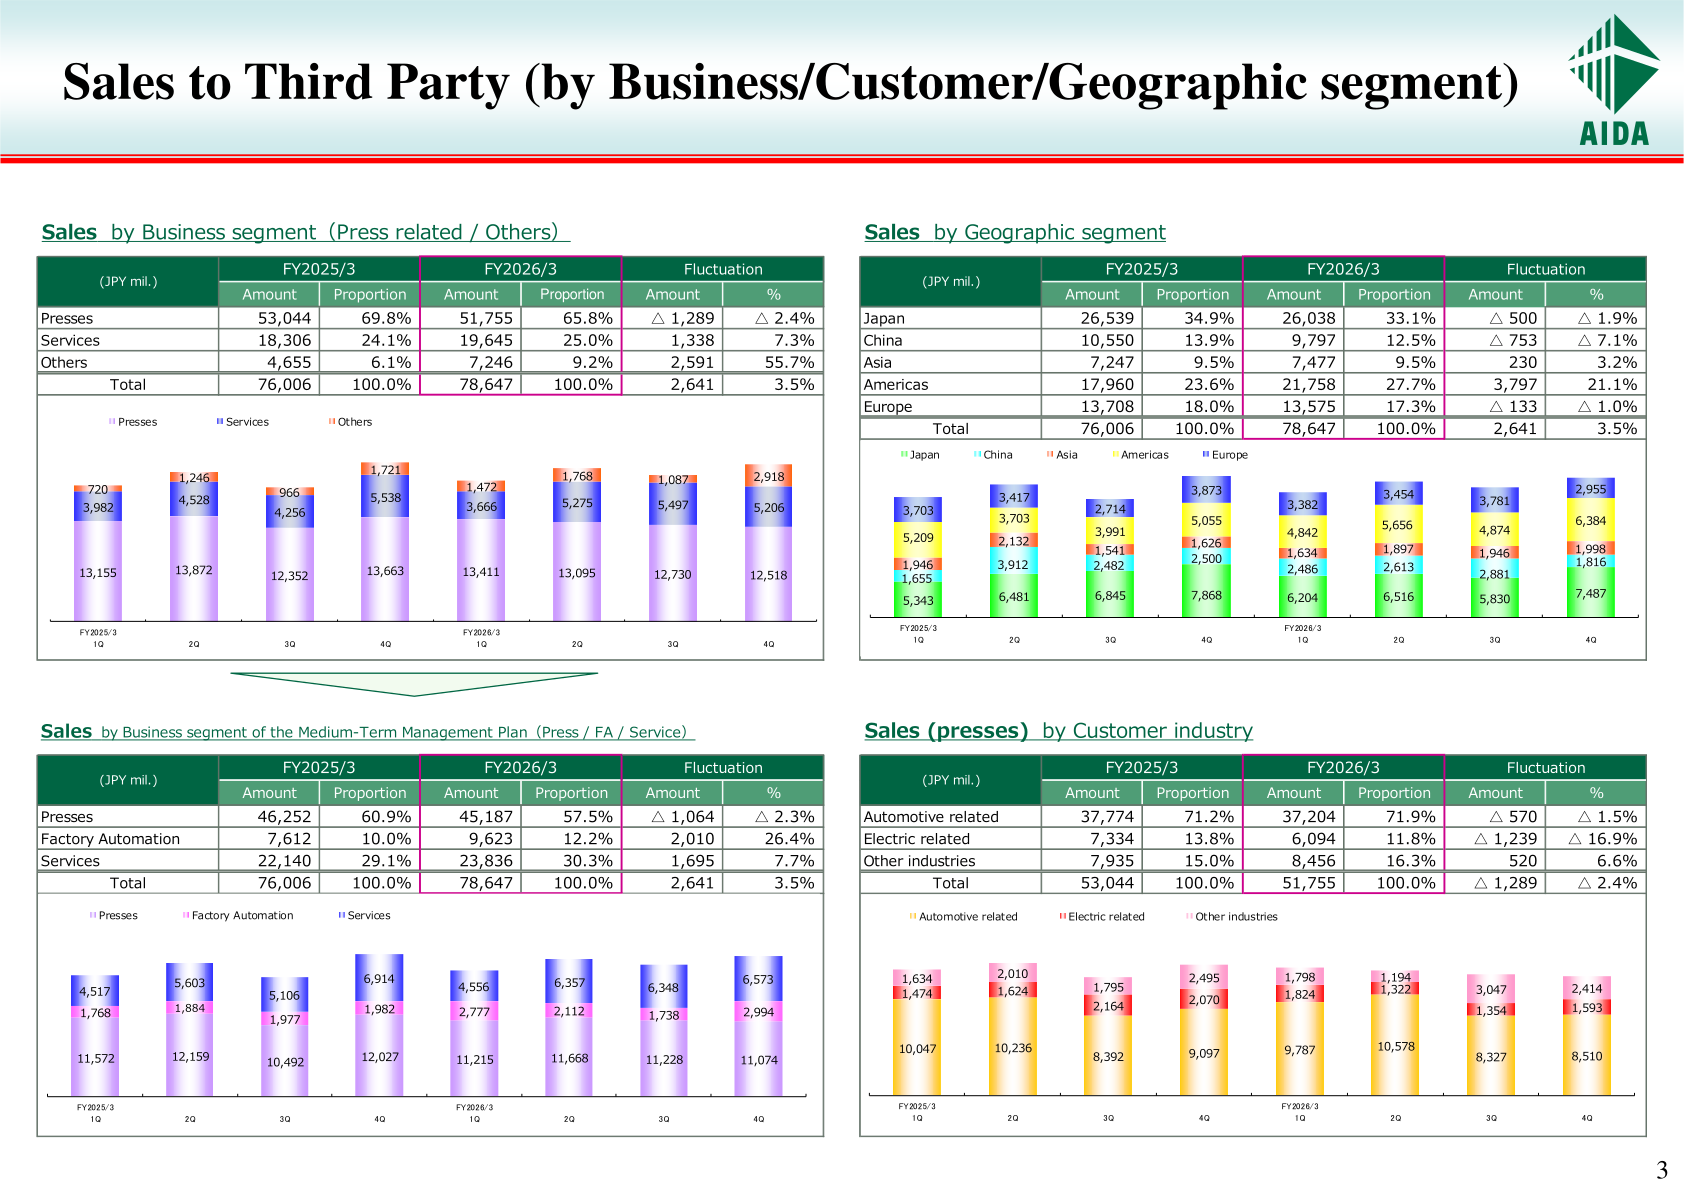
On a sales-to-third-party basis, press sales fell 2.4% to 51,755 million yen while service sales rose 7.3% to 19,645 million yen and others rose 55.7% to 7,246 million yen. By geography, the Americas grew 21.1% to 21,758 million yen and accounted for 27.7% of sales, while Japan, China and Europe declined. Within press sales by customer industry, automotive-related sales were 37,204 million yen (71.9% of press sales) and electric-related sales fell 16.9% to 6,094 million yen. On a segment basis including internal transactions, Japan posted net sales of 42,743 million yen with operating income of 2,997 million yen (7.0% margin), and the Americas posted net sales of 21,943 million yen with operating income of 1,184 million yen (5.4% margin).
| Sales to Third Party (JPY mil.) | FY2025/3 | Proportion | FY2026/3 | Proportion | Change (%) |
|---|---|---|---|---|---|
| Presses | 53,044 | 69.8% | 51,755 | 65.8% | △ 2.4% |
| Services | 18,306 | 24.1% | 19,645 | 25.0% | 7.3% |
| Others | 4,655 | 6.1% | 7,246 | 9.2% | 55.7% |
| Japan | 26,539 | 34.9% | 26,038 | 33.1% | △ 1.9% |
| China | 10,550 | 13.9% | 9,797 | 12.5% | △ 7.1% |
| Asia | 7,247 | 9.5% | 7,477 | 9.5% | 3.2% |
| Americas | 17,960 | 23.6% | 21,758 | 27.7% | 21.1% |
| Europe | 13,708 | 18.0% | 13,575 | 17.3% | △ 1.0% |
| Total | 76,006 | 100.0% | 78,647 | 100.0% | 3.5% |
| Geographic Segment (JPY mil.) | Net Sales FY2025/3 | Net Sales FY2026/3 | Operating Income FY2025/3 | Operating Income FY2026/3 |
|---|---|---|---|---|
| Japan | 46,609 | 42,743 | 2,810 (6.0%) | 2,997 (7.0%) |
| China | 11,704 | 11,166 | 838 (7.2%) | 743 (6.7%) |
| Asia | 10,835 | 10,707 | 510 (4.7%) | 206 (1.9%) |
| Americas | 18,241 | 21,943 | 1,288 (7.1%) | 1,184 (5.4%) |
| Europe | 14,773 | 13,680 | 202 (1.4%) | 190 (1.4%) |
FY2027/3 Forecast
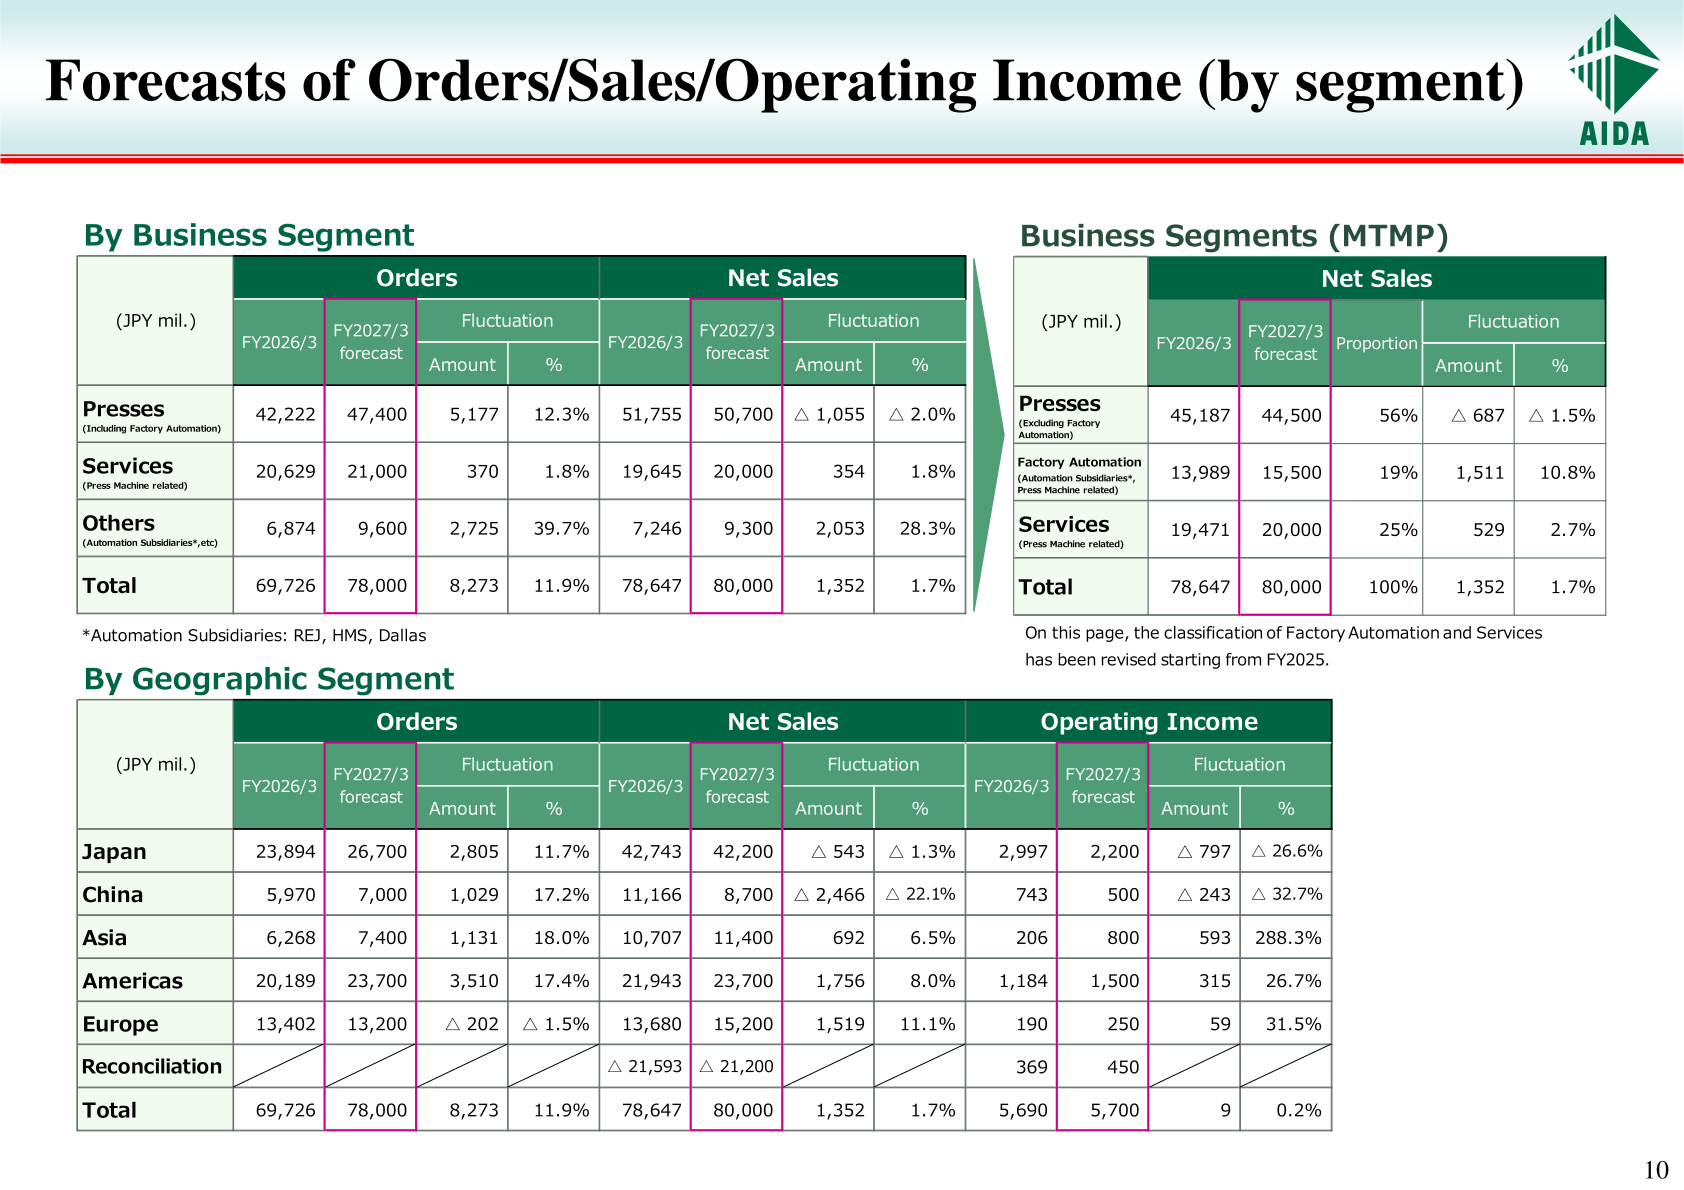
For FY2027/3 the company forecasts orders of 78,000 million yen (up 11.9%) and net sales of 80,000 million yen (up 1.7%). Operating income is projected at 5,700 million yen, up 0.2% and essentially at the previous year’s level, with net income of 4,300 million yen (up 0.9%). The materials state that orders are expected to increase on a recovery in press orders following the slump caused by tariff policy uncertainties, as well as the consolidation of orders from Dallas, which was acquired in the previous fiscal year. Assumed exchange rates are ¥150.00 to the US dollar and ¥175.00 to the euro. By segment, the forecast calls for orders of 47,400 million yen for Presses (including Factory Automation), 21,000 million yen for Services and 9,600 million yen for Others.
| Item (JPY mil.) | FY2026/3 (Actual) | FY2027/3 (Forecast) | Change (Amount) | Change (%) |
|---|---|---|---|---|
| Orders | 69,726 | 78,000 | 8,273 | 11.9% |
| Net Sales | 78,647 | 80,000 | 1,352 | 1.7% |
| Cost of Sales | 61,099 | 61,900 | 800 | 1.3% |
| Gross Profit | 17,547 | 18,100 | 552 | 3.2% |
| <Gross Margin> | 22.3% | 22.6% | (+0.3P) | |
| Selling, general and administrative expenses | 11,856 | 12,400 | 543 | 4.6% |
| Operating Income | 5,690 | 5,700 | 9 | 0.2% |
| <Operating Margin> | 7.2% | 7.1% | (△0.1P) | |
| Ordinary Income | 5,735 | 6,000 | 264 | 4.6% |
| Income Before Income Taxes | 6,214 | 6,000 | △ 214 | △3.5% |
| Net Income | 4,260 | 4,300 | 39 | 0.9% |
| Exchange Rate: 1USD | ¥150.80 | ¥150.00 | △0.80 | △0.5% |
| Exchange Rate: 1EUR | ¥174.82 | ¥175.00 | 0.18 | 0.1% |
Shareholder Returns
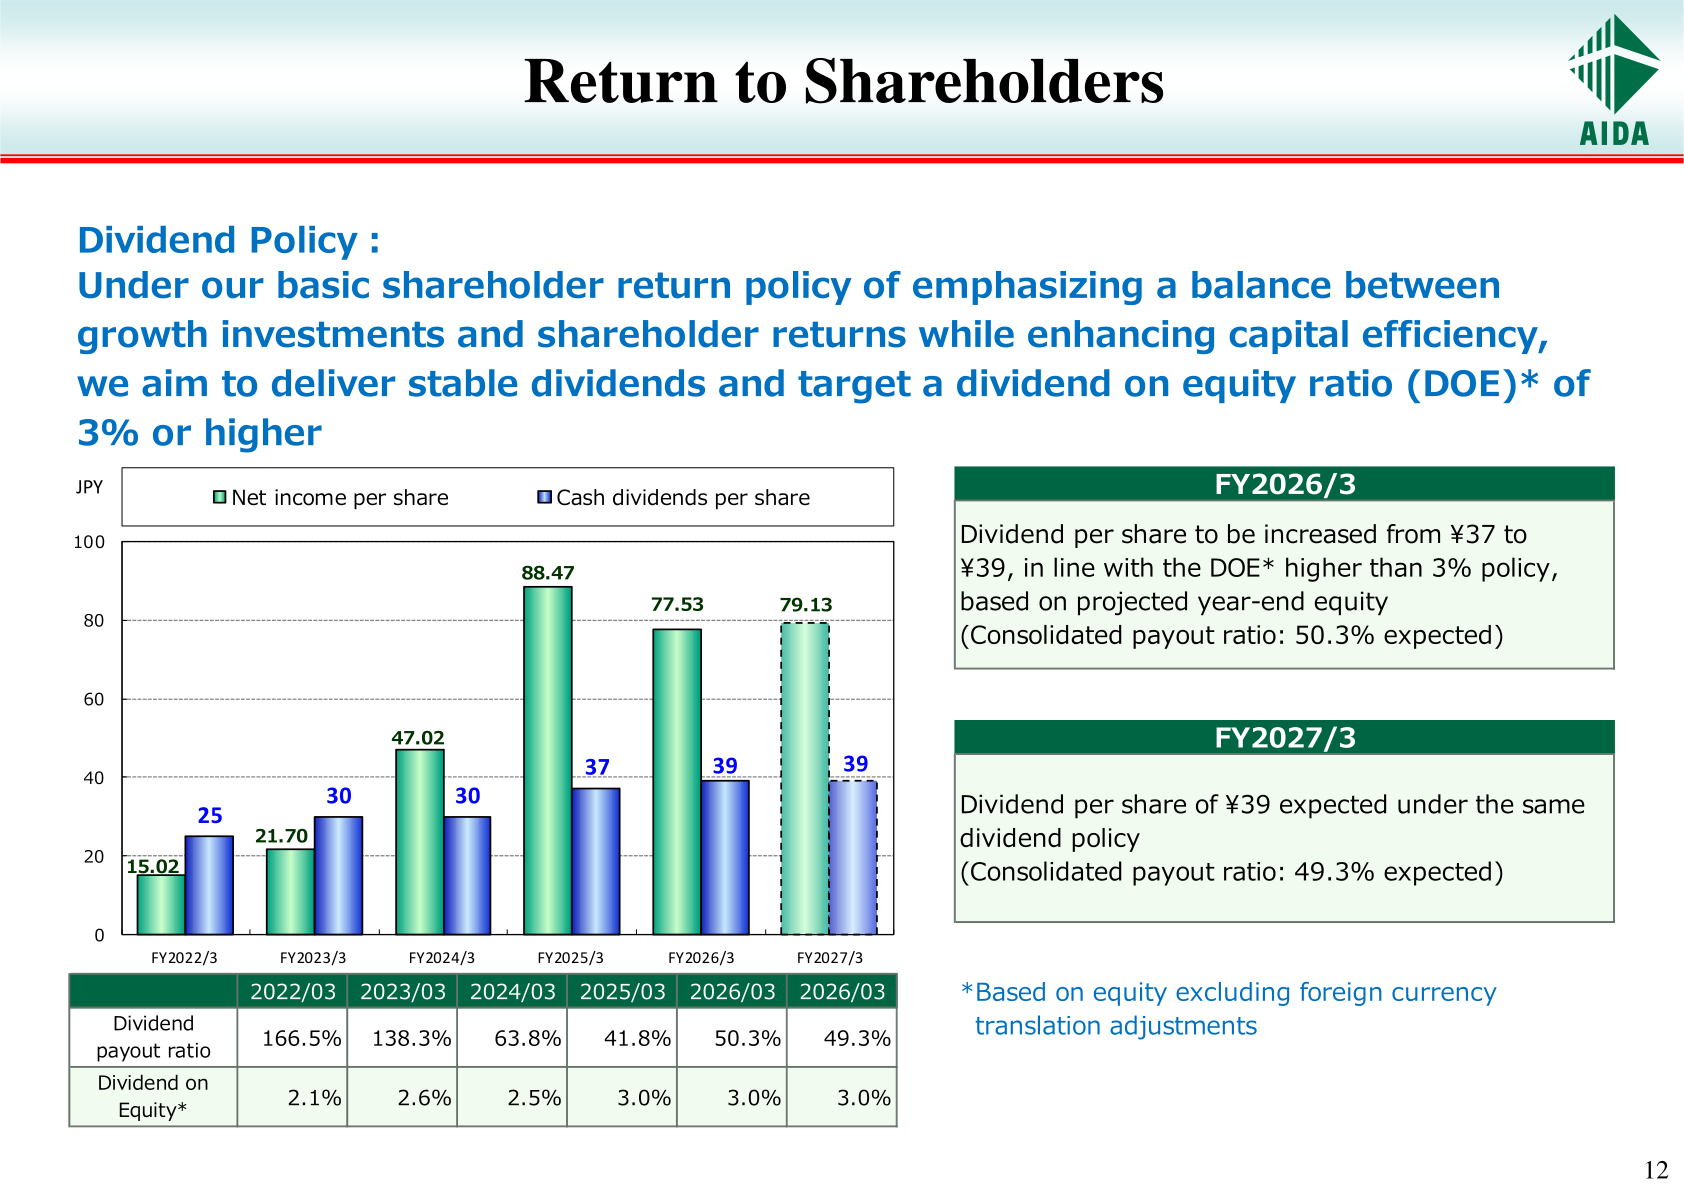
The dividend policy stated in the materials is: “Under our basic shareholder return policy of emphasizing a balance between growth investments and shareholder returns while enhancing capital efficiency, we aim to deliver stable dividends and target a dividend on equity ratio (DOE) of 3% or higher” (DOE is based on equity excluding foreign currency translation adjustments). For FY2026/3 the dividend per share is to be increased from ¥37 to ¥39 in line with the DOE higher than 3% policy, based on projected year-end equity, with a consolidated payout ratio of 50.3% expected. For FY2027/3 a dividend per share of ¥39 is expected under the same dividend policy, with a consolidated payout ratio of 49.3% expected.
| Item | FY2025/3 | FY2026/3 | FY2027/3 |
|---|---|---|---|
| Cash dividends per share (JPY) | 37 | 39 | 39 |
| Net income per share (JPY) | 88.47 | 77.53 | 79.13 |
| Dividend payout ratio | 41.8% | 50.3% | 49.3% |
| Dividend on Equity | 3.0% | 3.0% | 3.0% |
Capital Expenditures, R&D and Cash Flow
Capital expenditures were 1,441 million yen in FY2026/3 and are planned at 3,500 million yen in FY2027/3, with the materials citing the Tsukui High-Speed Press Plant streamlining and factory/office expansion. Depreciation and amortization was 2,109 million yen (2,050 million yen planned for FY2027/3) and R&D expenditures were 1,013 million yen (1,300 million yen planned). Cash flow from operating activities was 8,201 million yen, cash flow from investing activities was △1,881 million yen and cash flow from financing activities was △4,409 million yen; cash and cash equivalents stood at 36,662 million yen. On the balance sheet, total assets increased by 2,562 million yen to 125,424 million yen and the shareholders’ equity ratio rose from 68.0% to 69.0%.
This article is an analysis based on publicly available information and is not a recommendation to buy or sell any specific securities. Investment decisions are your own responsibility.
![[Obayashi] Investors’ Guide 2026 — The Complete 24-Article Breakdown](https://japan-equity.com/wp-content/uploads/2026/07/hub_cover-1024x1024.png)
![[Obayashi] IR & SR Policy — Feeding Dialogue Back into Management](https://japan-equity.com/wp-content/uploads/2026/07/p32_sq-1024x1024.jpg)
![[Obayashi] Real Estate Development — 18.7% Margin, ¥287.7bn Unrealized Gains](https://japan-equity.com/wp-content/uploads/2026/07/p20_sq-1024x1024.jpg)
![[Obayashi] Domestic Civil Engineering — Resilience Spending Supports 9.6% Margin](https://japan-equity.com/wp-content/uploads/2026/07/p11_sq-1024x1024.jpg)
![[Obayashi] Share Price & External Ratings — vs TOPIX, ESG Index Inclusion](https://japan-equity.com/wp-content/uploads/2026/07/p40_sq-1024x1024.jpg)
![[Construction] ¥75.5tn Investment, Shrinking Workforce — Big-5 Market Share](https://japan-equity.com/wp-content/uploads/2026/07/p12_sq-1024x1024.jpg)



![[Obayashi] Capital Policy & Shareholder Returns — ROE 10%+, DOE ~5%, ¥100bn Buyback](https://japan-equity.com/wp-content/uploads/2026/07/p27_sq-1024x1024.jpg)
![[Obayashi] Reducing Cross-Shareholdings — ¥285.2bn Sold in Five Years](https://japan-equity.com/wp-content/uploads/2026/07/p29_sq-1024x1024.jpg)
![[Obayashi] ¥750bn Investment Plan — ¥300bn to Development, ¥190bn to Tech/DX](https://japan-equity.com/wp-content/uploads/2026/07/p30_sq-1024x1024.jpg)
![[Obayashi] MTP2022 KPIs — Operating Profit ~2x Target, ROE 14.4%](https://japan-equity.com/wp-content/uploads/2026/07/p25_sq-1024x1024.jpg)
![[Obayashi] Cash Allocation — ¥420bn Investment CF Over Five Years](https://japan-equity.com/wp-content/uploads/2026/07/p26_sq-1024x1024.jpg)
![[Obayashi] Green Energy — 44 Plants, 344MW, and the Green Hydrogen Challenge](https://japan-equity.com/wp-content/uploads/2026/07/p21_sq-1024x1024.jpg)
![[Obayashi] Tackling the Labor Shortage — Robotics Construction®](https://japan-equity.com/wp-content/uploads/2026/07/p14_sq-1024x1024.jpg)
