
This article is based on publicly available IR materials and is not a recommendation to buy or sell any specific securities.
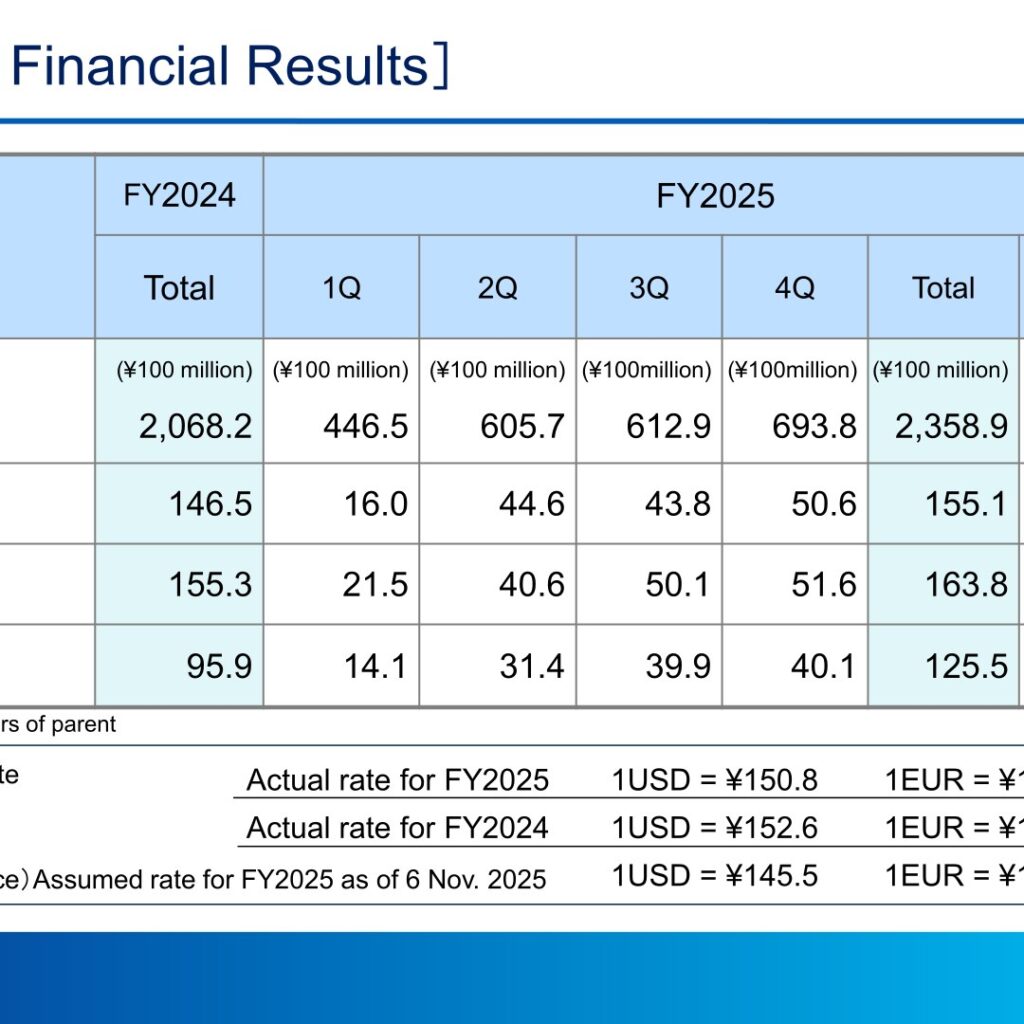
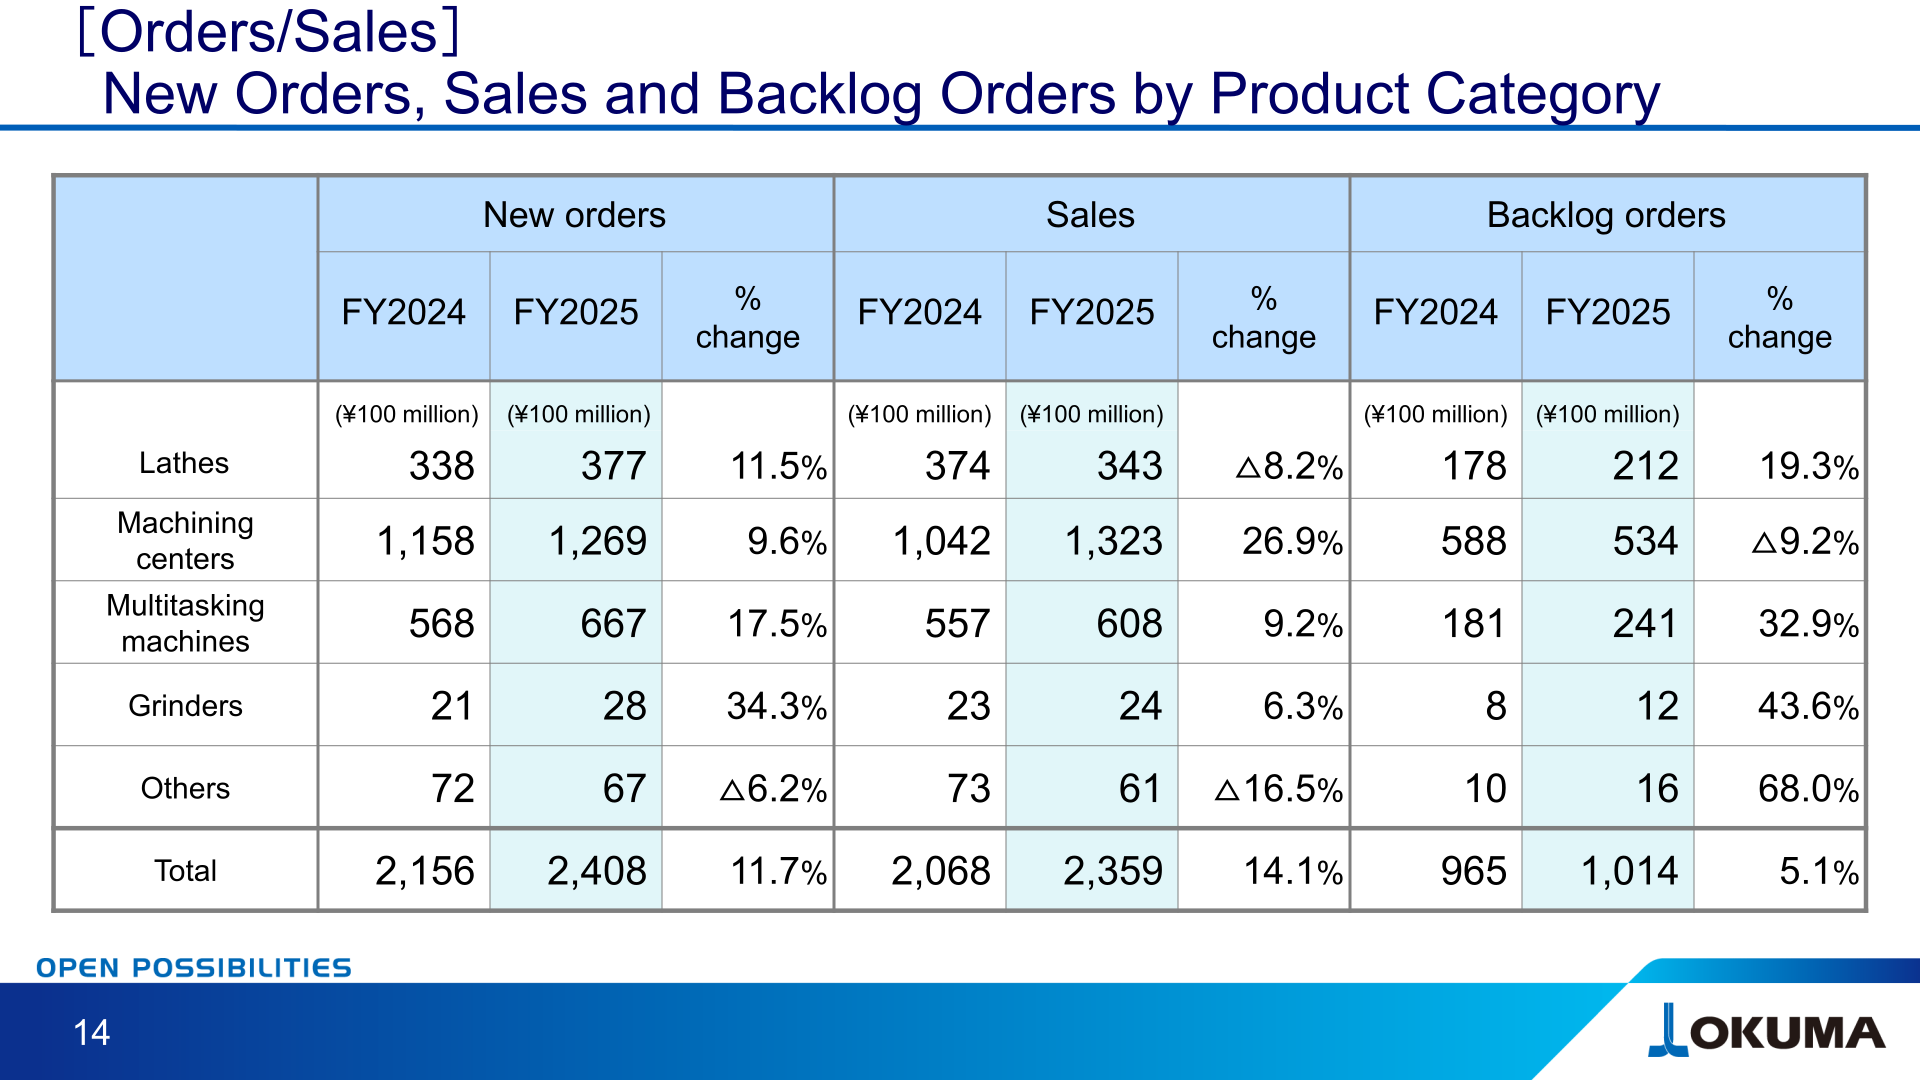
Okuma Corporation reported consolidated sales of 235.9 billion yen for fiscal year 2025, up 14.1% year-over-year and an all-time high, while consolidated operating income rose 5.8% to 15.5 billion yen for an operating income margin of 6.6%. Consolidated orders reached 240.8 billion yen, up 11.7% year-over-year, with second-half orders hitting a record high of 129.1 billion yen and backlog orders standing at 101.4 billion yen as of the end of March 2026. The company also achieved its “Global 70” goal of lifting the overseas sales percentage above 70 percent, reaching 73.3% in FY2025. Alongside the results, Okuma disclosed its Mid-term Management Plan 2028.
Consolidated Results (Full-Year Actual)
Sales increased as the company expanded production capacity for double-column machining centers and recorded a large order from a major EV manufacturer. On profits, the company worked to pass on increased costs and the burden of U.S. tariffs to sales prices, but rising component costs, persistently high transportation costs, and increased expenses related to strengthening human capital investments still weighed down profits. In the first half of FY2025 many orders had delivery dates in the second half, preventing a full recovery in factory operations; in the second half, with demand generally recovering, the company was able to ensure reliable production and shipment of its abundant order backlog. Net income attributable to owners of parent rose 30.9% to 125.5 (¥100 million). Results came in above the forecast figures published on November 6, 2025 (sales 2,200, operating income 140.0, ordinary income 145.0, net income 100.0, all in ¥100 million).
| Item (¥100 million) | FY2025 | FY2024 | % Change |
|---|---|---|---|
| Sales | 2,358.9 | 2,068.2 | 14.1% |
| Operating income | 155.1 | 146.5 | 5.8% |
| Ordinary income | 163.8 | 155.3 | 5.5% |
| Net income (attributable to owners of parent) | 125.5 | 95.9 | 30.9% |
The actual exchange rate for FY2025 was 1USD = ¥150.8 and 1EUR = ¥174.8, versus 1USD = ¥152.6 and 1EUR = ¥163.8 for FY2024. On the factors behind the change in operating income, the materials show revenue increase of 48 and benefits from streamlined operations of 1, against increased expenses, etc. of △17, human capital investment of △19 and influence of sales price and currency exchange rate of △5 (¥100 million; “△” indicates a negative impact).
Orders by Market Region
By region, the Americas market saw steady orders from aerospace, satellite, defense, data center, and energy sectors. The domestic market saw increased capital investment in various industries during the second half of the fiscal year. Demand in the European market remained weak, but it increased in the aircraft and defense sectors, and the Chinese market saw robust demand from general industrial machinery, semiconductor manufacturing equipment, and wind power generation. Orders with long lead times rose, resulting in a substantial order backlog.
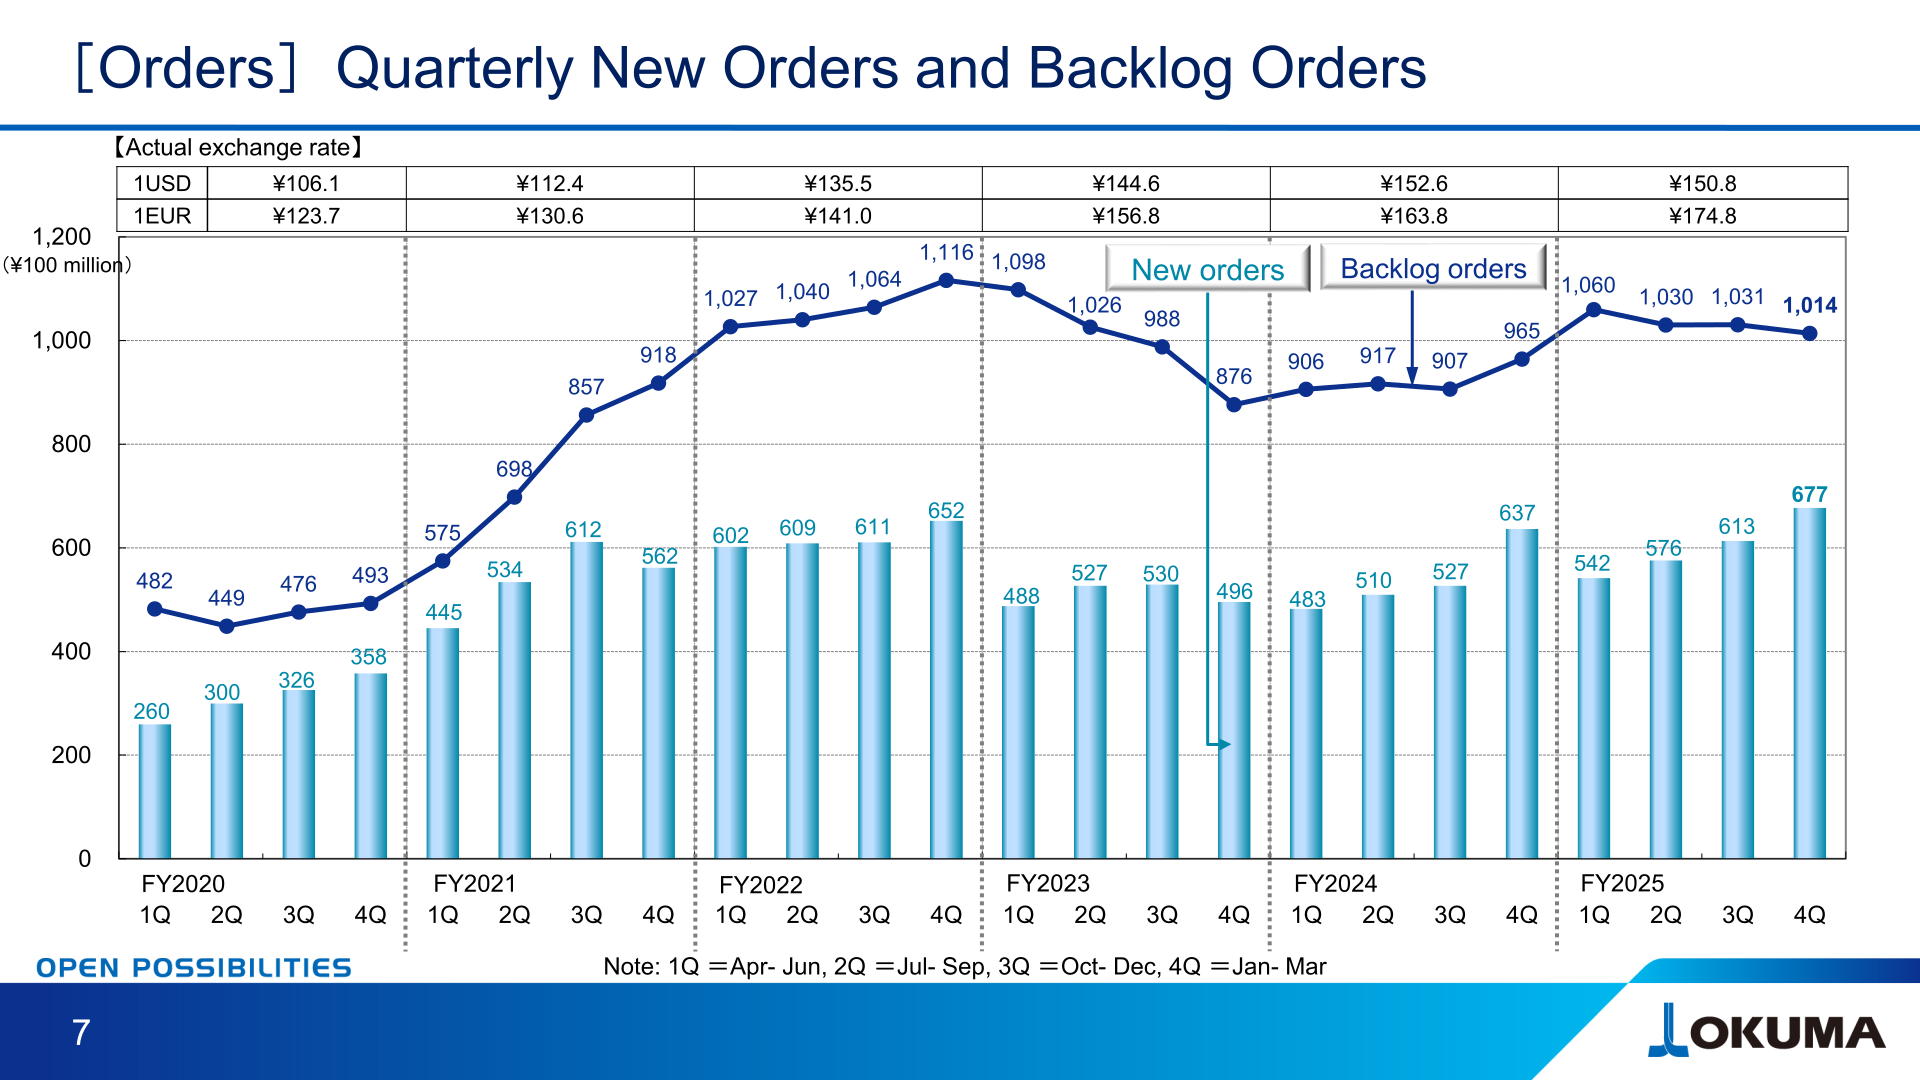
| Region (¥100 million) | New orders FY2024 | New orders FY2025 | New orders FY2026 (Forecast) | Sales FY2024 | Sales FY2025 | Sales FY2026 (Forecast) | Backlog FY2024 | Backlog FY2025 |
|---|---|---|---|---|---|---|---|---|
| Japan | 674 | 640 | 700 | 618 | 631 | 700 | 365 | 373 |
| Americas | 627 | 787 | 850 | 630 | 684 | 815 | 190 | 293 |
| Europe | 326 | 348 | 420 | 334 | 345 | 410 | 130 | 133 |
| Asia/Pacific | 529 | 634 | 530 | 487 | 699 | 525 | 280 | 216 |
| Total | 2,156 | 2,408 | 2,500 | 2,068 | 2,359 | 2,450 | 965 | 1,014 |
Orders and Sales by Product Category
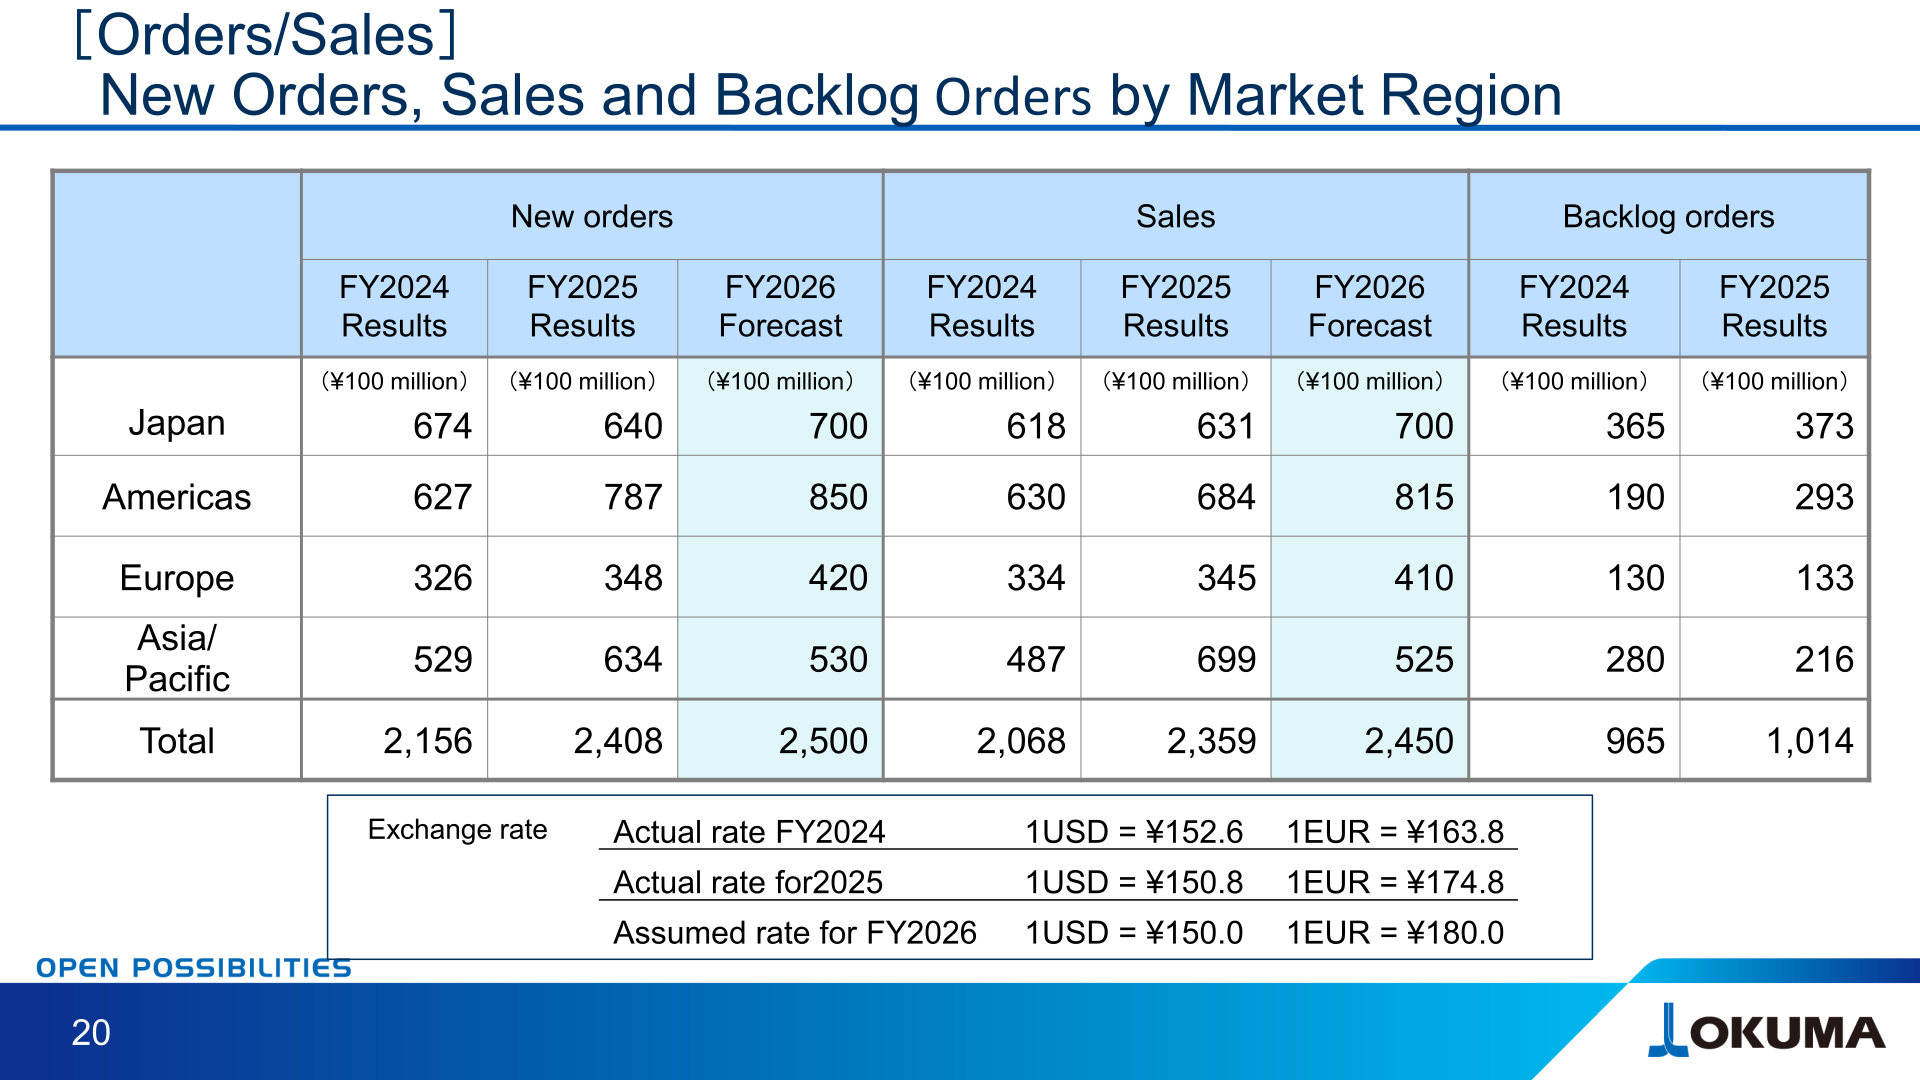
Machining centers, the largest product category, saw sales rise 26.9% to 1,323 (¥100 million) and new orders rise 9.6% to 1,269. Multitasking machines posted new orders of 667, up 17.5%, and backlog orders of 241, up 32.9%. Lathes recorded higher new orders but lower sales.
| Product category (¥100 million) | New orders FY2024 | New orders FY2025 | % change | Sales FY2024 | Sales FY2025 | % change | Backlog FY2024 | Backlog FY2025 | % change |
|---|---|---|---|---|---|---|---|---|---|
| Lathes | 338 | 377 | 11.5% | 374 | 343 | △8.2% | 178 | 212 | 19.3% |
| Machining centers | 1,158 | 1,269 | 9.6% | 1,042 | 1,323 | 26.9% | 588 | 534 | △9.2% |
| Multitasking machines | 568 | 667 | 17.5% | 557 | 608 | 9.2% | 181 | 241 | 32.9% |
| Grinders | 21 | 28 | 34.3% | 23 | 24 | 6.3% | 8 | 12 | 43.6% |
| Others | 72 | 67 | △6.2% | 73 | 61 | △16.5% | 10 | 16 | 68.0% |
| Total | 2,156 | 2,408 | 11.7% | 2,068 | 2,359 | 14.1% | 965 | 1,014 | 5.1% |
Financial Position and Cash Flows
Total assets grew from 2,982 (¥100 million) as of the end of March 2025 to 3,404 as of the end of March 2026, with inventories at 821, property, plant and equipment at 745 and cash and deposits at 530. Total shareholders’ equity rose from 2,381 to 2,559 and interest-bearing debt increased from 100 to 250. Net cash stood at ¥28.0 billion and the capital adequacy ratio at 72.0%. Cash flow from operating activities was 238 (¥100 million) versus 178 in FY2024, cash flow from investing activities was △292 versus △153, and cash flow from financing activities was 29 versus △35. Cash and cash equivalents at the end of the fiscal year were 478, compared with 483 a year earlier.
FY2026 Forecast
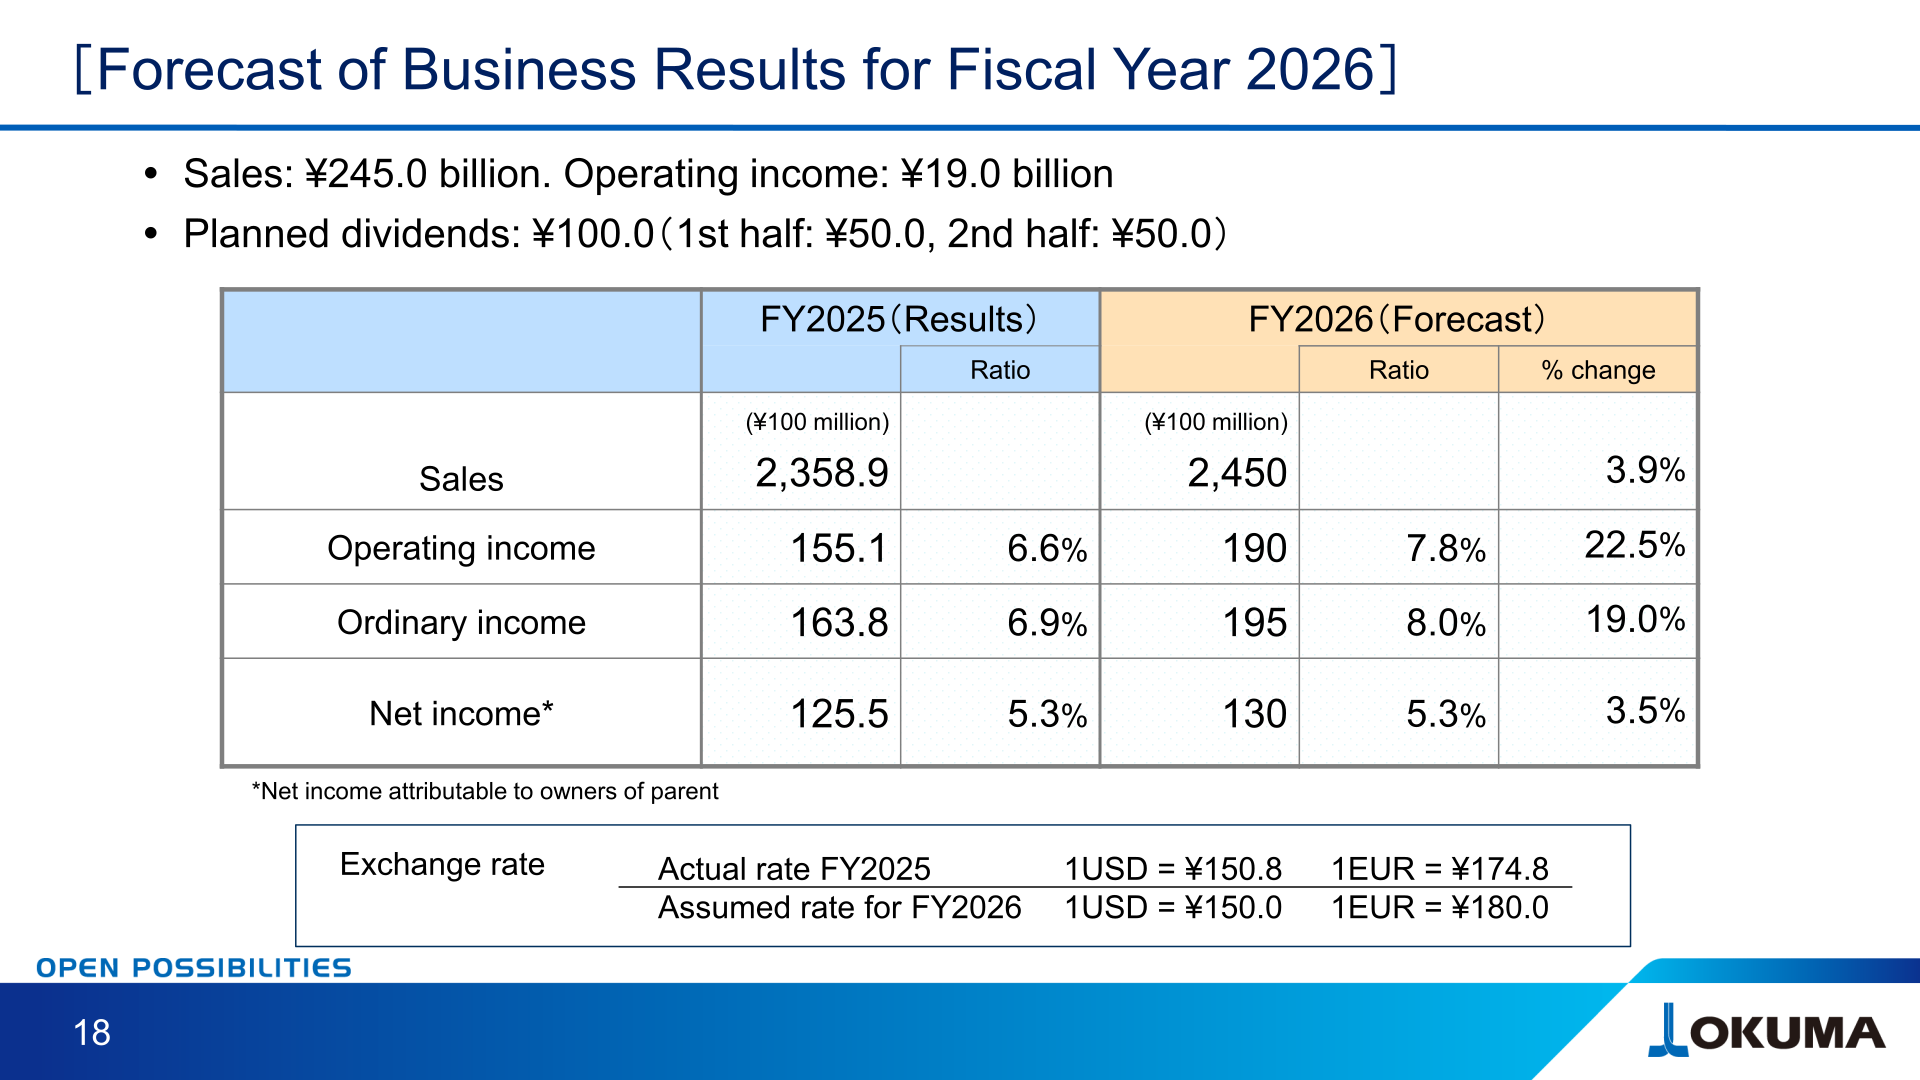
For fiscal year 2026, Okuma forecasts sales of ¥245.0 billion and operating income of ¥19.0 billion. The assumed exchange rate for FY2026 is 1USD = ¥150.0 and 1EUR = ¥180.0. New orders are planned at 2,500 (¥100 million), with the Americas at 850 and Europe at 420, while Asia/Pacific is planned at 530. On the factors behind the change in operating income, the materials show revenue increase of 73, improved influence of sales price and currency exchange rate of 23 and benefits from streamlined operations of 2, against increased expenses, etc. of △46 and human capital investment of △17 (¥100 million).
| Item (¥100 million) | FY2025 (Results) | Ratio | FY2026 (Forecast) | Ratio | % change |
|---|---|---|---|---|---|
| Sales | 2,358.9 | — | 2,450 | — | 3.9% |
| Operating income | 155.1 | 6.6% | 190 | 7.8% | 22.5% |
| Ordinary income | 163.8 | 6.9% | 195 | 8.0% | 19.0% |
| Net income (attributable to owners of parent) | 125.5 | 5.3% | 130 | 5.3% | 3.5% |
Shareholder Returns
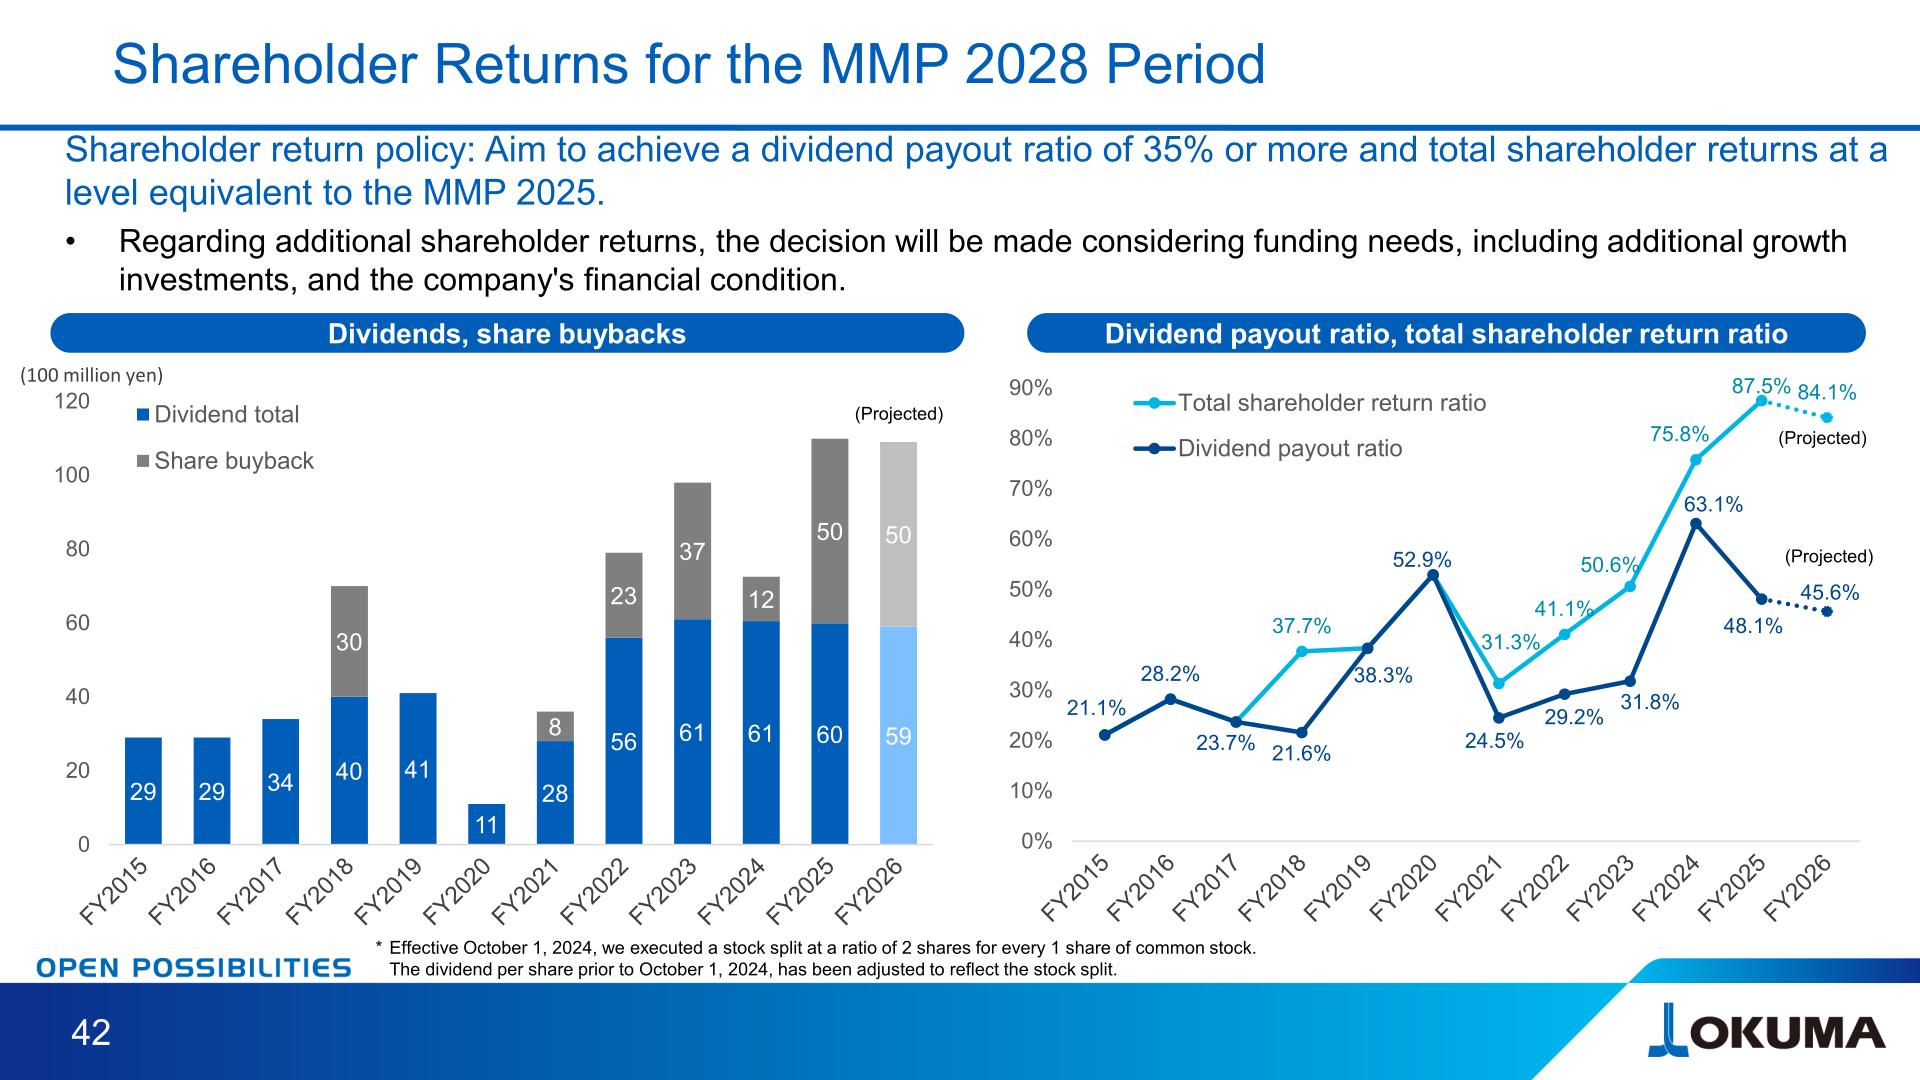
Planned dividends for FY2026 are ¥100.0 per share (1st half: ¥50.0, 2nd half: ¥50.0). Under the Mid-term Management Plan 2028, the shareholder return policy is to aim to achieve a dividend payout ratio of 35% or more and total shareholder returns at a level equivalent to the MMP 2025. Regarding additional shareholder returns, the decision will be made considering funding needs, including additional growth investments, and the company’s financial condition. Effective October 1, 2024, the company executed a stock split at a ratio of 2 shares for every 1 share of common stock, and the dividend per share prior to October 1, 2024 has been adjusted to reflect the stock split.
| Item | FY2024 | FY2025 | FY2026 (Projected) |
|---|---|---|---|
| Dividend total (¥100 million) | 61 | 60 | 59 |
| Share buyback (¥100 million) | 12 | 50 | 50 |
| Dividend payout ratio | 63.1% | 48.1% | 45.6% |
| Total shareholder return ratio | 75.8% | 87.5% | 84.1% |
Mid-term Management Plan
Reviewing the Mid-term Management Plan (MMP) 2025, sales rose from 227.6 billion yen in FY2022 to 235.9 billion yen in FY2025 against a goal of 250 billion yen, while the operating income margin fell from 10.9% to 6.6% against a goal of 13% to 15%, ROE fell from 9.9% to 5.3% against a goal of 10% or higher, and ROIC fell from 8.7% to 4.3%. The company states that key growth investments such as Dream Site Engineered Solutions and the Global Innovation Center were executed as planned, and that the Global 70 goal was achieved with an overseas sales percentage of 73.3% in FY2025. Dream Site Engineered Solutions was completed in January 2026 and the Global Innovation Center started operations in May 2026.
For the Mid-term Management Plan 2028, covering Phase 2 (FY2026 to FY2028) toward the 2030 Vision, the FY2028 targets are sales of 270 billion yen, an operating income margin of 11% or higher, and ROE of 8% or higher, with ROE positioned as the most important indicator. The FY2030 targets are sales of 300 billion yen, an operating income margin of 15% or higher, and ROE of 13% to 15%, together with achieving carbon neutrality in Scope 1 and Scope 2 on a consolidated basis. The plan is built on two pillars: customer-centric value creation and business foundation reform.
| Indicator | FY2025 results | FY2028 MMP targets |
|---|---|---|
| Sales | 235.9 billion yen | 270 billion yen |
| Operating income margin | 6.6% | 11% or higher |
| ROE | 5.3% | 8% or higher |
By region, the company plans sales in FY2028 of 70.0 billion yen in Japan (FY2025: 63.1 billion yen), 83.0 billion yen in the Americas (68.4 billion yen), 47.0 billion yen in Europe (34.5 billion yen) and 70.0 billion yen in Asia (69.9 billion yen). On cash allocation for the FY2026-2028 cumulative plan, the company assumes sales cash flow of 90 billion yen or more against investment of 42 billion yen or more and stockholder dividends of 22 billion yen or more. Planned investments total 420 (¥100 million) for FY2026-2028, comprising growth investments of 235, renewal investments of 110 and ESG investments of 75, versus cumulative results of 595 for FY2023-2025.
This article is an analysis based on publicly available information and is not a recommendation to buy or sell any specific securities. Investment decisions are your own responsibility.
![[Obayashi] Investors’ Guide 2026 — The Complete 24-Article Breakdown](https://japan-equity.com/wp-content/uploads/2026/07/hub_cover-1024x1024.png)
![[Obayashi] IR & SR Policy — Feeding Dialogue Back into Management](https://japan-equity.com/wp-content/uploads/2026/07/p32_sq-1024x1024.jpg)
![[Obayashi] Domestic Civil Engineering — Resilience Spending Supports 9.6% Margin](https://japan-equity.com/wp-content/uploads/2026/07/p11_sq-1024x1024.jpg)
![[Obayashi] Overseas Construction — Orders Reach ¥1.2tn](https://japan-equity.com/wp-content/uploads/2026/07/p15_sq-1024x1024.jpg)
![[Obayashi] Share Price & External Ratings — vs TOPIX, ESG Index Inclusion](https://japan-equity.com/wp-content/uploads/2026/07/p40_sq-1024x1024.jpg)
![[Construction] ¥75.5tn Investment, Shrinking Workforce — Big-5 Market Share](https://japan-equity.com/wp-content/uploads/2026/07/p12_sq-1024x1024.jpg)



![[Obayashi] Capital Policy & Shareholder Returns — ROE 10%+, DOE ~5%, ¥100bn Buyback](https://japan-equity.com/wp-content/uploads/2026/07/p27_sq-1024x1024.jpg)
![[Obayashi] Reducing Cross-Shareholdings — ¥285.2bn Sold in Five Years](https://japan-equity.com/wp-content/uploads/2026/07/p29_sq-1024x1024.jpg)
![[Obayashi] ¥750bn Investment Plan — ¥300bn to Development, ¥190bn to Tech/DX](https://japan-equity.com/wp-content/uploads/2026/07/p30_sq-1024x1024.jpg)
![[Obayashi] MTP2022 KPIs — Operating Profit ~2x Target, ROE 14.4%](https://japan-equity.com/wp-content/uploads/2026/07/p25_sq-1024x1024.jpg)
![[Obayashi] Cash Allocation — ¥420bn Investment CF Over Five Years](https://japan-equity.com/wp-content/uploads/2026/07/p26_sq-1024x1024.jpg)
![[Obayashi] Green Energy — 44 Plants, 344MW, and the Green Hydrogen Challenge](https://japan-equity.com/wp-content/uploads/2026/07/p21_sq-1024x1024.jpg)
![[Obayashi] Tackling the Labor Shortage — Robotics Construction®](https://japan-equity.com/wp-content/uploads/2026/07/p14_sq-1024x1024.jpg)
