
This article is based on publicly available IR materials and is not a recommendation to buy or sell any specific securities.
Note: Tsugami’s presentation labels the fiscal year ended March 31, 2026 as “FY 2026/3” and the year ending March 31, 2027 as “FY 2027/3”. This article follows the site convention of “FY2025” in the title and slug, while the body text, tables and image captions keep the company’s own labels exactly as printed in the materials.
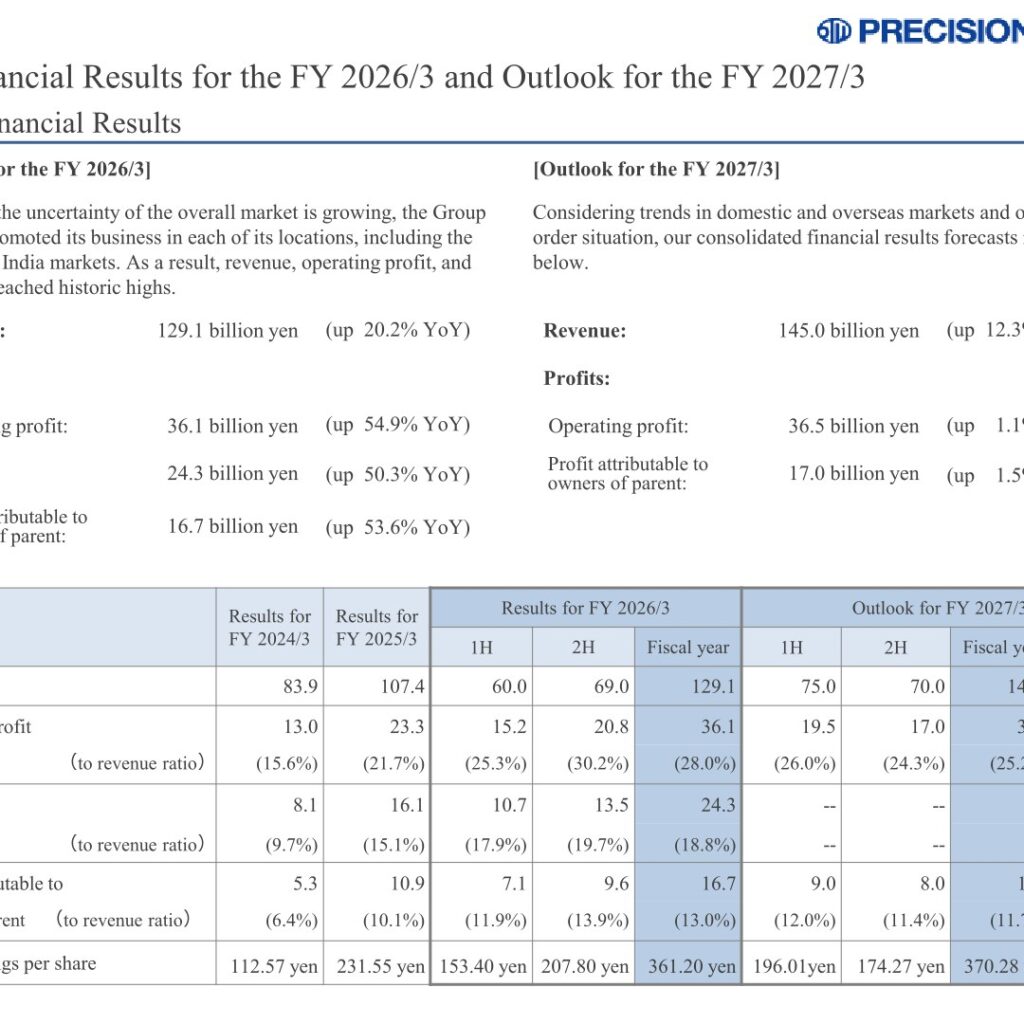
Tsugami Corporation reported revenue of 129.1 billion yen for FY 2026/3, up 20.2% year on year, with operating profit of 36.1 billion yen (up 54.9%) and profit attributable to owners of parent of 16.7 billion yen (up 53.6%). The company states that although the uncertainty of the overall market is growing, the Group steadily promoted its business in each of its locations, including the China and India markets, and that as a result revenue, operating profit and profit all reached historic highs. For FY 2027/3 the company forecasts revenue of 145.0 billion yen (up 12.3%) and operating profit of 36.5 billion yen (up 1.1%).
Consolidated Results (FY 2026/3 Actual)
Revenue rose to 129.1 billion yen from 107.4 billion yen in FY 2025/3, and the operating profit margin improved to 28.0% from 21.7%. Basic earnings per share were 361.20 yen against 231.55 yen a year earlier. By half, revenue was 60.0 billion yen in 1H and 69.0 billion yen in 2H, with operating profit of 15.2 billion yen and 20.8 billion yen respectively.
| Item (Billion yen) | FY 2026/3 | FY 2025/3 | YoY |
|---|---|---|---|
| Revenue | 129.1 | 107.4 | up 20.2% |
| Operating profit | 36.1 | 23.3 | up 54.9% |
| (to revenue ratio) | (28.0%) | (21.7%) | — |
| Profit | 24.3 | 16.1 | up 50.3% |
| (to revenue ratio) | (18.8%) | (15.1%) | — |
| Profit attributable to owners of parent | 16.7 | 10.9 | up 53.6% |
| (to revenue ratio) | (13.0%) | (10.1%) | — |
| Basic earnings per share | 361.20 yen | 231.55 yen | — |
On the balance sheet, total assets stood at 154.0 billion yen as of March 31, 2026, up 26.7 billion yen from a year earlier, with cash and cash equivalents of 42.1 billion yen (up 14.4 billion yen) and total equity of 106.4 billion yen (up 22.3 billion yen). The company describes its financial position as stable, citing a ratio of equity attributable to owners of parent of 52.0% and a ratio of total equity for the entire group of 69.1%. Cash flows from operating activities were 28.6 billion yen versus 8.8 billion yen in FY 2025/3, while investing activities used 2.0 billion yen and financing activities used 15.9 billion yen.
Revenue by Geographic Segment
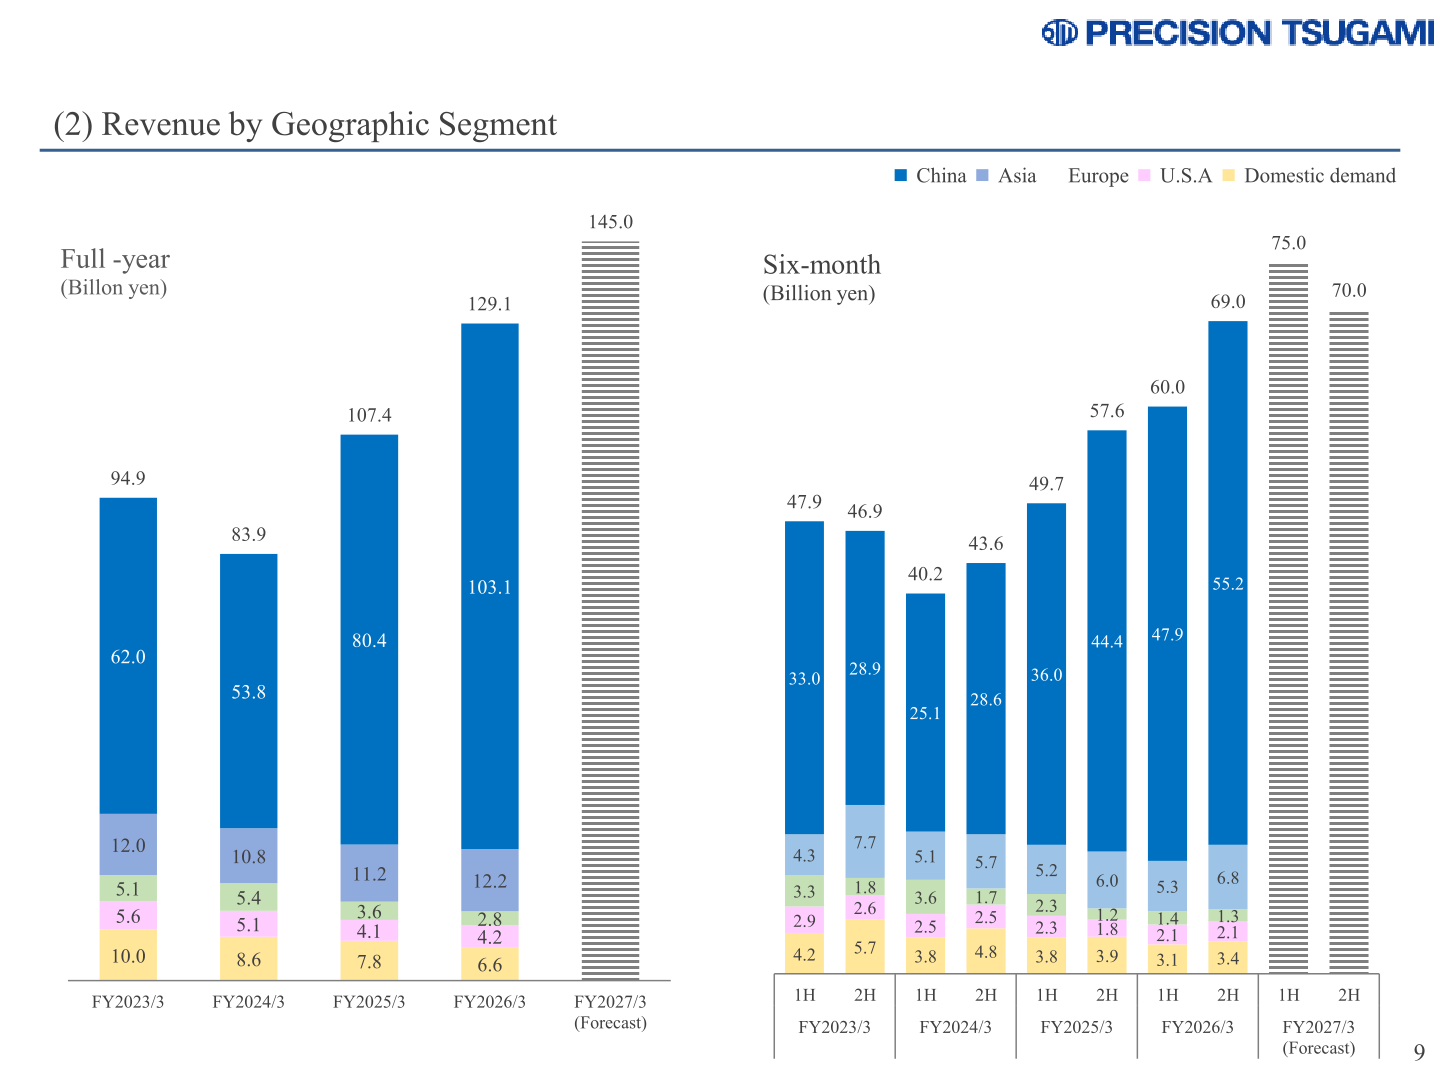
China remained by far the largest market, at 103.1 billion yen in FY 2026/3 against 80.4 billion yen in FY 2025/3. Asia rose to 12.2 billion yen, while Europe, the U.S.A and domestic demand were broadly flat or lower.
| Geographic segment (Billion yen) | FY 2026/3 | FY 2025/3 |
|---|---|---|
| China | 103.1 | 80.4 |
| Asia | 12.2 | 11.2 |
| Europe | 2.8 | 3.6 |
| U.S.A | 4.2 | 4.1 |
| Domestic demand | 6.6 | 7.8 |
| Total revenue | 129.1 | 107.4 |
Revenue by Machinery Category
Automatic lathes, the company’s core product line, accounted for 108.6 billion yen of FY 2026/3 revenue, up from 90.2 billion yen. Machining centers, thread rolling machines and specialized machines rose to 8.8 billion yen.
| Machinery category (Billion yen) | FY 2026/3 | FY 2025/3 |
|---|---|---|
| Automatic lathes | 108.6 | 90.2 |
| Grinding machines | 5.5 | 5.1 |
| Machining centers, Thread Rolling machines and specialized machines | 8.8 | 6.8 |
| Other | 6.1 | 5.1 |
| Total revenue | 129.1 | 107.4 |
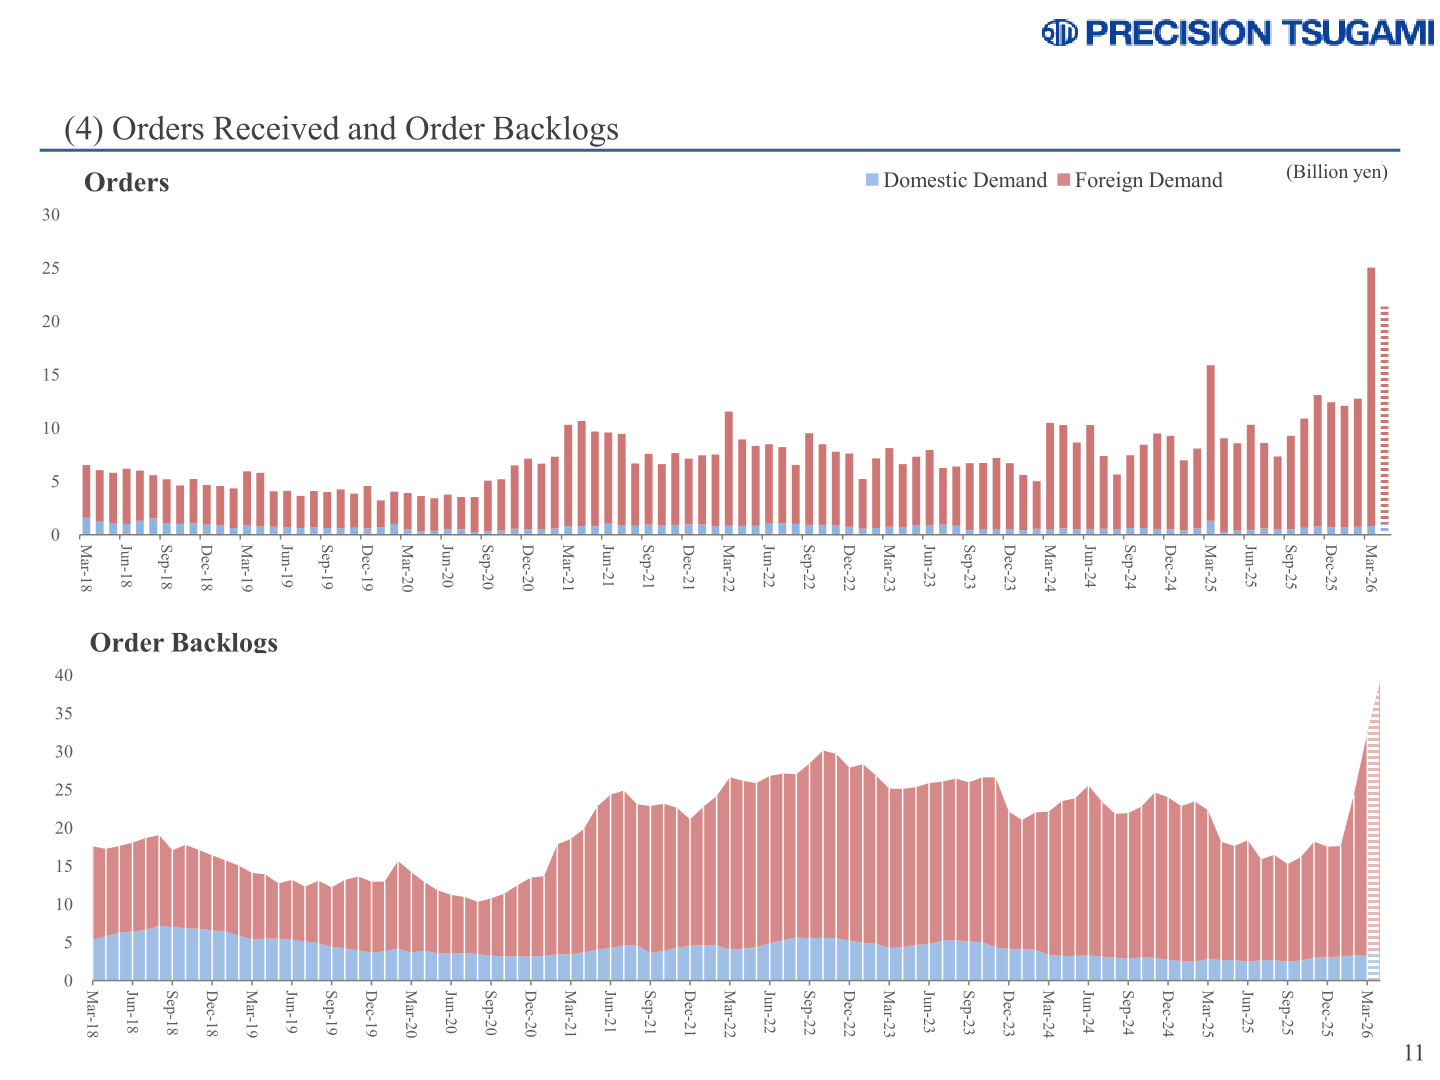
The materials also present monthly orders received and order backlogs from Mar-18 to Mar-26, split between domestic demand and foreign demand. No figures are labeled on these charts, so specific amounts cannot be confirmed from the materials.
FY 2027/3 Forecast
Considering trends in domestic and overseas markets and its current order situation, Tsugami forecasts revenue of 145.0 billion yen and operating profit of 36.5 billion yen for FY 2027/3, with profit attributable to owners of parent of 17.0 billion yen and basic earnings per share of 370.28 yen. A forecast for “Profit” is not given in the materials.
| Item (Billion yen) | FY 2027/3 1H | FY 2027/3 2H | FY 2027/3 Fiscal year | YoY |
|---|---|---|---|---|
| Revenue | 75.0 | 70.0 | 145.0 | 12.3% |
| Operating profit | 19.5 | 17.0 | 36.5 | 1.1% |
| (to revenue ratio) | (26.0%) | (24.3%) | (25.2%) | — |
| Profit attributable to owners of parent | 9.0 | 8.0 | 17.0 | 1.5% |
| (to revenue ratio) | (12.0%) | (11.4%) | (11.7%) | — |
| Basic earnings per share | 196.01yen | 174.27 yen | 370.28 yen | — |
Shareholder Returns
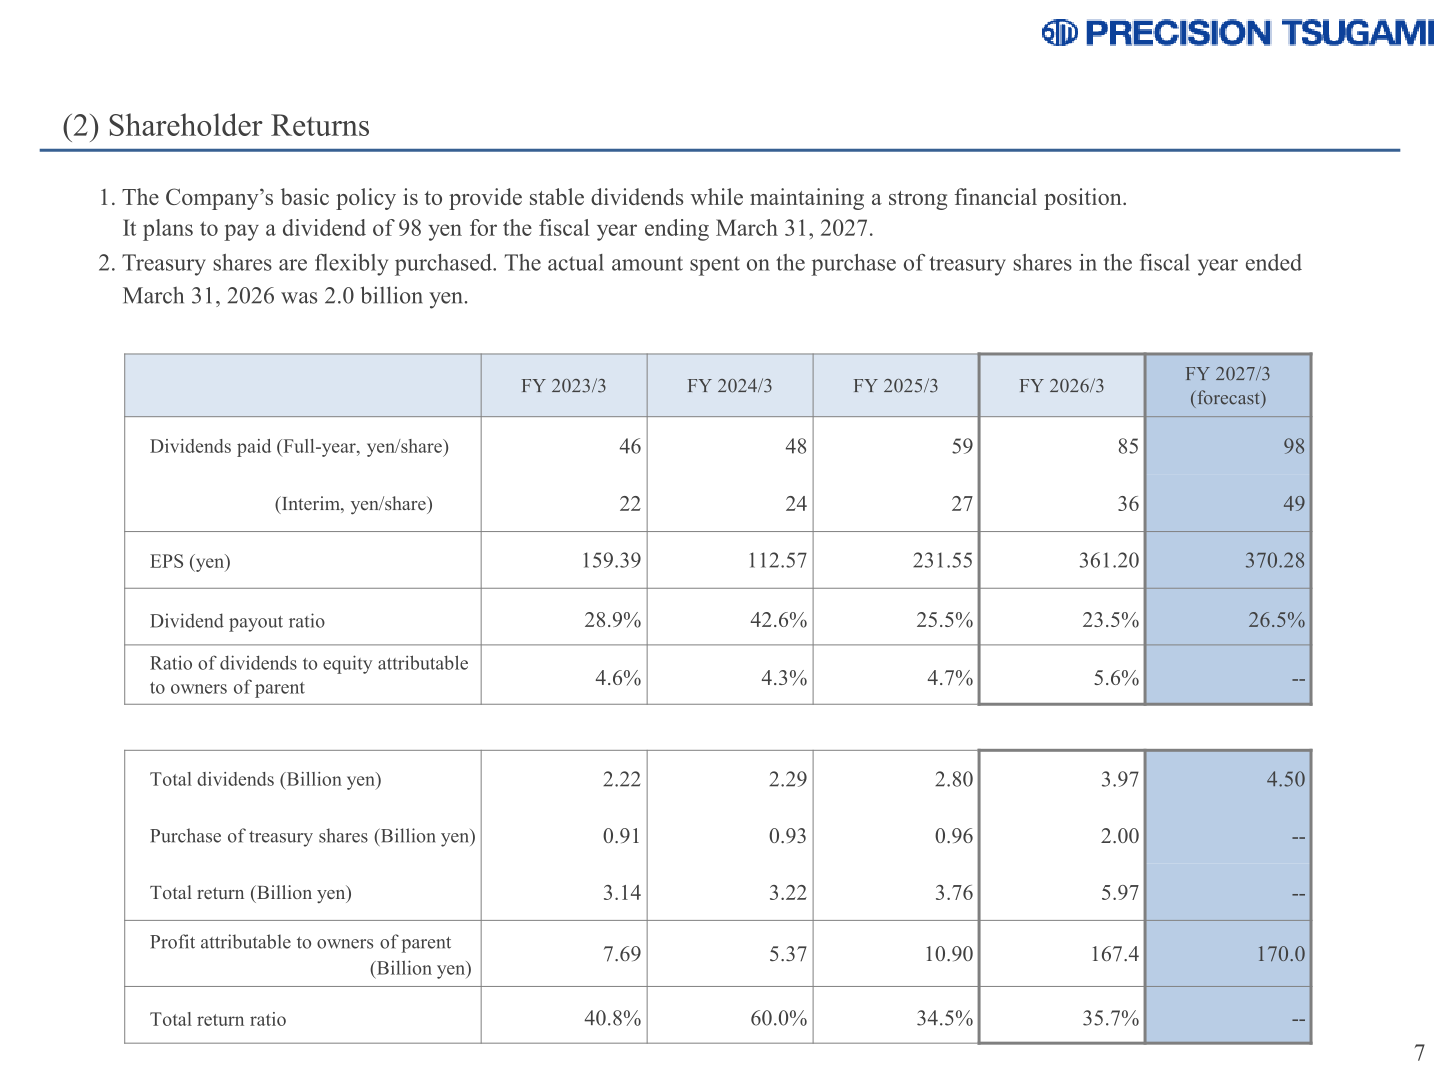
The company’s basic policy is to provide stable dividends while maintaining a strong financial position, and it plans to pay a dividend of 98 yen for the fiscal year ending March 31, 2027. The full-year dividend for FY 2026/3 was 85 yen per share, up from 59 yen, giving a payout ratio of 23.5%. Treasury shares are flexibly purchased; the actual amount spent on the purchase of treasury shares in the fiscal year ended March 31, 2026 was 2.0 billion yen, taking total returns to 5.97 billion yen and the total return ratio to 35.7%.
| Item | FY 2025/3 | FY 2026/3 | FY 2027/3 (forecast) |
|---|---|---|---|
| Dividends paid (Full-year, yen/share) | 59 | 85 | 98 |
| (Interim, yen/share) | 27 | 36 | 49 |
| EPS (yen) | 231.55 | 361.20 | 370.28 |
| Dividend payout ratio | 25.5% | 23.5% | 26.5% |
| Ratio of dividends to equity attributable to owners of parent | 4.7% | 5.6% | — |
| Total dividends (Billion yen) | 2.80 | 3.97 | 4.50 |
| Purchase of treasury shares (Billion yen) | 0.96 | 2.00 | — |
| Total return (Billion yen) | 3.76 | 5.97 | — |
| Total return ratio | 34.5% | 35.7% | — |
Key Indicators
Book-value per share (excluding treasury shares) reached 1,719 yen as of March 31, 2026, and return on equity was 23% for FY 2026/3 against 18% for FY 2025/3. Issued shares stood at 48,000 thousand shares and treasury shares at 1,498 thousand shares as of April 30, 2026.
Capital Investment, R&D and Topics
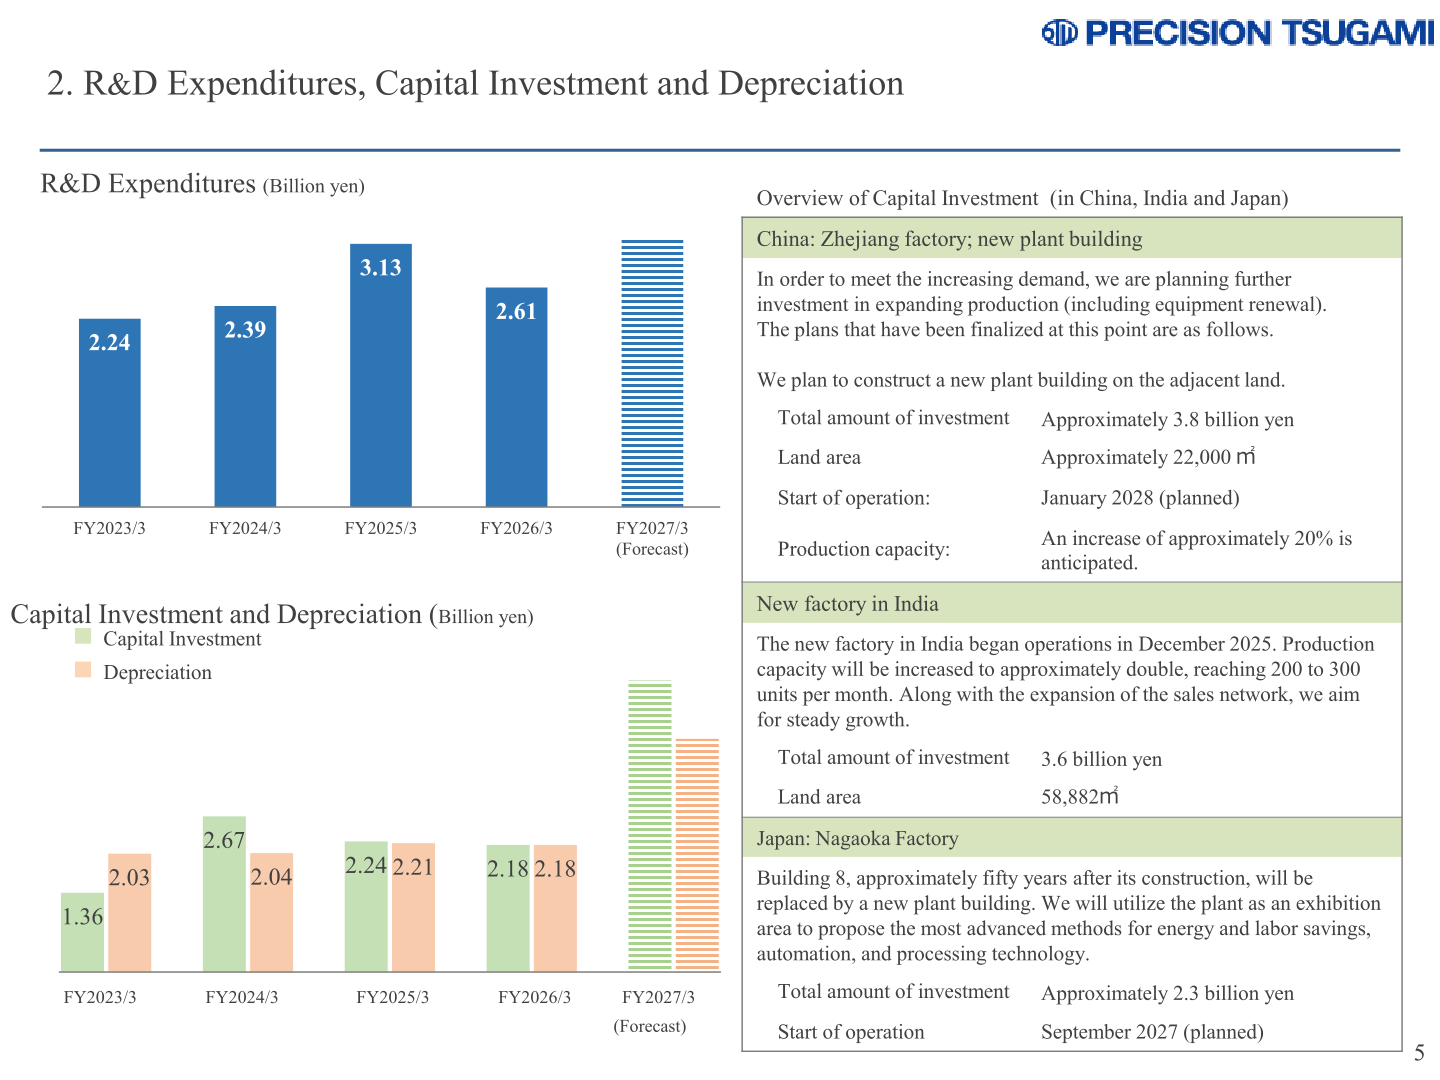
R&D expenditures were 2.61 billion yen in FY 2026/3 against 3.13 billion yen in FY 2025/3. Capital investment was 2.18 billion yen and depreciation 2.18 billion yen. The company says cash and cash equivalents as well as trade receivables are planned to be allocated to investment in production increase (including equipment renewal investment) and to expansion and strengthening of the supply chain.
Three capital investment projects are outlined. In China, a new plant building is planned on land adjacent to the Zhejiang factory, with a total investment of approximately 3.8 billion yen, land area of approximately 22,000 ㎡, start of operation in January 2028 (planned) and an anticipated production capacity increase of approximately 20%. In India, the new factory began operations in December 2025, with production capacity to be increased to approximately double, reaching 200 to 300 units per month; total investment is 3.6 billion yen on a land area of 58,882㎡. In Japan, Building 8 at the Nagaoka Factory, approximately fifty years after its construction, will be replaced by a new plant building to be used as an exhibition area, with a total investment of approximately 2.3 billion yen and start of operation in September 2027 (planned).
This article is an analysis based on publicly available information and is not a recommendation to buy or sell any specific securities. Investment decisions are your own responsibility.
![[Obayashi] Investors’ Guide 2026 — The Complete 24-Article Breakdown](https://japan-equity.com/wp-content/uploads/2026/07/hub_cover-1024x1024.png)
![[Obayashi] IR & SR Policy — Feeding Dialogue Back into Management](https://japan-equity.com/wp-content/uploads/2026/07/p32_sq-1024x1024.jpg)
![[Obayashi] Domestic Civil Engineering — Resilience Spending Supports 9.6% Margin](https://japan-equity.com/wp-content/uploads/2026/07/p11_sq-1024x1024.jpg)
![[Obayashi] Overseas Construction — Orders Reach ¥1.2tn](https://japan-equity.com/wp-content/uploads/2026/07/p15_sq-1024x1024.jpg)
![[Obayashi] Share Price & External Ratings — vs TOPIX, ESG Index Inclusion](https://japan-equity.com/wp-content/uploads/2026/07/p40_sq-1024x1024.jpg)
![[Construction] ¥75.5tn Investment, Shrinking Workforce — Big-5 Market Share](https://japan-equity.com/wp-content/uploads/2026/07/p12_sq-1024x1024.jpg)



![[Obayashi] Capital Policy & Shareholder Returns — ROE 10%+, DOE ~5%, ¥100bn Buyback](https://japan-equity.com/wp-content/uploads/2026/07/p27_sq-1024x1024.jpg)
![[Obayashi] Reducing Cross-Shareholdings — ¥285.2bn Sold in Five Years](https://japan-equity.com/wp-content/uploads/2026/07/p29_sq-1024x1024.jpg)
![[Obayashi] ¥750bn Investment Plan — ¥300bn to Development, ¥190bn to Tech/DX](https://japan-equity.com/wp-content/uploads/2026/07/p30_sq-1024x1024.jpg)
![[Obayashi] MTP2022 KPIs — Operating Profit ~2x Target, ROE 14.4%](https://japan-equity.com/wp-content/uploads/2026/07/p25_sq-1024x1024.jpg)
![[Obayashi] Cash Allocation — ¥420bn Investment CF Over Five Years](https://japan-equity.com/wp-content/uploads/2026/07/p26_sq-1024x1024.jpg)
![[Obayashi] Green Energy — 44 Plants, 344MW, and the Green Hydrogen Challenge](https://japan-equity.com/wp-content/uploads/2026/07/p21_sq-1024x1024.jpg)
![[Obayashi] Tackling the Labor Shortage — Robotics Construction®](https://japan-equity.com/wp-content/uploads/2026/07/p14_sq-1024x1024.jpg)
