
This article is based on publicly available IR materials and is not a recommendation to buy or sell any specific securities.
ELAN Corporation, which rents daily-necessity “CS Set” packages to inpatients at hospitals and residents at nursing care facilities on a fixed daily-rate basis, reported net sales of 55,448 million yen and operating profit of 4,272 million yen for fiscal 2025, the year ended December 31, 2025. The company describes the year as one of increased net sales and higher operating profit, citing net sales growth of 16.7% year on year and operating profit growth of 19.5% year on year, with an operating profit to net sales ratio of 7.7%. Both figures nevertheless came in below the company’s own forecast issued on February 10, 2025. Alongside the results, ELAN announced a new Mid-Term Management Plan covering 2026 to 2028.
Consolidated Results (Full-Year Actual)
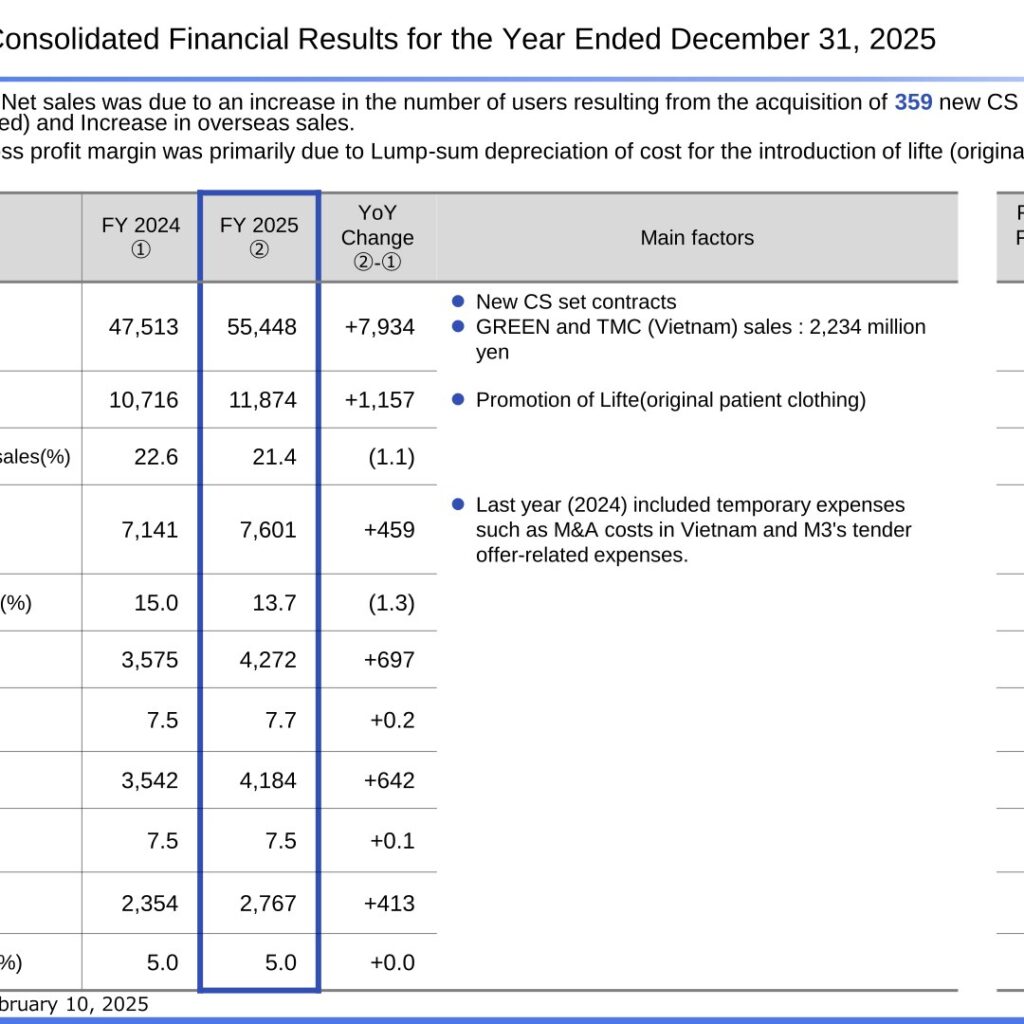
Net sales rose 7,934 million yen year on year. The company attributes the increase to a higher number of users following the acquisition of 359 new CS set contracts (99 facilities cancelled) and to an increase in overseas sales, with GREEN and TMC (Vietnam) sales of 2,234 million yen. Gross profit rose 1,157 million yen, but the gross profit to net sales ratio fell to 21.4%, which the company attributes primarily to lump-sum depreciation of the cost of introducing lifte (original patient clothing) at 219 facilities. SG&A rose 459 million yen; the company notes that the previous year (2024) included temporary expenses such as M&A costs in Vietnam and M3’s tender offer-related expenses. Against the FY2025 forecast, net sales came in 3,551 million yen lower, operating profit 447 million yen lower, ordinary profit 555 million yen lower and profit attributable to owners of parent 322 million yen lower.
| Item (Millions of yen) | FY 2024 | FY 2025 | YoY Change | FY 2025 Forecast | To forecast |
|---|---|---|---|---|---|
| Net sales | 47,513 | 55,448 | +7,934 | 59,000 | (3,551) |
| Gross profit | 10,716 | 11,874 | +1,157 | - | - |
| Gross profit to net sales(%) | 22.6 | 21.4 | (1.1) | - | - |
| SG&A | 7,141 | 7,601 | +459 | - | - |
| SG&A to net sales(%) | 15.0 | 13.7 | (1.3) | - | - |
| Operating profit | 3,575 | 4,272 | +697 | 4,720 | (447) |
| Operating profit to net sales(%) | 7.5 | 7.7 | +0.2 | 8.0% | (0.3) |
| Ordinary profit | 3,542 | 4,184 | +642 | 4,740 | (555) |
| Ordinary profit to net sales(%) | 7.5 | 7.5 | +0.1 | 8.0% | (0.5) |
| Profit Attributable to Owners of Parent | 2,354 | 2,767 | +413 | 3,090 | (322) |
| Profit to net sales(%) | 5.0 | 5.0 | +0.0 | 5.2% | (0.2) |
The FY2025 forecast column is the forecast as of February 10, 2025. On the balance sheet, the consolidation of the Vietnamese subsidiaries GREEN and TMC affected tangible fixed assets, goodwill and borrowings. Total assets increased 4,529 million yen to 26,232 million yen, goodwill increased 838 million yen to 1,266 million yen with the addition of TMC (Vietnam), total liabilities increased 2,350 million yen to 11,550 million yen and total net assets increased 2,179 million yen to 14,681 million yen. Goodwill for FY2024 has been retrospectively adjusted from 813 million yen to 427 million yen under the purchase price allocation.
Segment Results (Domestic / Overseas)
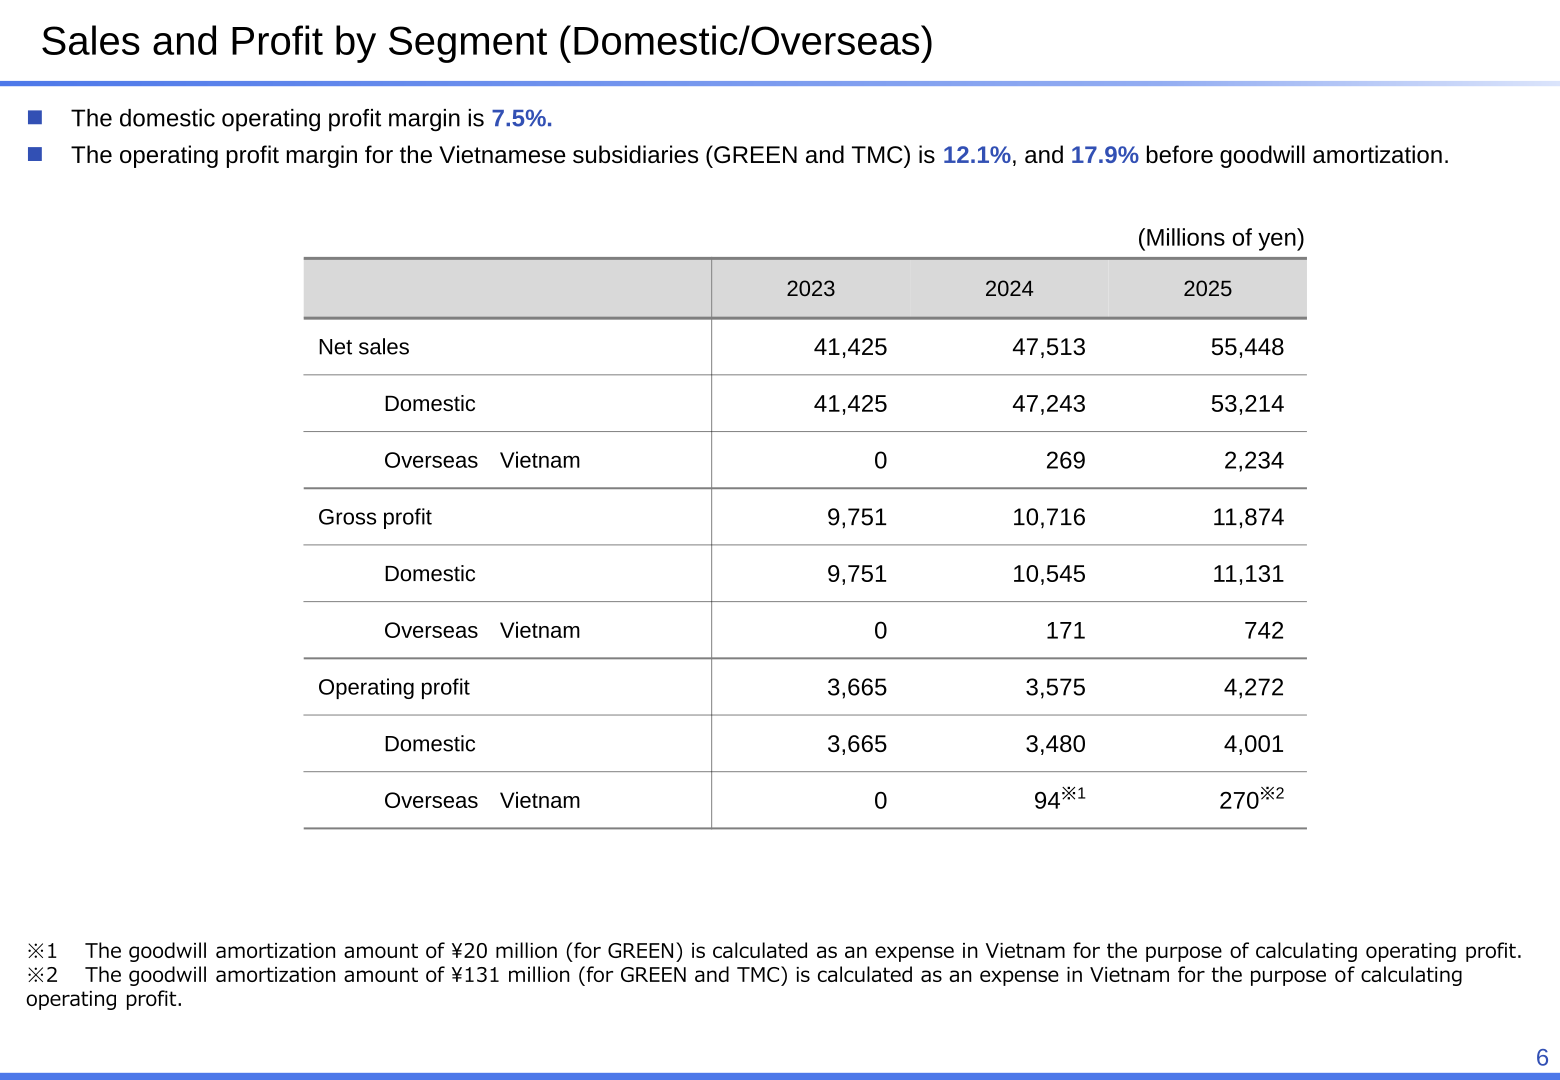
ELAN presents its results split between domestic operations and overseas (Vietnam) operations. The domestic operating profit margin is 7.5%. The operating profit margin for the Vietnamese subsidiaries GREEN and TMC is 12.1%, and 17.9% before goodwill amortization. Goodwill amortization of 131 million yen for GREEN and TMC is treated as an expense in Vietnam for the purpose of calculating operating profit in FY2025 (20 million yen for GREEN in FY2024).
| Item (Millions of yen) | 2023 | 2024 | 2025 |
|---|---|---|---|
| Net sales | 41,425 | 47,513 | 55,448 |
| Net sales — Domestic | 41,425 | 47,243 | 53,214 |
| Net sales — Overseas Vietnam | 0 | 269 | 2,234 |
| Gross profit | 9,751 | 10,716 | 11,874 |
| Gross profit — Domestic | 9,751 | 10,545 | 11,131 |
| Gross profit — Overseas Vietnam | 0 | 171 | 742 |
| Operating profit | 3,665 | 3,575 | 4,272 |
| Operating profit — Domestic | 3,665 | 3,480 | 4,001 |
| Operating profit — Overseas Vietnam | 0 | 94 | 270 |
Key Operating Indicators
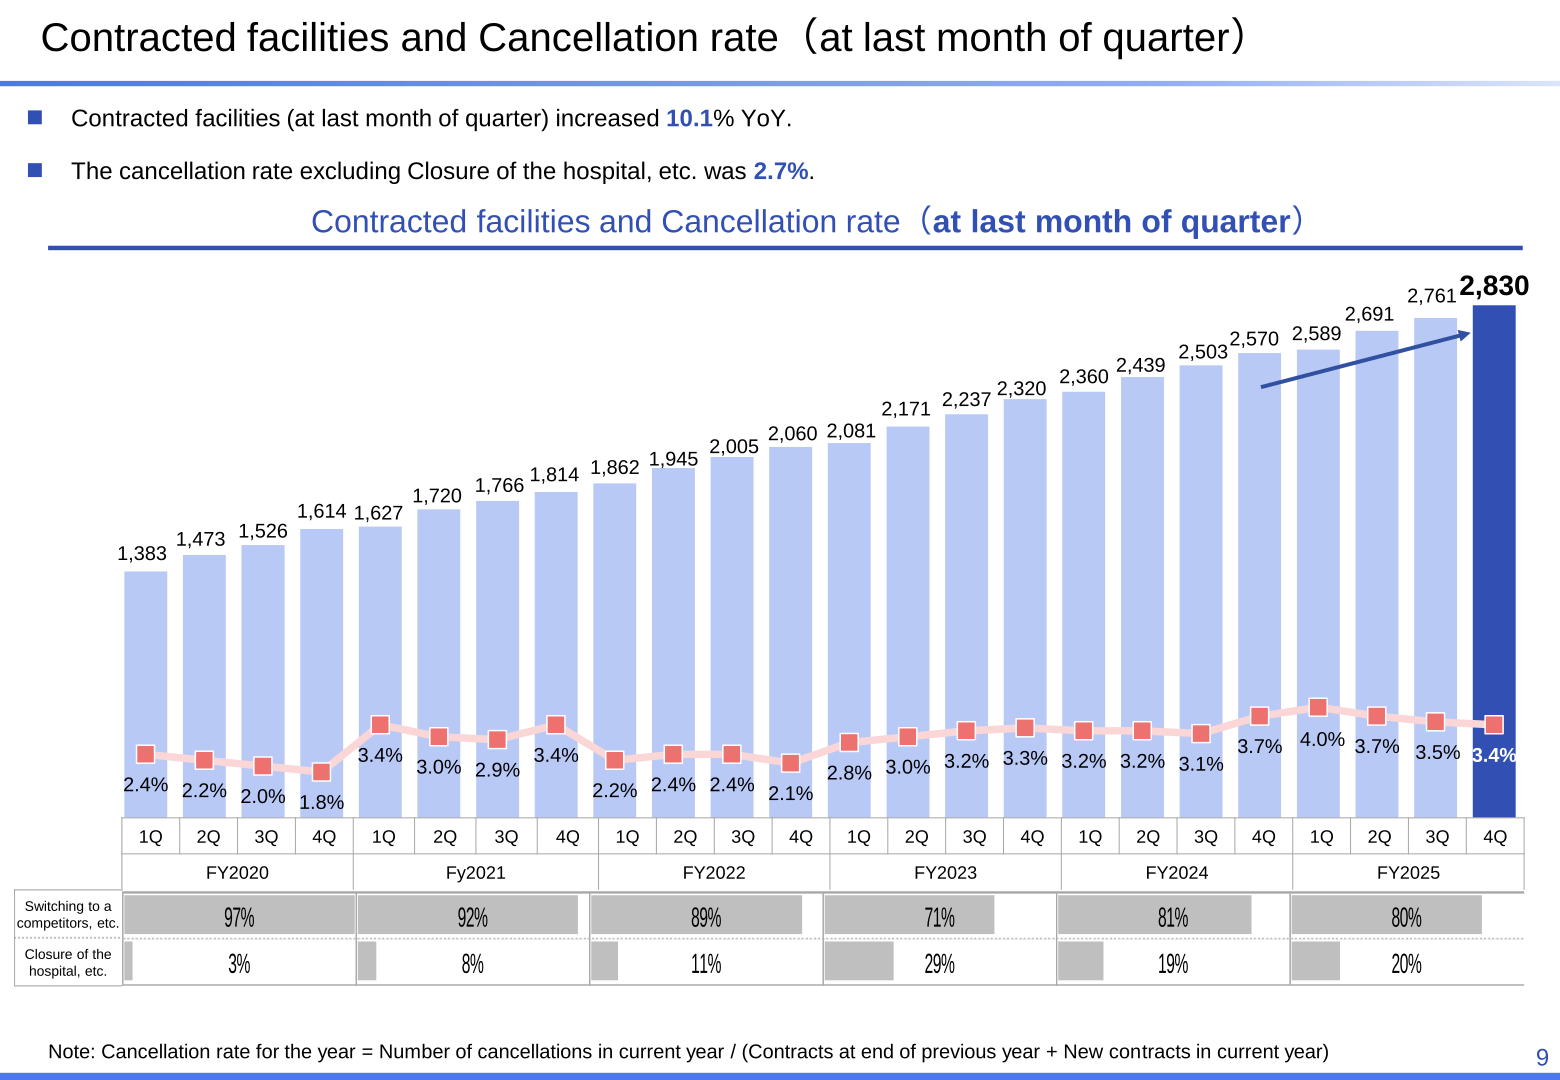
Contracted facilities at the last month of the quarter reached 2,830, an increase of 10.1% year on year. The cancellation rate for FY2025 was 3.4%, and the cancellation rate excluding closure of the hospital, etc. was 2.7%. Monthly users, averaged during the period, increased 7.2% year on year to 491,056 in the fourth quarter. Facility unit price continued to rise to 18.8 million yen, which the company attributes to the spread of new services. Adoption of peripheral services also advanced: lifte was in place at 471 facilities (adoption rate 16.6%), CS Set R at 354 facilities (12.5%), CS Set LC at 285 facilities (10.1%) and Smile wear at 65 facilities (2.3%), while the number of achievements from the synergy with M3 was 100. ELAN opened its Kobe Branch on December 1, 2025.
| Indicator | Unit | 2021 | 2022 | 2023 | 2024 | 2025 |
|---|---|---|---|---|---|---|
| Net sales | Millions of yen | 31,635 | 36,264 | 41,425 | 47,243 | 53,214 |
| Net sales year on year | % | 21.4% | 14.6% | 14.2% | 14.0% | 12.6% |
| Contracted facilities | Facility | 1,814 | 2,060 | 2,320 | 2,570 | 2,830 |
| Contracted facilities year on year | % | 12.4% | 13.6% | 12.6% | 10.8% | 10.1% |
| Facility unit price | Millions of yen | 17.4 | 17.6 | 17.9 | 18.4 | 18.8 |
| Facility unit price year on year | % | 8.0% | 0.9% | 1.4% | 3.0% | 2.3% |
| 4Q Monthly Average Number of Users | People | 333,242 | 374,838 | 424,331 | 458,189 | 491,056 |
| 4Q Monthly Average Number of Users year on year | % | 21.2% | 12.5% | 13.2% | 8.0% | 7.2% |
FY2026 Forecast
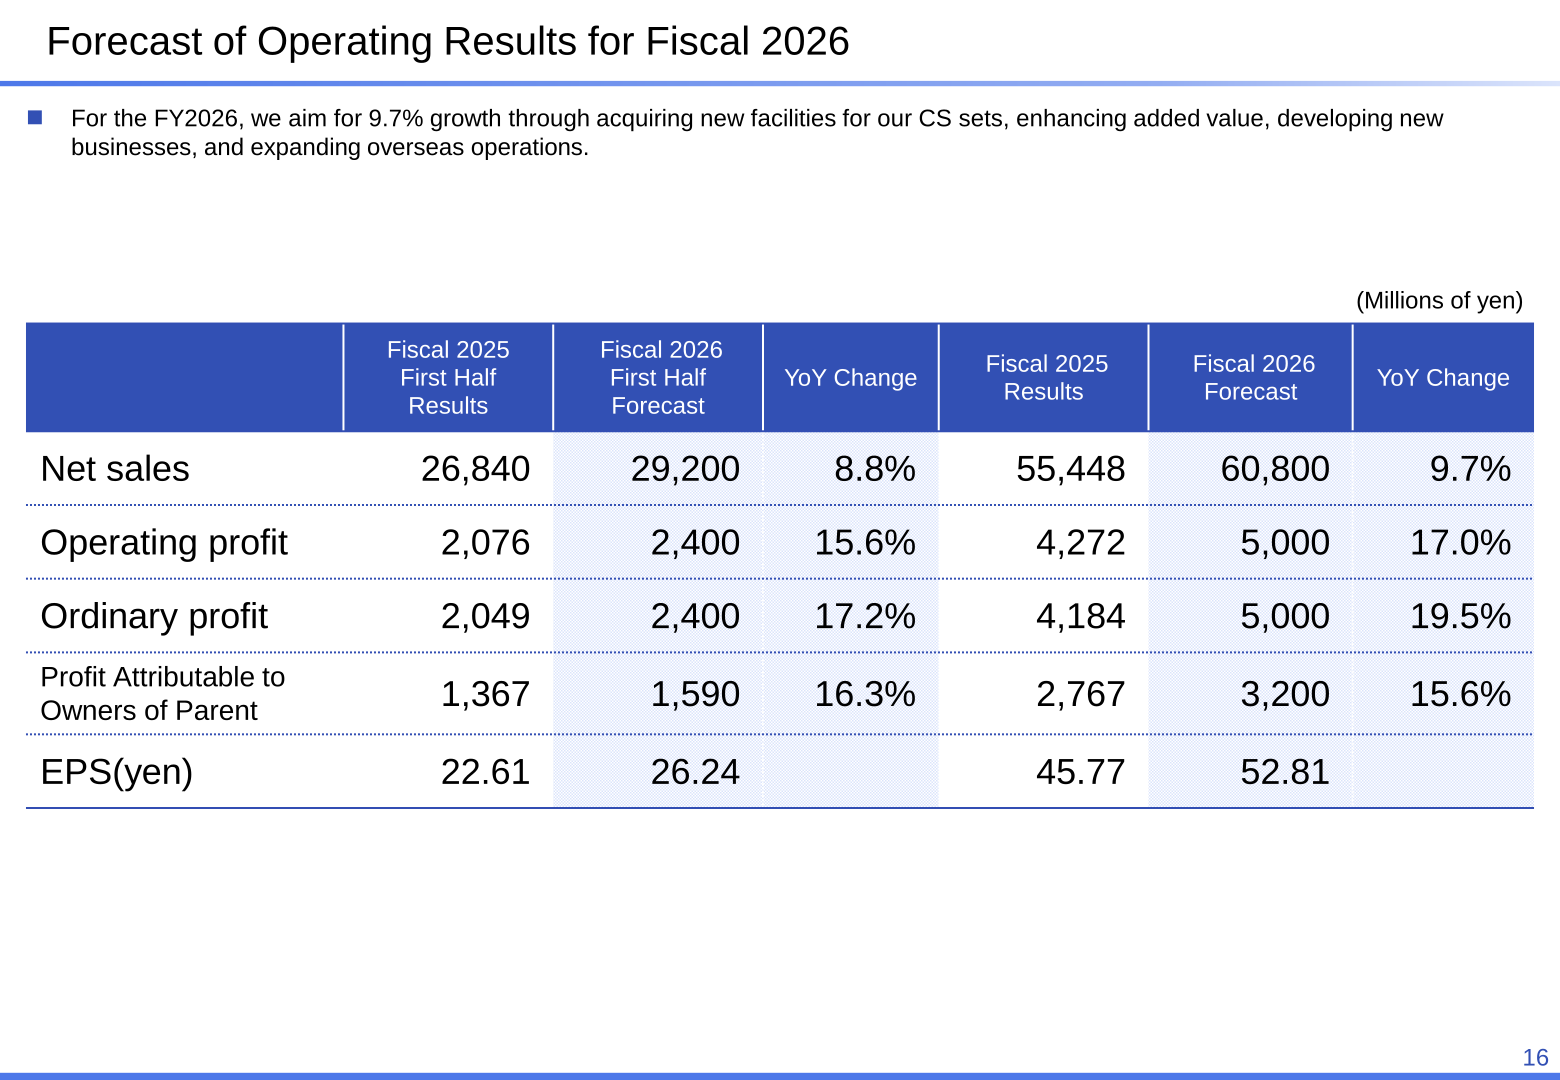
For fiscal 2026, ELAN targets 9.7% growth in net sales through acquiring new facilities for its CS sets, enhancing added value, developing new businesses and expanding overseas operations. The forecast calls for net sales of 60,800 million yen, operating profit of 5,000 million yen, ordinary profit of 5,000 million yen and profit attributable to owners of parent of 3,200 million yen, with EPS of 52.81 yen. For the first half, the company forecasts net sales of 29,200 million yen and operating profit of 2,400 million yen.
| Item (Millions of yen) | Fiscal 2025 First Half Results | Fiscal 2026 First Half Forecast | YoY Change | Fiscal 2025 Results | Fiscal 2026 Forecast | YoY Change |
|---|---|---|---|---|---|---|
| Net sales | 26,840 | 29,200 | 8.8% | 55,448 | 60,800 | 9.7% |
| Operating profit | 2,076 | 2,400 | 15.6% | 4,272 | 5,000 | 17.0% |
| Ordinary profit | 2,049 | 2,400 | 17.2% | 4,184 | 5,000 | 19.5% |
| Profit Attributable to Owners of Parent | 1,367 | 1,590 | 16.3% | 2,767 | 3,200 | 15.6% |
| EPS(yen) | 22.61 | 26.24 | 45.77 | 52.81 |
Shareholder Returns
The dividend per share for FY2025 was 15.0 yen with a dividend payout ratio of 32.8%. The company states that the year-end dividend for the fiscal year ending December 2026 will be 16.0 yen per share, with a payout ratio of 30.3%. Dividend per share in the company’s chart has been retroactively adjusted to reflect the 2-for-1 stock split on January 1, 2021.
| Item | FY2021 | FY2022 | FY2023 | FY2024 | FY2025 | FY2026 (Forecast) |
|---|---|---|---|---|---|---|
| Dividend per share | 9.0円 | 11.0円 | 13.0円 | 13.0円 | 15.0円 | 16.0円 |
| Dividend payout ratio | 28.6% | 31.9% | 31.2% | 33.4% | 32.8% | 30.3% |
New Mid-Term Management Plan (2026–2028)
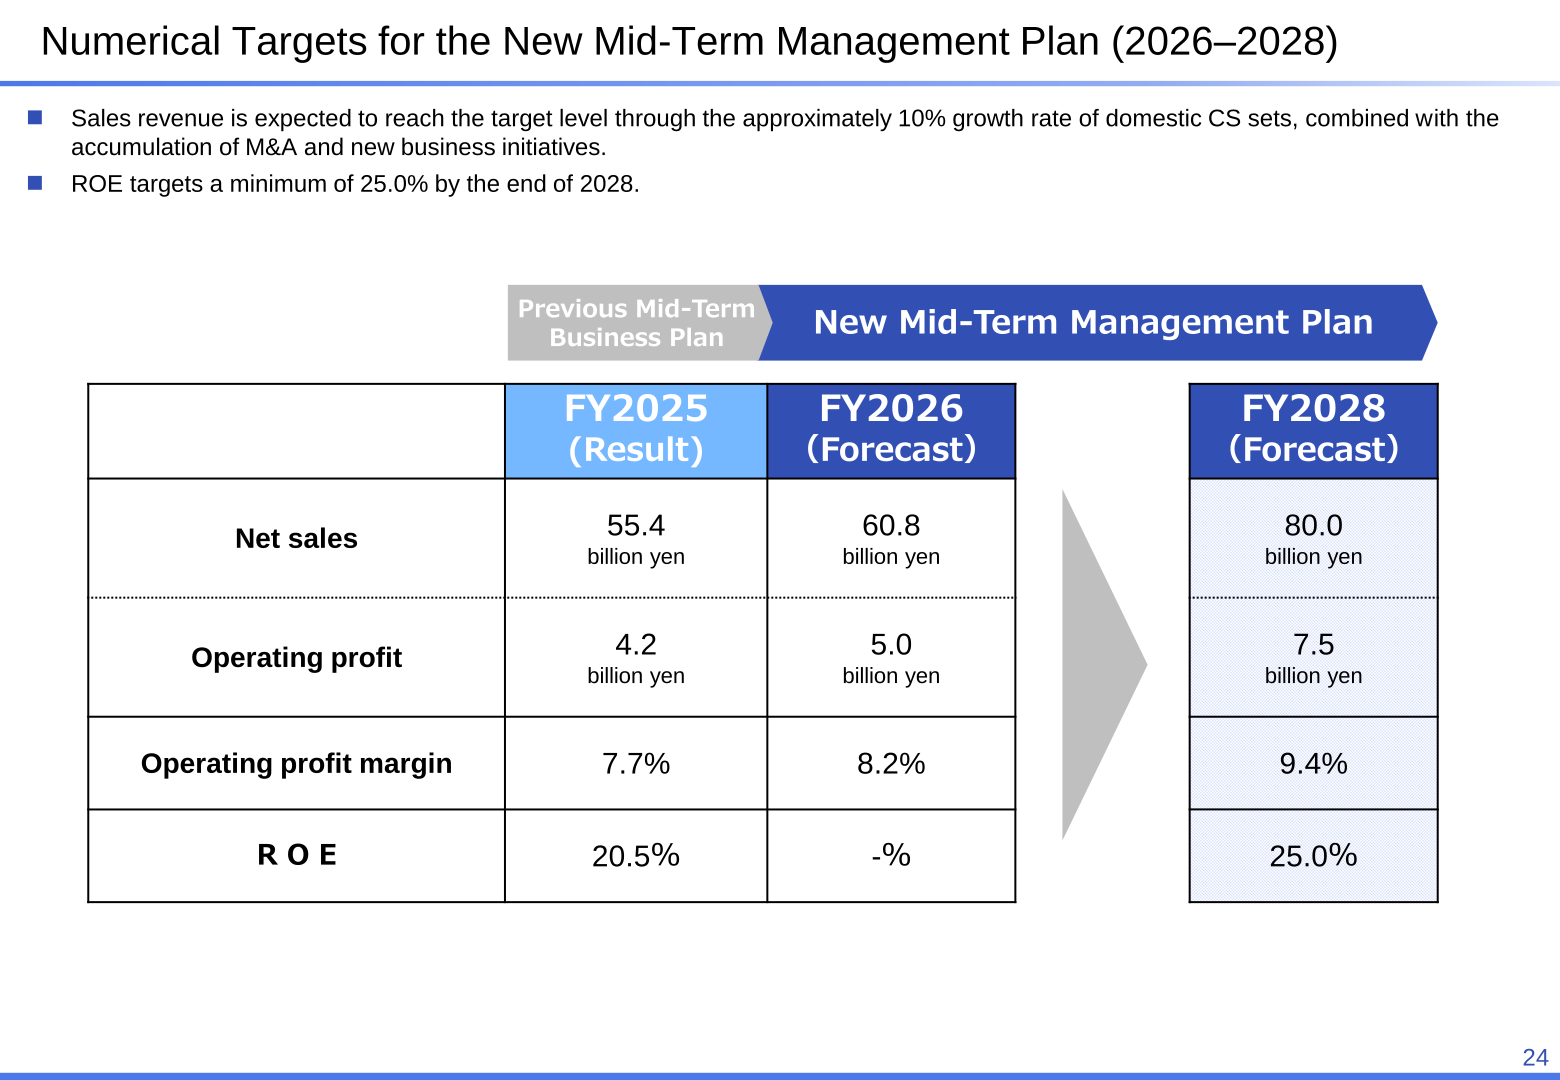
ELAN announced a new Mid-Term Management Plan covering 2026 to 2028. The company says it will build on the growth of the existing CS set and execute growth investments and M&A disciplined by a 25% ROE target. Net sales are expected to reach the target level through the approximately 10% growth rate of domestic CS sets combined with the accumulation of M&A and new business initiatives, and ROE targets a minimum of 25.0% by the end of 2028. On capital allocation for 2026–2028, cash-in comprises cash flows from operating activities of 16.0 billion yen, cash and deposits of 6.8 billion yen and interest-bearing debt of 0–1.2 billion yen (with an overdraft limit of 4.2 billion yen). Cash-out comprises dividends of 3.0 billion yen at a dividend payout ratio of 30% or more, cash and deposits of 6.0 billion yen (approximately the monthly sales amount), business investment of 3.0 billion yen for system investments and other purposes, and M&A of 9.0–12.0 billion yen across domestic business infrastructure strengthening, management support and overseas expansion types.
| Item | FY2025 (Result) | FY2026 (Forecast) | FY2028 (Forecast) |
|---|---|---|---|
| Net sales | 55.4 billion yen | 60.8 billion yen | 80.0 billion yen |
| Operating profit | 4.2 billion yen | 5.0 billion yen | 7.5 billion yen |
| Operating profit margin | 7.7% | 8.2% | 9.4% |
| R O E | 20.5% | -% | 25.0% |
Management Conscious of Cost of Capital and Stock Price
ELAN re-examined its understanding of management that is conscious of cost of capital and stock price, first disclosed in February 2024. The company recognizes its cost of capital as approximately 7-8%, while acknowledging a gap with investor expected returns of around 8-9% based on survey results. ROE is projected to exceed the cost of capital at 20.5% in 2025, but the company views its declining trend as a challenge. In its PBR tree analysis, the closing stock price was 723 yen with a PBR of 3.0 times and a PER of 15.8 times for FY2025, against 738 yen, 3.6 times and 19.0 times for FY2024. The company attributes the declining PER to its transition from a high-growth phase to a stable growth phase, and the declining ROE to a falling net profit margin and the accumulation of equity capital. Under the new plan, KPIs for achieving ROE are positioned as performance responsibilities for executive officers and department heads, and a performance-based stock option plan is currently under design.
Reviewing the previous Mid-Term Management Plan (2023–2025), the company notes that while sales revenue maintained a growth trend, it fell short of the planned figures in each fiscal year, and operating profit also fell short of plan for fiscal years 2024 and 2025. For FY2025, net sales of 55.4 billion yen were 94% of the 59.0 billion yen plan and operating profit of 4.27 billion yen was 91% of the 4.72 billion yen plan.
This article is an analysis based on publicly available information and is not a recommendation to buy or sell any specific securities. Investment decisions are your own responsibility.
![[Obayashi] Investors’ Guide 2026 — The Complete 24-Article Breakdown](https://japan-equity.com/wp-content/uploads/2026/07/hub_cover-1024x1024.png)
![[Obayashi] IR & SR Policy — Feeding Dialogue Back into Management](https://japan-equity.com/wp-content/uploads/2026/07/p32_sq-1024x1024.jpg)
![[Obayashi] Real Estate Development — 18.7% Margin, ¥287.7bn Unrealized Gains](https://japan-equity.com/wp-content/uploads/2026/07/p20_sq-1024x1024.jpg)
![[Obayashi] Domestic Civil Engineering — Resilience Spending Supports 9.6% Margin](https://japan-equity.com/wp-content/uploads/2026/07/p11_sq-1024x1024.jpg)
![[Obayashi] Share Price & External Ratings — vs TOPIX, ESG Index Inclusion](https://japan-equity.com/wp-content/uploads/2026/07/p40_sq-1024x1024.jpg)
![[Construction] ¥75.5tn Investment, Shrinking Workforce — Big-5 Market Share](https://japan-equity.com/wp-content/uploads/2026/07/p12_sq-1024x1024.jpg)



![[Obayashi] Capital Policy & Shareholder Returns — ROE 10%+, DOE ~5%, ¥100bn Buyback](https://japan-equity.com/wp-content/uploads/2026/07/p27_sq-1024x1024.jpg)
![[Obayashi] Reducing Cross-Shareholdings — ¥285.2bn Sold in Five Years](https://japan-equity.com/wp-content/uploads/2026/07/p29_sq-1024x1024.jpg)
![[Obayashi] ¥750bn Investment Plan — ¥300bn to Development, ¥190bn to Tech/DX](https://japan-equity.com/wp-content/uploads/2026/07/p30_sq-1024x1024.jpg)
![[Obayashi] MTP2022 KPIs — Operating Profit ~2x Target, ROE 14.4%](https://japan-equity.com/wp-content/uploads/2026/07/p25_sq-1024x1024.jpg)
![[Obayashi] Cash Allocation — ¥420bn Investment CF Over Five Years](https://japan-equity.com/wp-content/uploads/2026/07/p26_sq-1024x1024.jpg)
![[Obayashi] Green Energy — 44 Plants, 344MW, and the Green Hydrogen Challenge](https://japan-equity.com/wp-content/uploads/2026/07/p21_sq-1024x1024.jpg)
![[Obayashi] Tackling the Labor Shortage — Robotics Construction®](https://japan-equity.com/wp-content/uploads/2026/07/p14_sq-1024x1024.jpg)
