
This article is based on publicly available IR materials and is not a recommendation to buy or sell any specific securities.
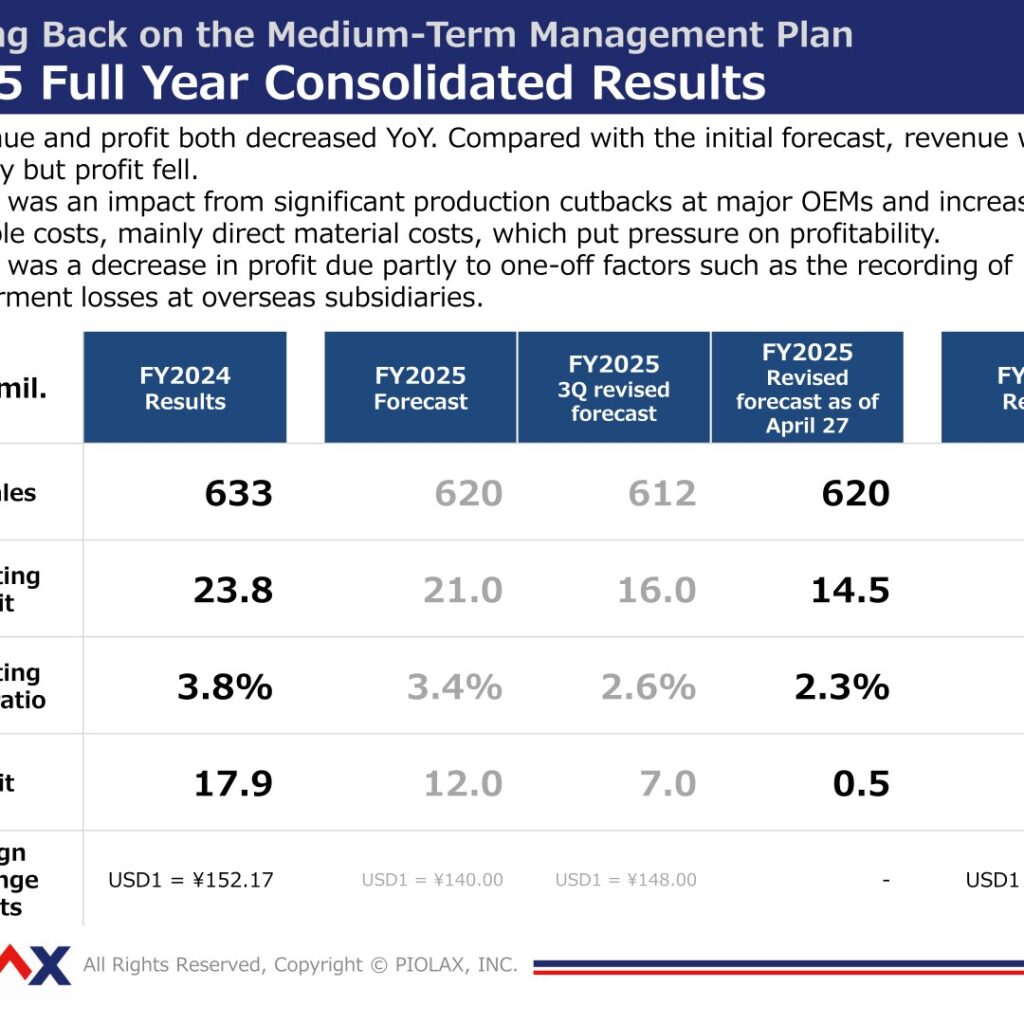
PIOLAX, INC. reported FY2025 consolidated net sales of 620 (¥100 mil.), with operating profit of 14.7 and profit of -0.2. Revenue and profit both decreased year on year, and while revenue was up slightly against the initial forecast, profit fell. Alongside the results, the company announced revisions to its medium-term management plan, resetting its FY2027 targets to net sales of ¥65.0 billion and operating profit of ¥2.5 billion.
Consolidated Results (FY2025 Full Year)
The materials state that revenue and profit both decreased year on year, and that compared with the initial forecast revenue was up slightly but profit fell. There was an impact from significant production cutbacks at major OEMs and increased variable costs, mainly direct material costs, which put pressure on profitability. There was also a decrease in profit due partly to one-off factors such as the recording of impairment losses at overseas subsidiaries.
| Item (¥100 mil.) | FY2024 Results | FY2025 Forecast | FY2025 3Q revised forecast | FY2025 Revised forecast as of April 27 | FY2025 Results |
|---|---|---|---|---|---|
| Net sales | 633 | 620 | 612 | 620 | 620 |
| Operating profit | 23.8 | 21.0 | 16.0 | 14.5 | 14.7 |
| Operating profit ratio | 3.8% | 3.4% | 2.6% | 2.3% | 2.4% |
| Profit | 17.9 | 12.0 | 7.0 | 0.5 | -0.2 |
| Foreign exchange results | USD1 = ¥152.17 | USD1 = ¥140.00 | USD1 = ¥148.00 | – | USD1 = ¥149.78 |
Regional Progress
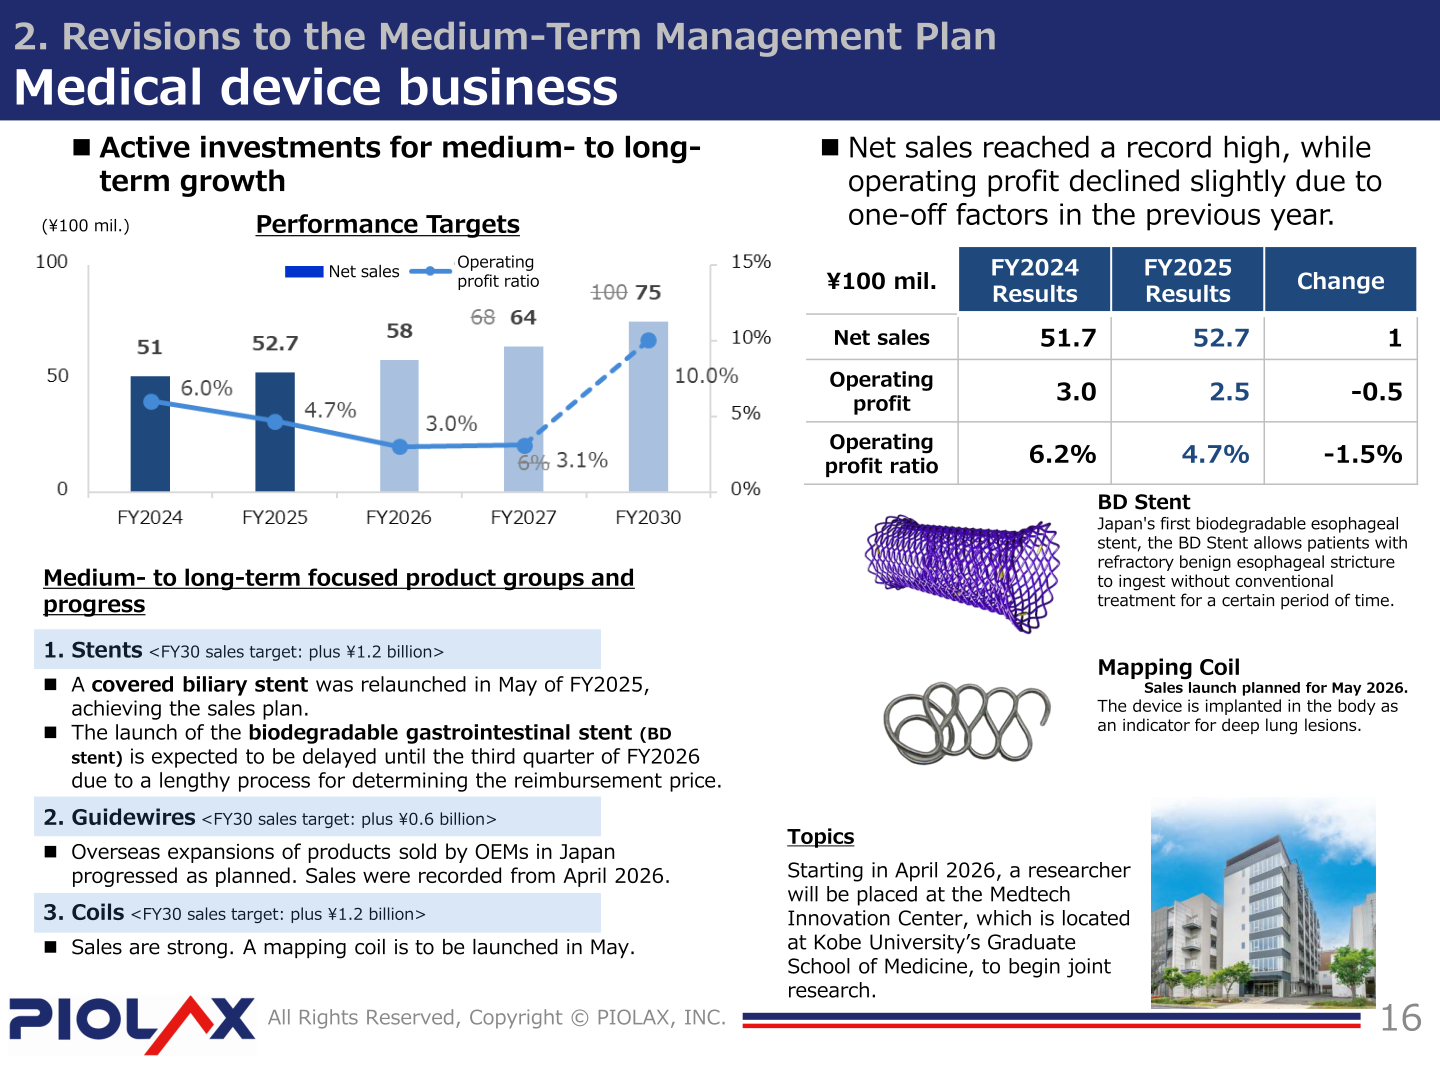
In Japan (non-consolidated), profit decreased due to lower production by major OEMs and higher raw material and labor costs; the company promoted cuts to variable and fixed costs through profit structure reforms, increased quality and productivity through MES updates, and built a system to expand sales to further OEMs following Nissan and Honda. In North America, revenue and profit both decreased compared to the plan due to production cutbacks at major Japanese OEMs and increased import costs (approx. ¥200 million) caused by additional tariffs. In China, net sales exceeded the plan as the effect of non-Japanese sales expansions helped to offset the impact of Japanese production cutbacks, but the plan for operating profit was not achieved due to one-off costs (approx. ¥600 million) from production reallocations. In India, net sales exceeded the target and the launch of the second plant was carried out on schedule, although operating profit did not reach the target due to one-off costs.
The FY25 net sales composition (consolidated) is shown as Nissan business 32%, Honda business 18%, other Japanese 20%, non-Japanese 15% and other 15%. Within the regions, the FY25 net sales composition is Japanese 80.2% / non-Japanese 19.5% / other 0.2% in North America, Japanese 74.1% / non-Japanese 25.9% in China, and Maruti/local OEMs 45.8% / Japanese 45.1% / other 9.1% in India.
| Region / Business | FY2027 Target | Progress in FY2025 |
|---|---|---|
| Japan | Net sales of ¥27.0 billion | Net sales of ¥26.4 billion |
| North America | Net sales of ¥17.0 billion | Net sales of ¥14.8 billion |
| China | Net sales of ¥8.8 billion (non-Japanese companies, ¥2.6 billion) | Net sales of ¥9.0 billion |
| India | Net sales of ¥3.2 billion | Net sales of ¥2.3 billion |
| Medical device business | Net sales of ¥6.4 billion; operating profit ratio 3.1% (¥200 million) | Net sales of ¥5.27 billion; operating profit ratio of 4.7% (¥250 million) |
Revised Medium-Term Management Plan Targets
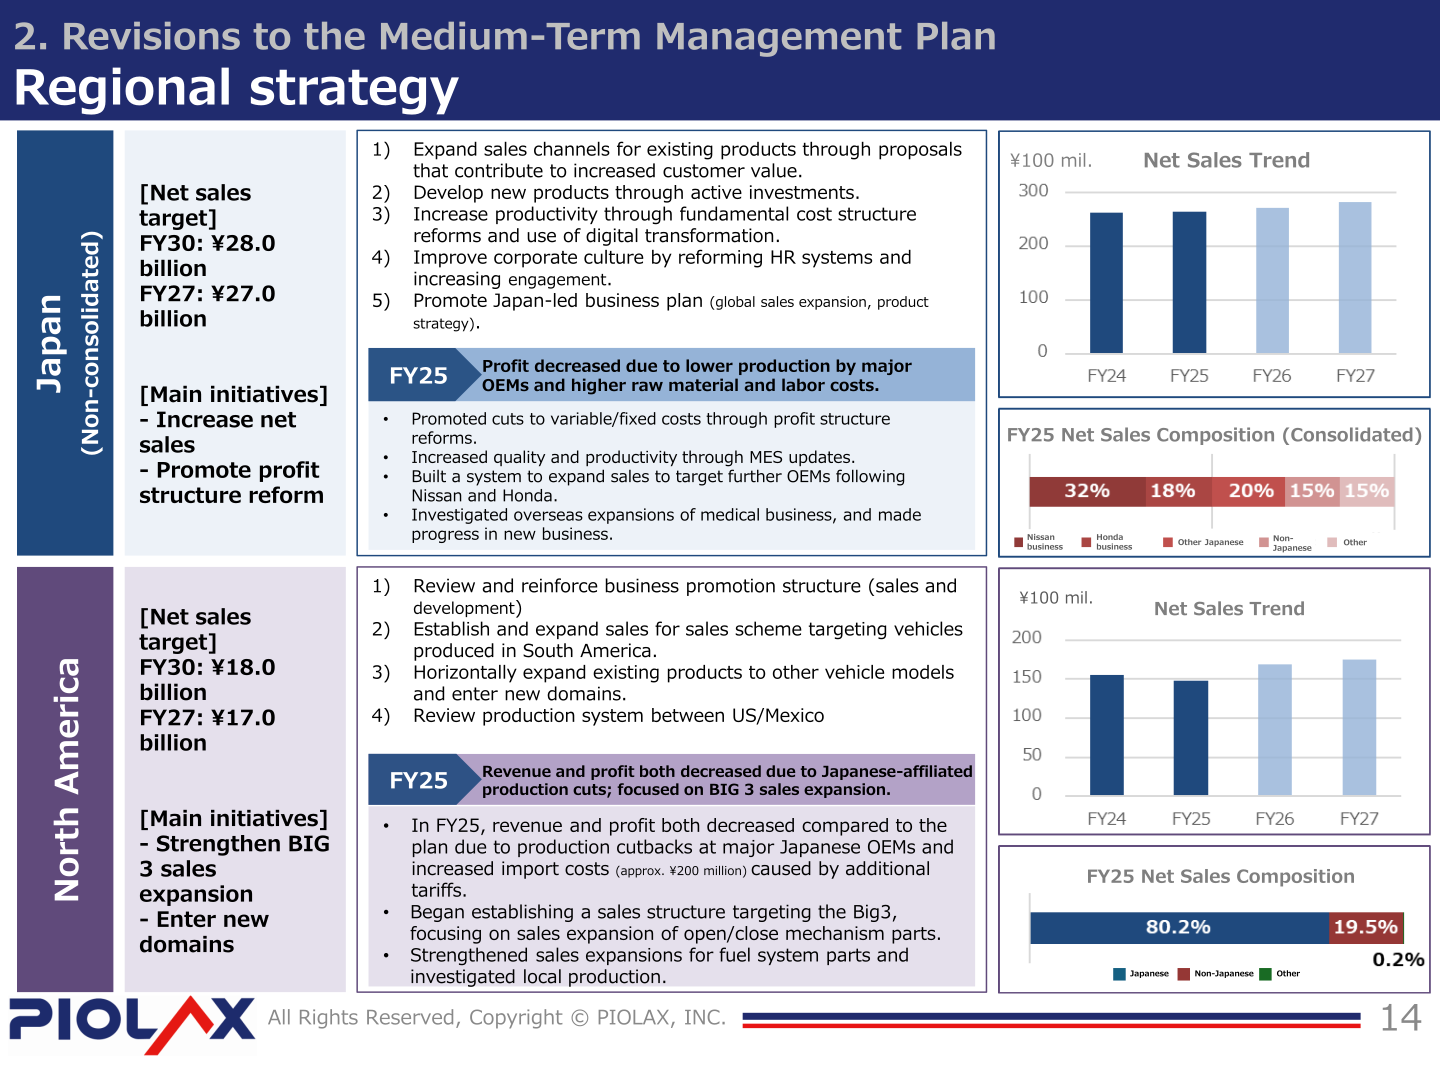
The structural reform phase covers FY2025-FY2027 (3 years) and aims to improve the profit base through structural reforms, sales expansions and strengthening of developmental capabilities, targeting net sales of ¥65.0 billion and operating profit of ¥2.5 billion in FY2027. Progress in FY2025 included global sales expansion of ¥8.1 billion against a FY2027 target of ¥12.0 billion, per car sales of ¥3,900 for major Japanese OEMs and ¥300 for major non-Japanese OEMs, and an optimized production system that reduced the workforce by approximately 150 employees throughout the group. A separate FY2026 full-year earnings forecast cannot be confirmed from the materials; the figures below are the revised performance targets presented in the plan.
| Item (¥100 mil.) | FY2026 Pre-revision | FY2026 Revised figures | FY2027 Pre-revision | FY2027 Revised figures | FY2030 Pre-revision | FY2030 Revised figures |
|---|---|---|---|---|---|---|
| Net sales | 660 | 630 | 690 | 650 | 850 | 700 |
| Operating profit | 46 | 15 | 63 | 25 | 90 | 45 |
| Operating profit ratio | 7.0% | 2.4% | 9.1% | 3.8% | 10.6% | 6.4% |
| Profit | 36 | 7 | 48 | 16 | 66 | 30 |
| ROE | – | 1.2% | 8% or higher | 2.7% | – | 5% or higher |
Medical Device Business
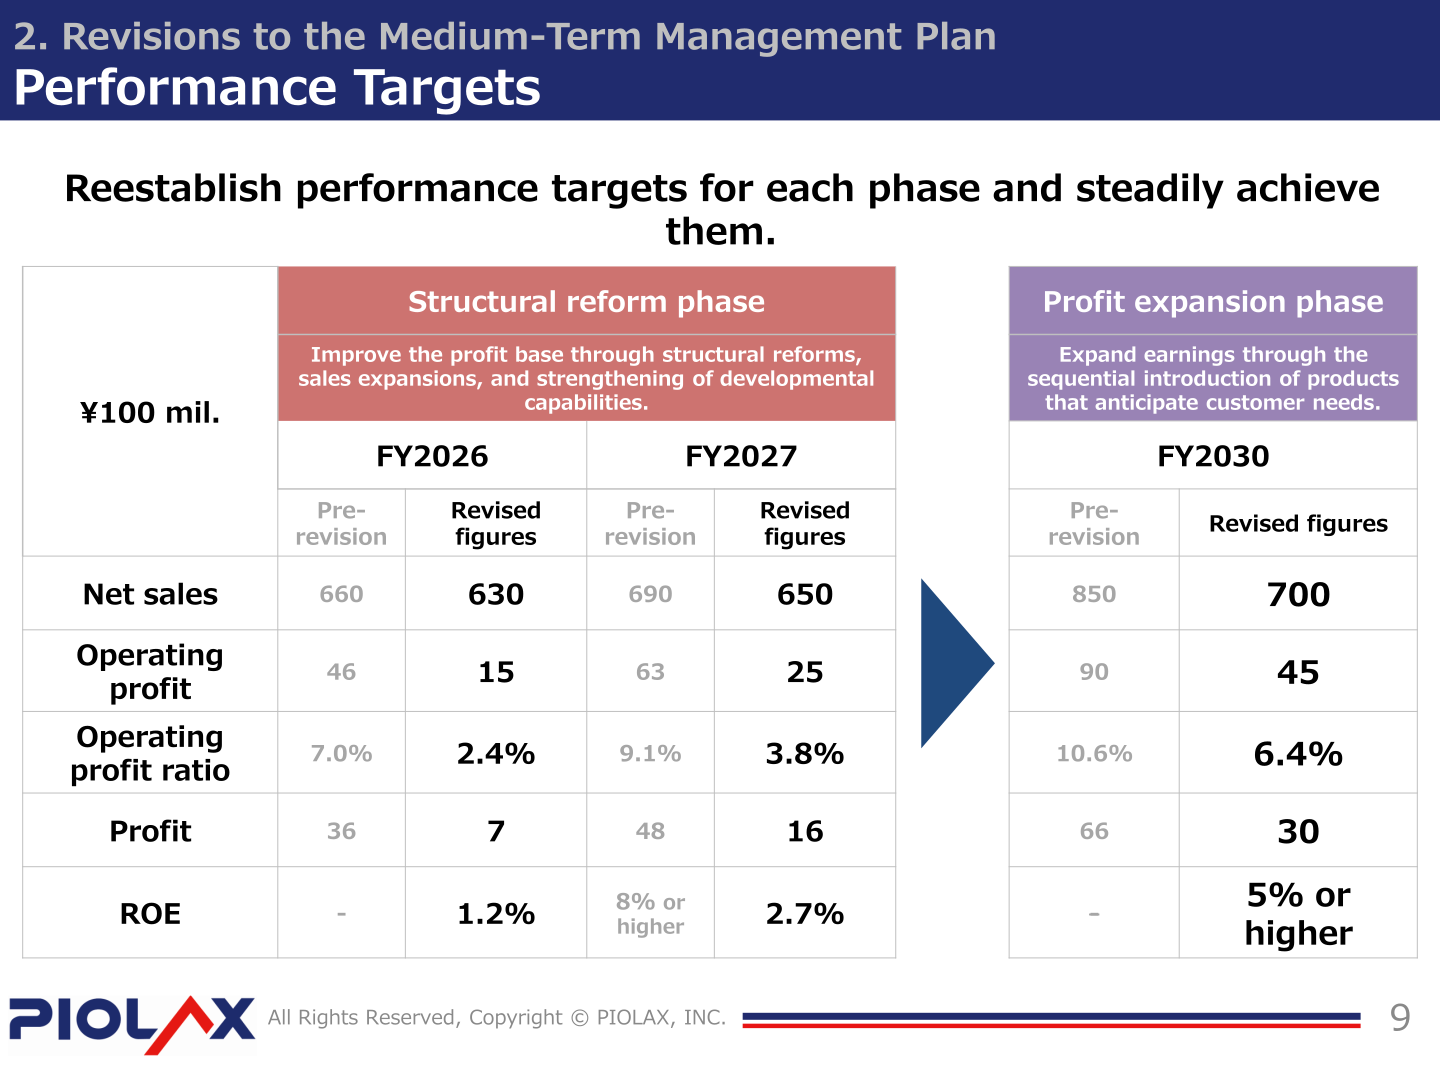
Net sales reached a record high, while operating profit declined slightly due to one-off factors in the previous year. A covered biliary stent was relaunched in May of FY2025 and achieved the sales plan, while the launch of the biodegradable gastrointestinal stent (BD stent) is expected to be delayed until the third quarter of FY2026 due to a lengthy process for determining the reimbursement price. Overseas expansions of guidewires sold by OEMs in Japan progressed as planned, with sales recorded from April 2026, and coil sales are strong with a mapping coil to be launched in May.
| Item (¥100 mil.) | FY2024 Results | FY2025 Results | Change |
|---|---|---|---|
| Net sales | 51.7 | 52.7 | 1 |
| Operating profit | 3.0 | 2.5 | -0.5 |
| Operating profit ratio | 6.2% | 4.7% | -1.5% |
Shareholder Returns
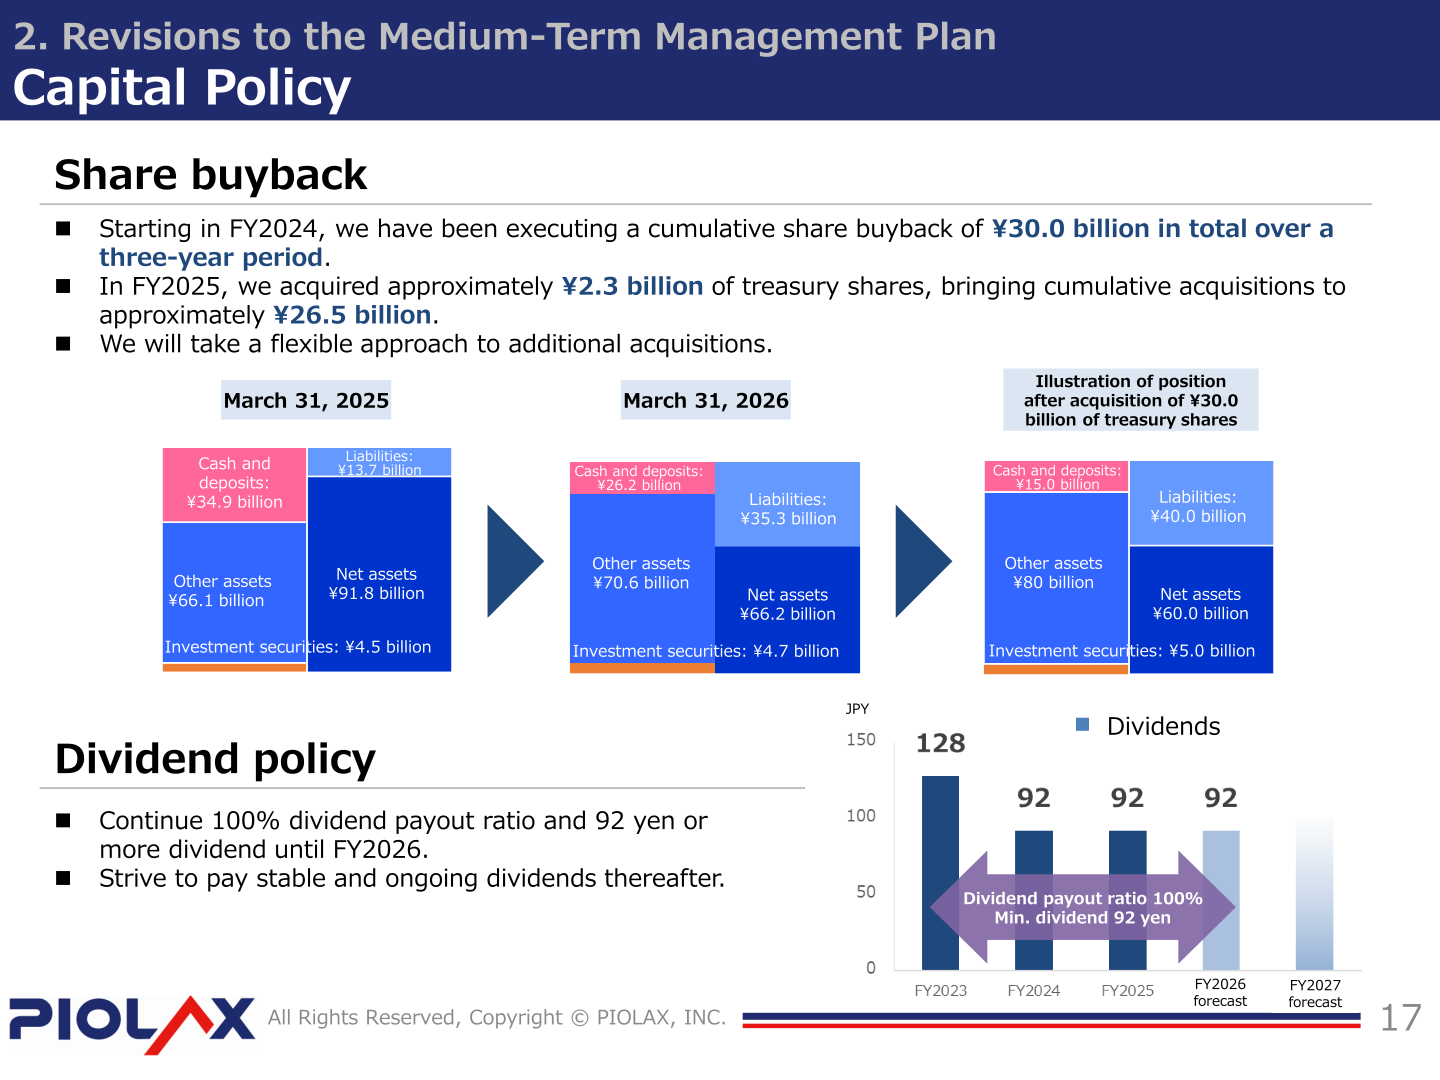
On dividends, the company states that it will continue a 100% dividend payout ratio and a dividend of 92 yen or more until FY2026, and will strive to pay stable and ongoing dividends thereafter. The dividend chart shows 128 yen for FY2023, 92 yen for FY2024, 92 yen for FY2025 and 92 yen for the FY2026 forecast.
On buybacks, starting in FY2024 the company has been executing a cumulative share buyback of ¥30.0 billion in total over a three-year period. In FY2025 it acquired approximately ¥2.3 billion of treasury shares, bringing cumulative acquisitions to approximately ¥26.5 billion, and it will take a flexible approach to additional acquisitions. The accompanying balance sheet illustration shows cash and deposits of ¥34.9 billion, other assets of ¥66.1 billion, investment securities of ¥4.5 billion, liabilities of ¥13.7 billion and net assets of ¥91.8 billion as of March 31, 2025, moving to cash and deposits of ¥26.2 billion, other assets of ¥70.6 billion, investment securities of ¥4.7 billion, liabilities of ¥35.3 billion and net assets of ¥66.2 billion as of March 31, 2026.
Strategy and Topics
The company frames its long-term concept as starting to produce results from sales expansions and aiming for growth in the medium to long term after bottoming out in FY2025, moving from a structural reform phase through a profit expansion phase to a sustainable growth phase. Identified issues include breaking away from dependence on production volumes, improvement of the break-even point ratio, expansion of high value-added products and strengthening of global profit management, with a stated aim of achieving ROE of 8% or higher as soon as possible. Priority new products are ADAS-related brackets, bus bars, and products developed using conventional technologies such as electric latches, multi-purpose hooks and smart actuators, with a target of net sales of ¥10.0 billion in FY2030 for new products. In FY2025 the company received orders for the priority items ADAS brackets, bus bars and electric latches, and developed a multi-purpose hook jointly with Hyundai-Kia.
This article is an analysis based on publicly available information and is not a recommendation to buy or sell any specific securities. Investment decisions are your own responsibility.
![[Obayashi] Investors’ Guide 2026 — The Complete 24-Article Breakdown](https://japan-equity.com/wp-content/uploads/2026/07/hub_cover-1024x1024.png)
![[Obayashi] IR & SR Policy — Feeding Dialogue Back into Management](https://japan-equity.com/wp-content/uploads/2026/07/p32_sq-1024x1024.jpg)
![[Obayashi] Domestic Civil Engineering — Resilience Spending Supports 9.6% Margin](https://japan-equity.com/wp-content/uploads/2026/07/p11_sq-1024x1024.jpg)
![[Obayashi] Overseas Construction — Orders Reach ¥1.2tn](https://japan-equity.com/wp-content/uploads/2026/07/p15_sq-1024x1024.jpg)
![[Obayashi] Share Price & External Ratings — vs TOPIX, ESG Index Inclusion](https://japan-equity.com/wp-content/uploads/2026/07/p40_sq-1024x1024.jpg)
![[Construction] ¥75.5tn Investment, Shrinking Workforce — Big-5 Market Share](https://japan-equity.com/wp-content/uploads/2026/07/p12_sq-1024x1024.jpg)



![[Obayashi] Capital Policy & Shareholder Returns — ROE 10%+, DOE ~5%, ¥100bn Buyback](https://japan-equity.com/wp-content/uploads/2026/07/p27_sq-1024x1024.jpg)
![[Obayashi] Reducing Cross-Shareholdings — ¥285.2bn Sold in Five Years](https://japan-equity.com/wp-content/uploads/2026/07/p29_sq-1024x1024.jpg)
![[Obayashi] ¥750bn Investment Plan — ¥300bn to Development, ¥190bn to Tech/DX](https://japan-equity.com/wp-content/uploads/2026/07/p30_sq-1024x1024.jpg)
![[Obayashi] MTP2022 KPIs — Operating Profit ~2x Target, ROE 14.4%](https://japan-equity.com/wp-content/uploads/2026/07/p25_sq-1024x1024.jpg)
![[Obayashi] Cash Allocation — ¥420bn Investment CF Over Five Years](https://japan-equity.com/wp-content/uploads/2026/07/p26_sq-1024x1024.jpg)
![[Obayashi] Green Energy — 44 Plants, 344MW, and the Green Hydrogen Challenge](https://japan-equity.com/wp-content/uploads/2026/07/p21_sq-1024x1024.jpg)
![[Obayashi] Tackling the Labor Shortage — Robotics Construction®](https://japan-equity.com/wp-content/uploads/2026/07/p14_sq-1024x1024.jpg)
