
This article is based on publicly available IR materials and is not a recommendation to buy or sell any specific securities.
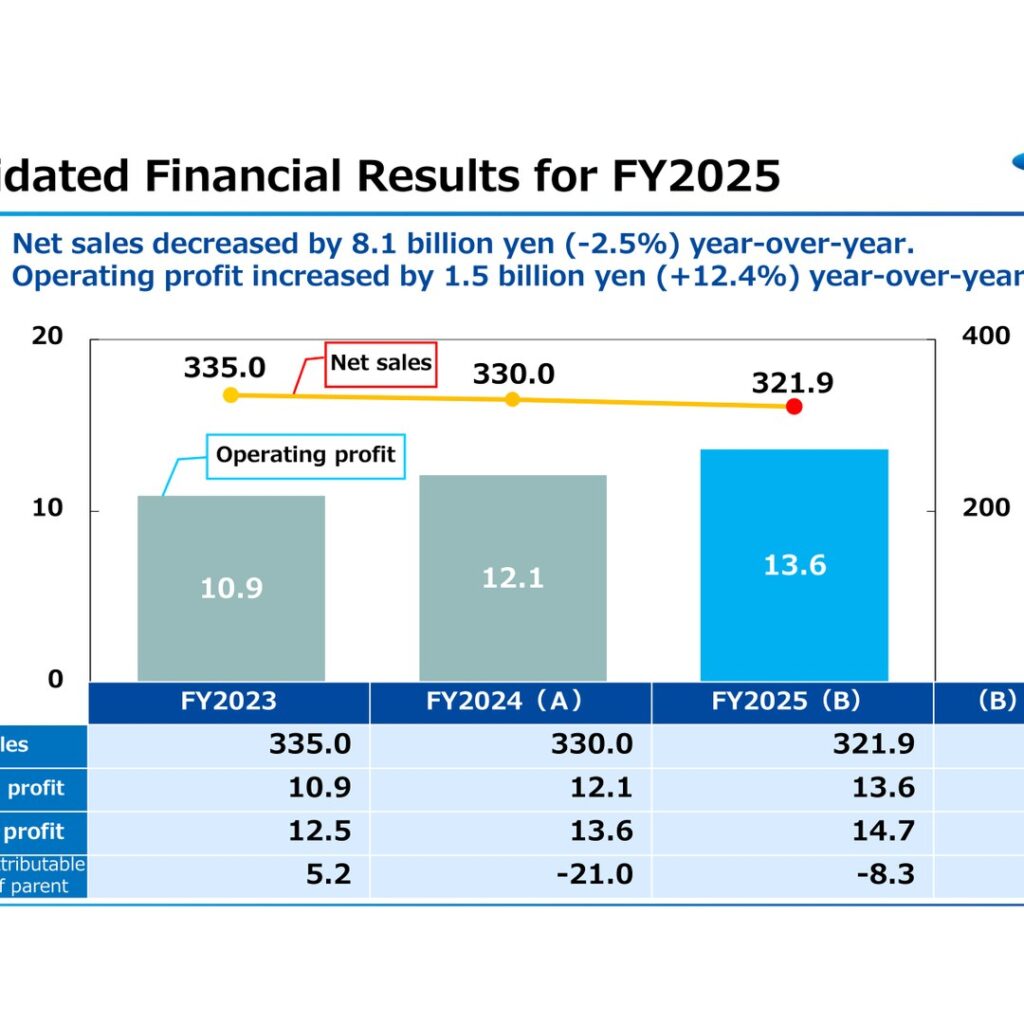
Unipres Corporation reported FY2025 net sales of 321.9 billion yen, a decrease of 8.1 billion yen (-2.5%) year-over-year, as customers’ production decreased and foreign exchange conversion weighed on sales. Operating profit increased by 1.5 billion yen (+12.4%) to 13.6 billion yen because of positive effects from a reduction in depreciation cost and streamlining efforts arising from production system restructuring in the China segment. Ordinary profit rose 1.1 billion yen to 14.7 billion yen, while net income attributable to owners of parent was -8.3 billion yen, an improvement of 12.7 billion yen from FY2024. Alongside the results, the company presented its FY2026-2028 Medium-term Management Policies.
Consolidated Results (Full-Year Actual)
Net sales declined for a second consecutive year, from 335.0 billion yen in FY2023 and 330.0 billion yen in FY2024 to 321.9 billion yen in FY2025. Operating profit, by contrast, improved for a second consecutive year, from 10.9 billion yen to 12.1 billion yen and then to 13.6 billion yen. Net income attributable to owners of parent remained negative at -8.3 billion yen, following -21.0 billion yen in FY2024.
| Item | FY2023 | FY2024 (A) | FY2025 (B) | (B) – (A) |
|---|---|---|---|---|
| Net sales | 335.0 | 330.0 | 321.9 | -8.1 |
| Operating profit | 10.9 | 12.1 | 13.6 | +1.5 |
| Ordinary profit | 12.5 | 13.6 | 14.7 | +1.1 |
| Net income attributable to owners of parent | 5.2 | -21.0 | -8.3 | +12.7 |
The operating profit variance analysis bridges FY2024’s 12.1 billion yen to FY2025’s 13.6 billion yen. Positive factors were depreciation/amortization of +6.7 billion yen and cost saving of +2.7 billion yen. Negative factors were volume fluctuation and model mix etc. of -5.7 billion yen, others of -0.9 billion yen, forex of -0.5 billion yen, initial cost for new car model parts of -0.4 billion yen and consolidation adjustment of -0.4 billion yen. Production reinforcement and SG&A were both shown as 0.
Sales by Product Group and Customer
Car body press products, the company’s core product group, accounted for 88.9% of consolidated sales in FY2025, up 1.0 percentage point from FY2024, even though sales in the group fell by 4.0 billion yen. Precision press products declined by 4.3 billion yen to 29.5 billion yen, reducing their share to 9.2%.
| Product group | FY2024 Sales | FY2024 % | FY2025 Sales | FY2025 % | Variance | Variance % |
|---|---|---|---|---|---|---|
| Car body press products | 290.2 | 87.9% | 286.2 | 88.9% | -4.0 | +1.0% |
| Precision press products | 33.8 | 10.2% | 29.5 | 9.2% | -4.3 | -1.0% |
| Plastic press products | 4.1 | 1.3% | 4.5 | 1.4% | +0.4 | +0.1% |
| Other | 1.9 | 0.6% | 1.7 | 0.5% | -0.2 | -0.1% |
| Total | 330.0 | 100% | 321.9 | 100% | -8.1 | – |
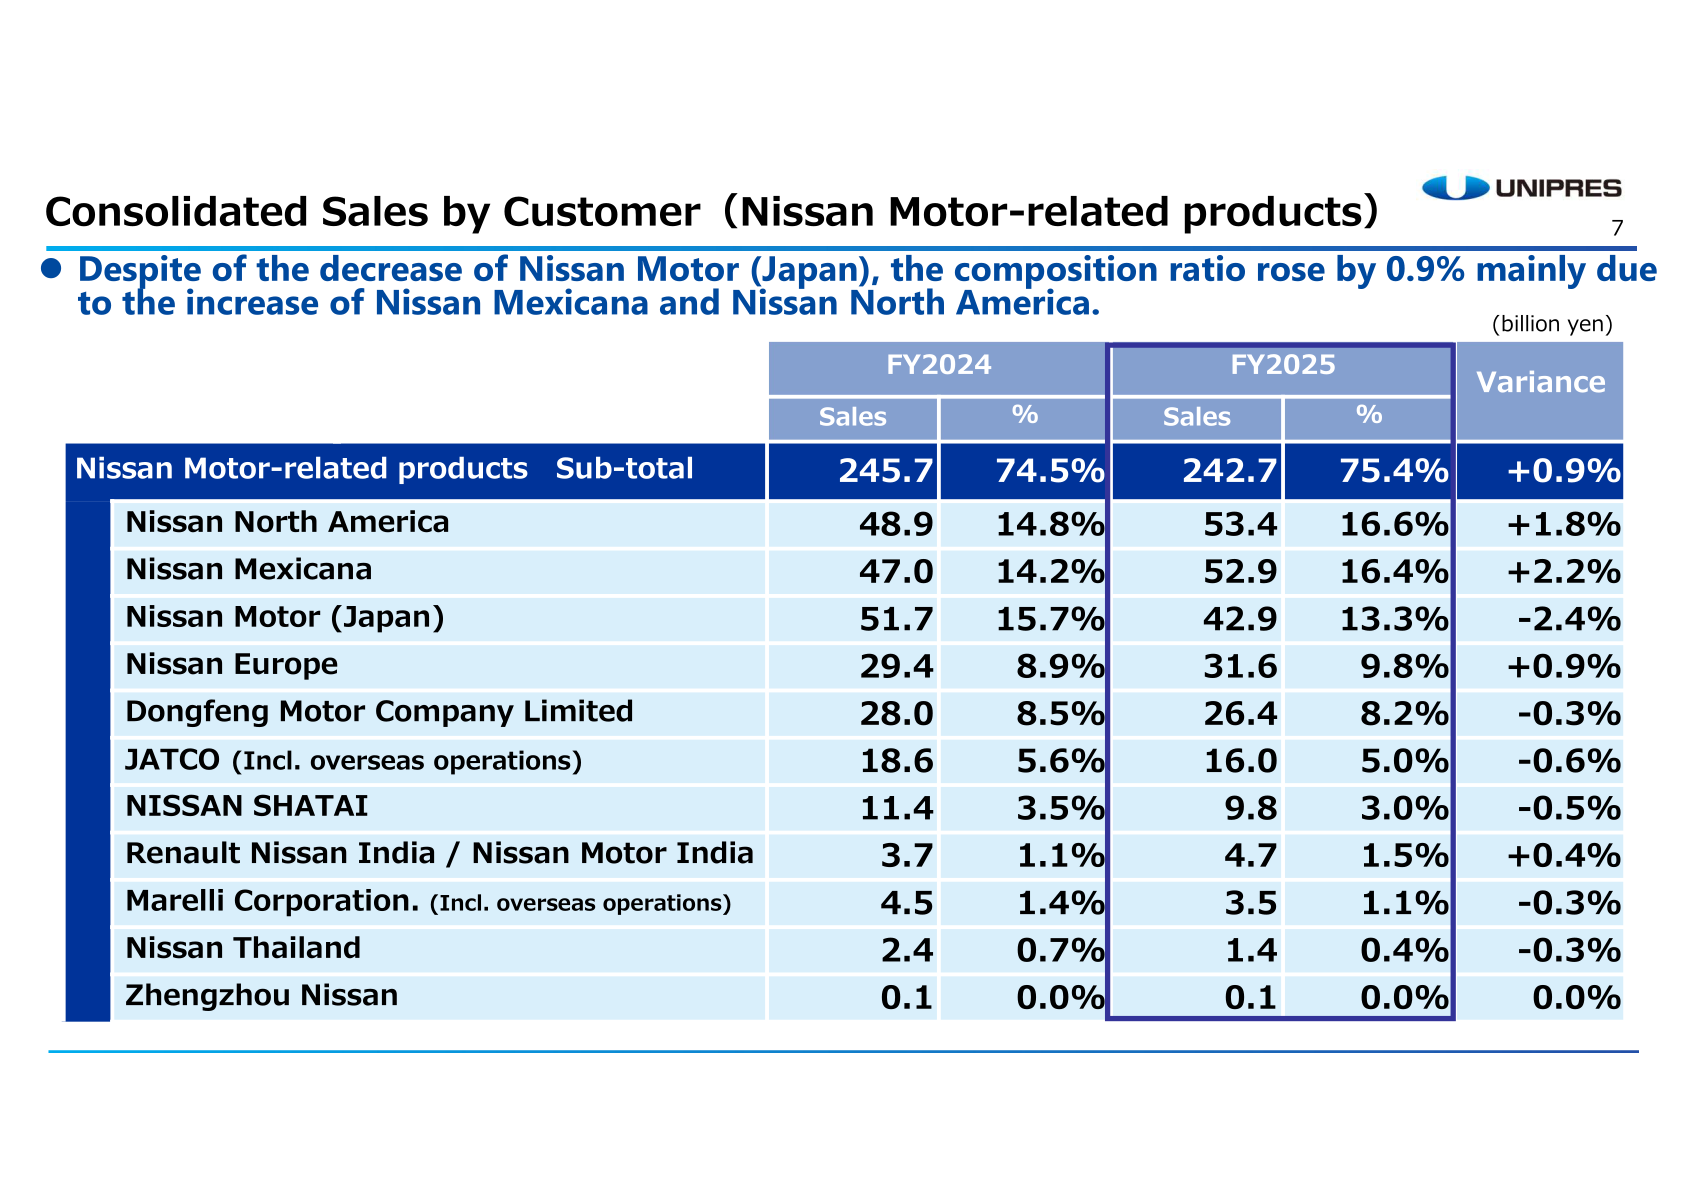
Sales of Nissan Motor-related products totalled 242.7 billion yen in FY2025 versus 245.7 billion yen in FY2024. Despite the decrease of Nissan Motor (Japan), the composition ratio rose by 0.9% to 75.4%, mainly due to the increase of Nissan Mexicana and Nissan North America. Within the group, Nissan North America rose to 53.4 billion yen from 48.9 billion yen and Nissan Mexicana rose to 52.9 billion yen from 47.0 billion yen, while Nissan Motor (Japan) fell to 42.9 billion yen from 51.7 billion yen and Dongfeng Motor Company Limited fell to 26.4 billion yen from 28.0 billion yen. Other customers accounted for 79.2 billion yen (24.6%) versus 84.3 billion yen (25.5%) in FY2024; although the sales of NIO increased, the composition ratio declined by 0.9% due to the decrease in sales of Renault and Stellantis.
Results by Region
In Japan, net sales decreased by 13.4% mainly due to the impact of customers’ production decrease, but operating profit increased by 2.3 billion yen mainly due to the transfer pricing adjustment incurred between Unipres Corporation and its US subsidiaries. In The Americas, net sales increased by 3.6% in spite of the impact of exchange rate fluctuations, while operating profit dropped by 4.6 billion as a result of the transfer pricing adjustment. In Europe, net sales decreased by 1.8% because of customers’ production decrease and the operating loss was 0.3 billion yen. In Asia, net sales increased by 4.0% mainly due to an increase in die sales, and operating profit turned to profitability due to less depreciation and amortization.
| Region | Metric (billion yen) | FY2024 | FY2025 | FY2026 (Plan) |
|---|---|---|---|---|
| Japan | Net sales | 104.1 | 90.1 | 93.0 |
| Japan | Operating profit | 0.7 | 3.0 | -0.9 |
| The Americas | Net sales | 131.4 | 136.1 | 112.9 |
| The Americas | Operating profit | 14.3 | 9.7 | 9.7 |
| Europe | Net sales | 45.3 | 44.5 | 43.0 |
| Europe | Operating profit | 0.2 | -0.3 | 1.7 |
| Asia | Net sales | 49.1 | 51.1 | 35.9 |
| Asia | Operating profit | -3.4 | 1.2 | 1.0 |
Investment, Cash Flow and Financial Position
Capital investment was 9.3 billion yen, a decrease of 3.8 billion yen from the previous year and 5.5 billion yen below the plan, after 13.1 billion yen in FY2024 and 10.2 billion yen in FY2023. Depreciation/amortization was 17.2 billion yen, a decrease of 6.7 billion yen from the previous year and 0.7 billion yen above the plan, after 23.9 billion yen in FY2024 and 25.2 billion yen in FY2023. Free cash flow of 13.5 billion yen was secured. Interest-bearing debts decreased by 6.7 billion yen year-on-year to 50.4 billion yen at end-March 2026 (short-term loans payable 34.5 billion yen and long-term loans payable 15.9 billion yen), and net interest-bearing debts including cash and deposits improved significantly, resulting in a debt-free position. The ratio of equity to total assets increased by 0.6% to 45.4% compared to the previous year.
FY2026 Forecast
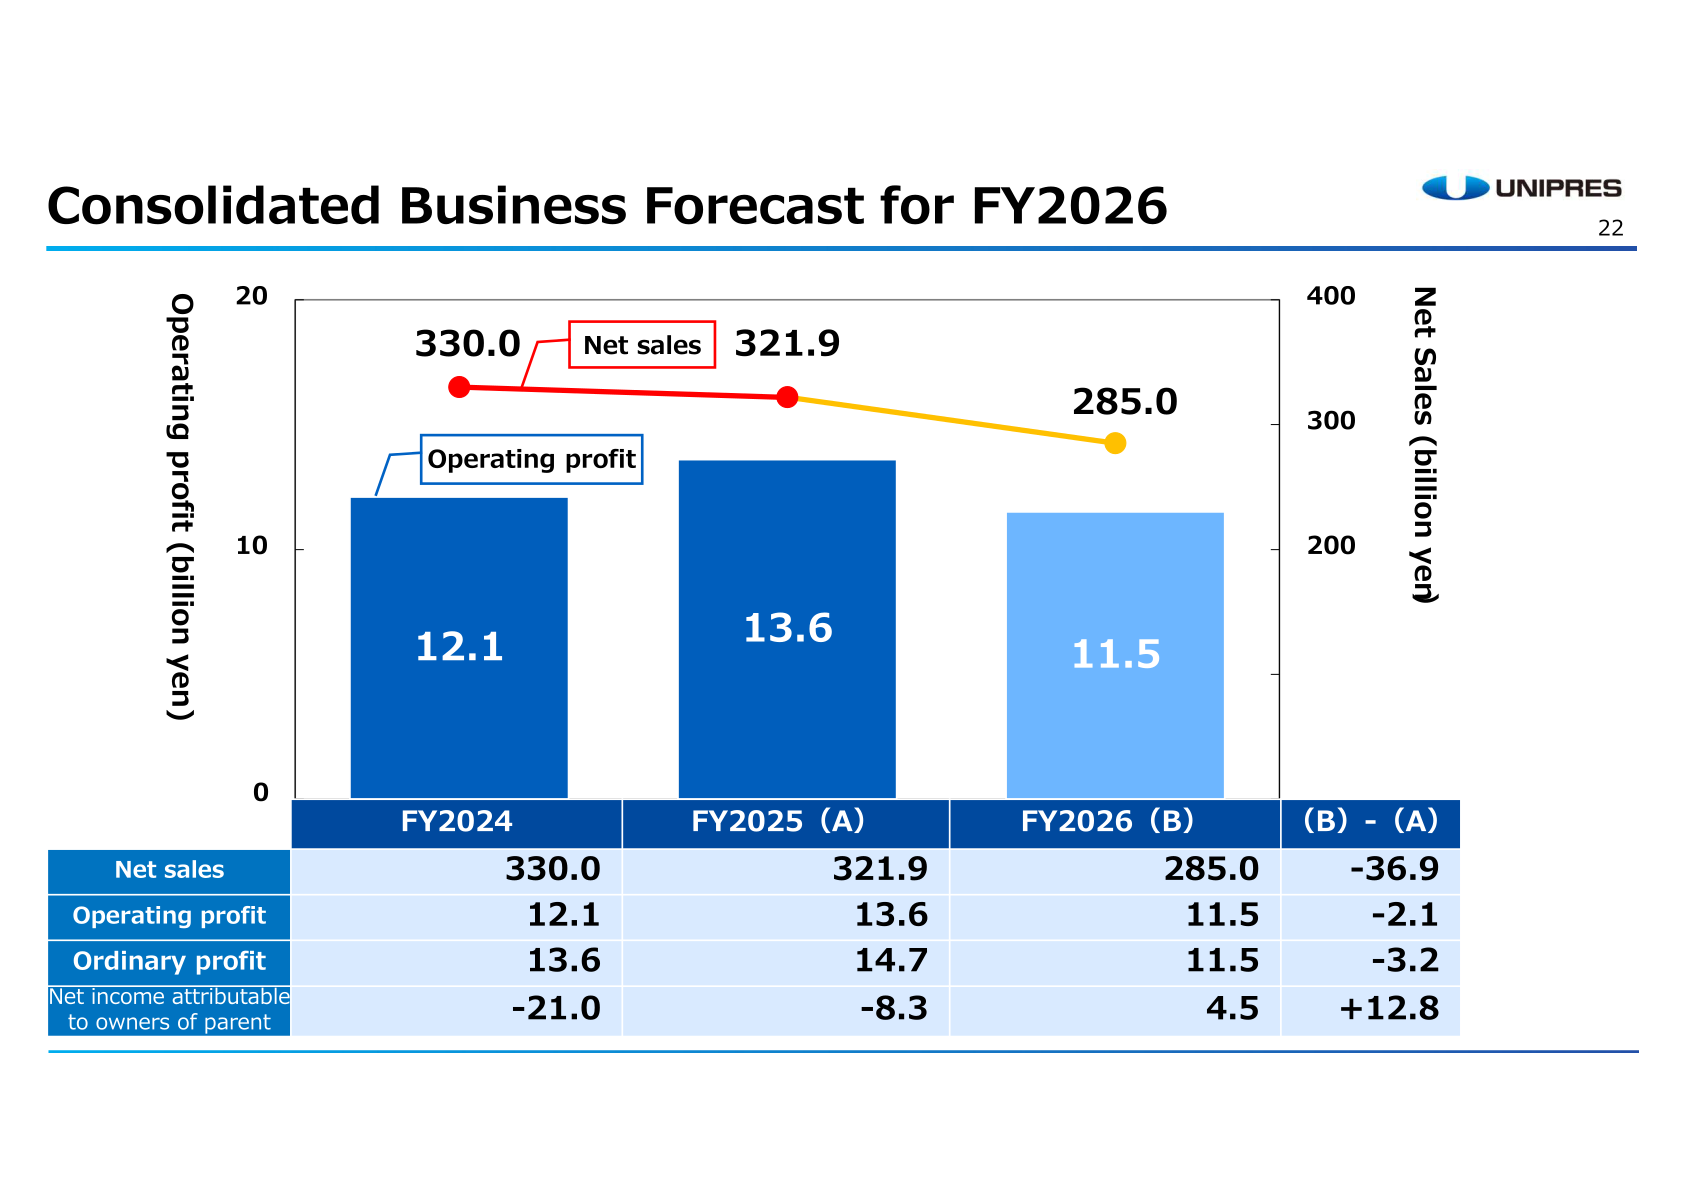
For FY2026, sales are forecast to decline due to a decrease in die sales, a stronger yen and withdrawal from certain businesses as part of structural reforms. Operating income is forecast to decrease due to lower net sales, despite the effects of cost-saving measures. Net income attributable to owners of parent is forecast at 4.5 billion yen. The forecast assumes exchange rate preconditions of 145.00 yen to the US dollar, 190.00 yen to the pound sterling, 165.00 yen to the euro, 7.90 yen to the Mexican peso, 20.50 yen to the renminbi, 1.60 yen to the Indian rupee, 4.60 yen to the Thai baht and 0.0085 yen to the Indonesian rupiah.
| Item | FY2024 | FY2025 (A) | FY2026 (B) | (B) – (A) |
|---|---|---|---|---|
| Net sales | 330.0 | 321.9 | 285.0 | -36.9 |
| Operating profit | 12.1 | 13.6 | 11.5 | -2.1 |
| Ordinary profit | 13.6 | 14.7 | 11.5 | -3.2 |
| Net income attributable to owners of parent | -21.0 | -8.3 | 4.5 | +12.8 |
By product group, car body press products are forecast at 258.1 billion yen (90.6% of sales, -28.1 billion yen), precision press products at 21.2 billion yen (7.4%, -8.3 billion yen), plastic press products at 4.2 billion yen (1.5%, -0.3 billion yen) and other at 1.5 billion yen (0.5%, -0.2 billion yen). Capital investment is planned at 15.9 billion yen, a 6.6 billion yen increase from the previous year, while depreciation/amortization is projected to decrease by 1.0 billion yen to 16.2 billion yen.
Shareholder Returns
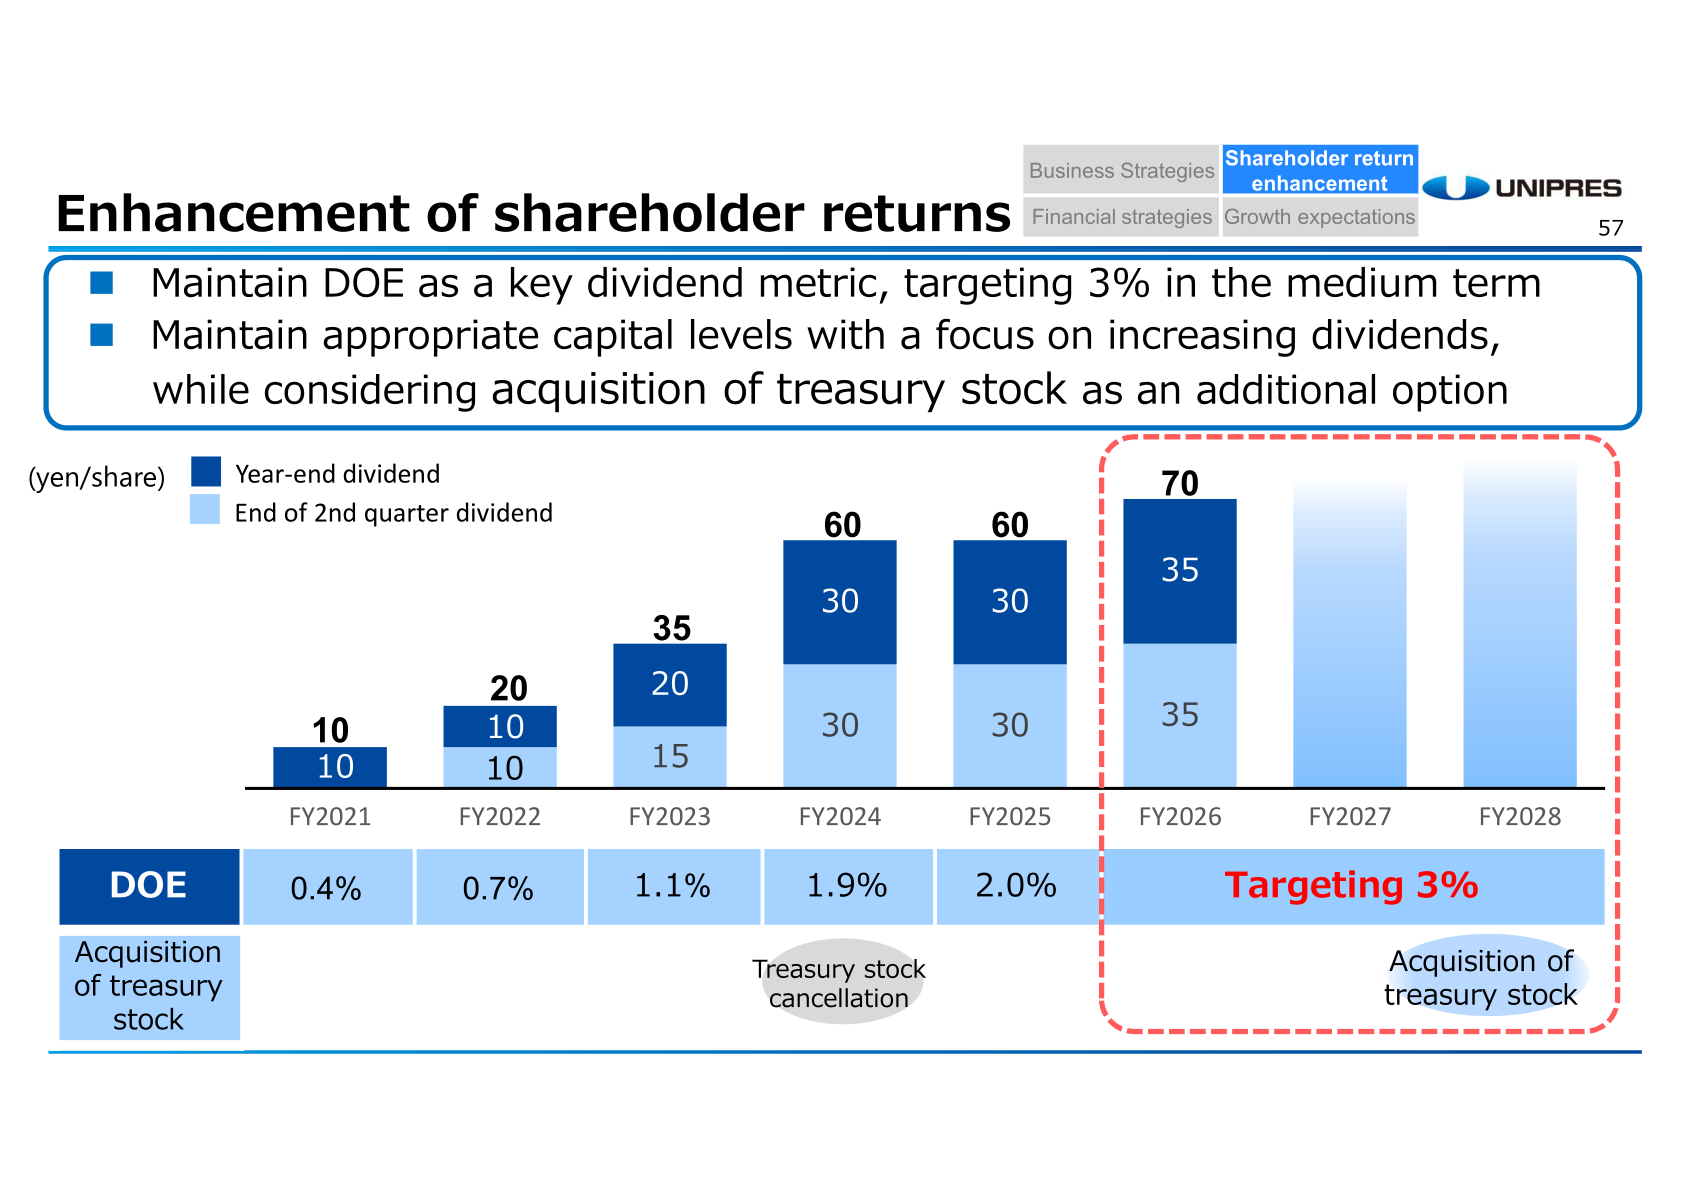
The dividend per share for FY2025 remains at 60 yen, comprising 30 yen at the end of the second quarter and 30 yen at year-end, unchanged from FY2024. The annual dividend per share for FY2026 is projected to be 70 yen (35 yen at the end of the second quarter and 35 yen at year-end). The company will maintain DOE as a key dividend metric, targeting 3% in the medium term, and will maintain appropriate capital levels with a focus on increasing dividends, while considering acquisition of treasury stock as an additional option. DOE was 0.4% in FY2021, 0.7% in FY2022, 1.1% in FY2023, 1.9% in FY2024 and 2.0% in FY2025.
| Item | FY2024 | FY2025 | FY2026 (Plan) |
|---|---|---|---|
| Dividend at end of 2nd quarter (yen/share) | 30 | 30 | 35 |
| Dividend at year-end (yen/share) | 30 | 30 | 35 |
| Annual dividend (yen/share) | 60 | 60 | 70 |
| DOE | 1.9% | 2.0% | Targeting 3% in the medium term |
FY2026-2028 Medium-term Management Policies
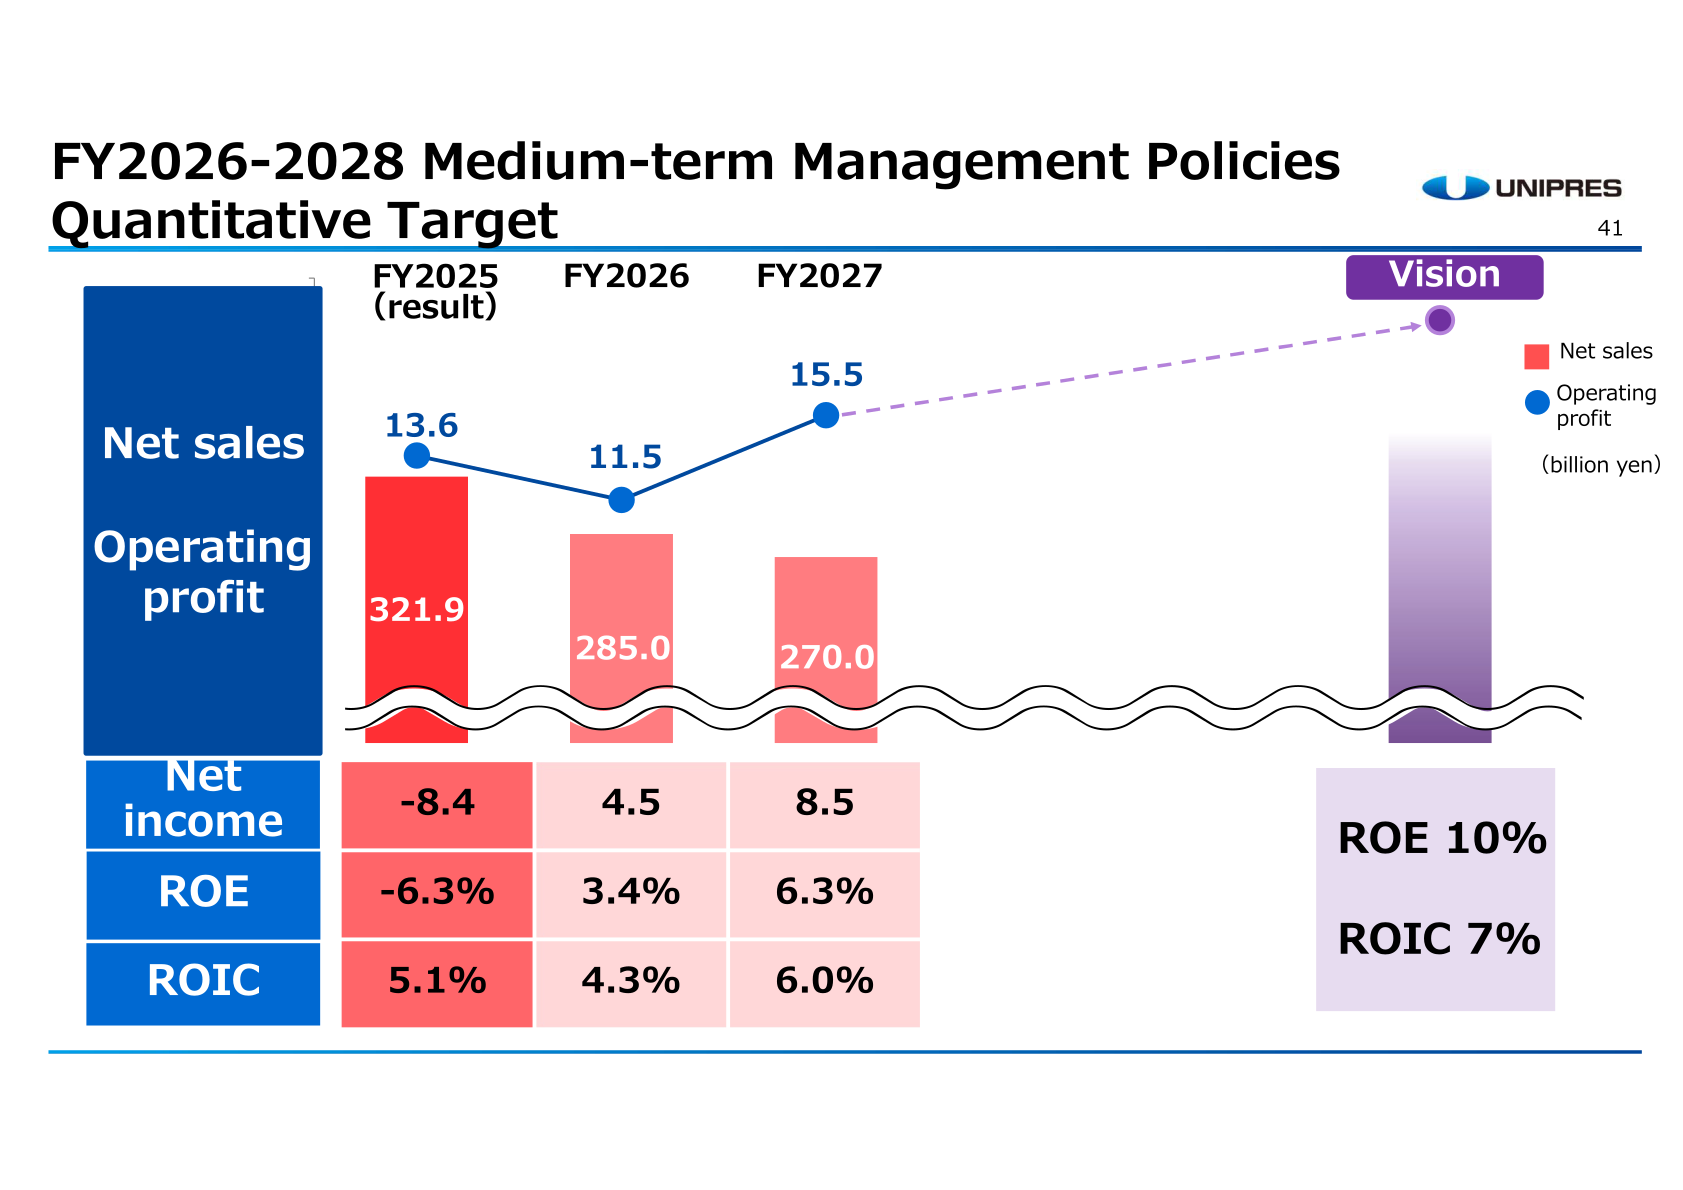
Because there are significant uncertainties regarding plans for FY2028 and beyond, quantitative targets cover FY2026 and FY2027. In FY2026 and FY2027 the company will accelerate strategic technology development and sales expansion activities for new products and fields, based on the completion of structural reforms. The Vision targets are ROE of 10% and ROIC of 7%. Note that this slide states FY2025 net income of -8.4 billion yen, whereas the consolidated results table on P.5 shows net income attributable to owners of parent of -8.3 billion yen.
| Item | FY2025 (Result) | FY2026 | FY2027 |
|---|---|---|---|
| Net sales (billion yen) | 321.9 | 285.0 | 270.0 |
| Operating profit (billion yen) | 13.6 | 11.5 | 15.5 |
| Net income (billion yen) | -8.4 | 4.5 | 8.5 |
| ROE | -6.3% | 3.4% | 6.3% |
| ROIC | 5.1% | 4.3% | 6.0% |
Under structural reform, the number of sites in China is being reduced from 7 to 3, Thailand from 1 to 0 and Brazil from 1 to 0. Completed actions include the divestiture of the Brazil business (January 2026), withdrawal from the Thailand site (March 2026), the dissolution of the hot stamping joint venture and its conversion to a wholly owned subsidiary (October 2025), consolidation of two hot stamping production sites (Guangzhou and Zhengzhou) into Guangzhou (February 2026), the divestment of a small parts production subsidiary (July 2025) and the spin-off of the die and mold business (June 2025). A Chinese precision subsidiary is slated to be divested in June 2026. In Japan, body press business sites in the Kanto region are to be reduced from 5 to 2, precision business sites from 4 to 2 and plastic business sites from 3 to 2.
On cash allocation, the cumulative total for the two years from FY2026 to FY2027 assumes operating cash flow of approximately 55 billion yen, against capital investment of 32 billion yen, R&D of 12 billion yen, shareholder returns of above 6 billion yen and repayment of borrowings, etc. of 5 billion yen. Longer-term revenue targets through core technology development are set at +30 billion yen in FY2030, +80 billion yen in FY2035 and +150 billion yen in FY2040.
This article is an analysis based on publicly available information and is not a recommendation to buy or sell any specific securities. Investment decisions are your own responsibility.
![[Obayashi] Investors’ Guide 2026 — The Complete 24-Article Breakdown](https://japan-equity.com/wp-content/uploads/2026/07/hub_cover-1024x1024.png)
![[Obayashi] IR & SR Policy — Feeding Dialogue Back into Management](https://japan-equity.com/wp-content/uploads/2026/07/p32_sq-1024x1024.jpg)
![[Obayashi] Real Estate Development — 18.7% Margin, ¥287.7bn Unrealized Gains](https://japan-equity.com/wp-content/uploads/2026/07/p20_sq-1024x1024.jpg)
![[Obayashi] Domestic Civil Engineering — Resilience Spending Supports 9.6% Margin](https://japan-equity.com/wp-content/uploads/2026/07/p11_sq-1024x1024.jpg)
![[Obayashi] Share Price & External Ratings — vs TOPIX, ESG Index Inclusion](https://japan-equity.com/wp-content/uploads/2026/07/p40_sq-1024x1024.jpg)
![[Construction] ¥75.5tn Investment, Shrinking Workforce — Big-5 Market Share](https://japan-equity.com/wp-content/uploads/2026/07/p12_sq-1024x1024.jpg)



![[Obayashi] Capital Policy & Shareholder Returns — ROE 10%+, DOE ~5%, ¥100bn Buyback](https://japan-equity.com/wp-content/uploads/2026/07/p27_sq-1024x1024.jpg)
![[Obayashi] Reducing Cross-Shareholdings — ¥285.2bn Sold in Five Years](https://japan-equity.com/wp-content/uploads/2026/07/p29_sq-1024x1024.jpg)
![[Obayashi] ¥750bn Investment Plan — ¥300bn to Development, ¥190bn to Tech/DX](https://japan-equity.com/wp-content/uploads/2026/07/p30_sq-1024x1024.jpg)
![[Obayashi] MTP2022 KPIs — Operating Profit ~2x Target, ROE 14.4%](https://japan-equity.com/wp-content/uploads/2026/07/p25_sq-1024x1024.jpg)
![[Obayashi] Cash Allocation — ¥420bn Investment CF Over Five Years](https://japan-equity.com/wp-content/uploads/2026/07/p26_sq-1024x1024.jpg)
![[Obayashi] Green Energy — 44 Plants, 344MW, and the Green Hydrogen Challenge](https://japan-equity.com/wp-content/uploads/2026/07/p21_sq-1024x1024.jpg)
![[Obayashi] Tackling the Labor Shortage — Robotics Construction®](https://japan-equity.com/wp-content/uploads/2026/07/p14_sq-1024x1024.jpg)
