
This article is based on publicly available IR materials and is not a recommendation to buy or sell any specific securities.
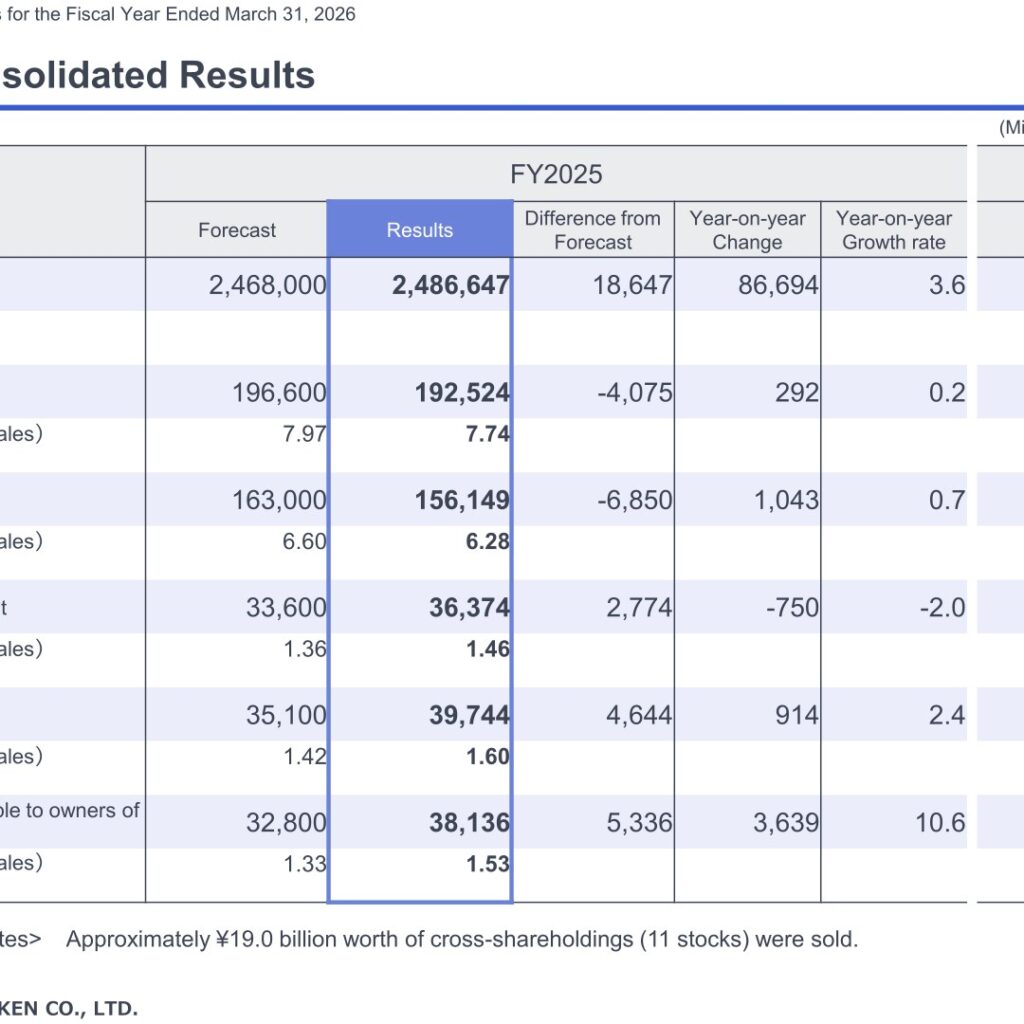
Suzuken Co., Ltd. (Stock Code: 9987) held its Financial Results Briefing on May 15, 2026 for the fiscal year ended March 31, 2026 (FY2025). Consolidated net sales rose 3.6% year on year to 2,486,647 million yen, exceeding the company’s forecast of 2,468,000 million yen by 18,647 million yen, driven by growth in new and existing specialty drug distribution contracts. Operating profit declined 2.0% to 36,374 million yen, while ordinary profit rose 2.4% to 39,744 million yen and profit attributable to owners of parent rose 10.6% to 38,136 million yen. Alongside the results, Suzuken unveiled a new three-year Medium-Term Management Plan covering FY2026 to FY2028.
Consolidated Results (Full-Year Actual)
Against the FY2025 forecast, net sales came in 18,647 million yen higher. Management attributed this to (1) growth in new and existing specialty drug distribution contracts (+103.1 billion yen), (2) a year-on-year decline in COVID-19-related product sales that was generally in line with expectations (-4.7 billion yen), and (3) the impact from profit-focused initiatives and limited-distribution products, including vaccines, handled by other distributors (-79.8 billion yen). Operating profit exceeded the forecast by 2,774 million yen: gross profit came in 4.0 billion yen below expectation, while SG&A expenses were 6.8 billion yen lower, reflecting cost containment from productivity improvements and timing shifts in certain operating expenses.
Year on year, net sales increased 86,694 million yen, with specialty drugs contributing +134.6 billion yen against a -46.1 billion yen impact from the market contraction for COVID-19-related products and -1.8 billion yen from other items. Operating profit fell 750 million yen as SG&A expenses increased by 1.0 billion yen amid inflationary trends, including higher outsourcing costs, outweighing a 0.2 billion yen increase in gross profit. As a special note, the company sold approximately 19.0 billion yen worth of cross-shareholdings (11 stocks) during the year.
| Item (Millions of yen, %) | FY2025 Forecast | FY2025 Results | Difference from Forecast | Year-on-year Change | Year-on-year Growth rate | FY2024 Results |
|---|---|---|---|---|---|---|
| Net sales | 2,468,000 | 2,486,647 | 18,647 | 86,694 | 3.6 | 2,399,952 |
| Gross profit | 196,600 | 192,524 | -4,075 | 292 | 0.2 | 192,231 |
| (Ratio to net sales) | 7.97 | 7.74 | — | — | — | 8.01 |
| SG&A | 163,000 | 156,149 | -6,850 | 1,043 | 0.7 | 155,106 |
| (Ratio to net sales) | 6.60 | 6.28 | — | — | — | 6.46 |
| Operating profit | 33,600 | 36,374 | 2,774 | -750 | -2.0 | 37,125 |
| (Ratio to net sales) | 1.36 | 1.46 | — | — | — | 1.55 |
| Ordinary profit | 35,100 | 39,744 | 4,644 | 914 | 2.4 | 38,830 |
| (Ratio to net sales) | 1.42 | 1.60 | — | — | — | 1.62 |
| Profit attributable to owners of parent | 32,800 | 38,136 | 5,336 | 3,639 | 10.6 | 34,496 |
| (Ratio to net sales) | 1.33 | 1.53 | — | — | — | 1.44 |
Segment Results
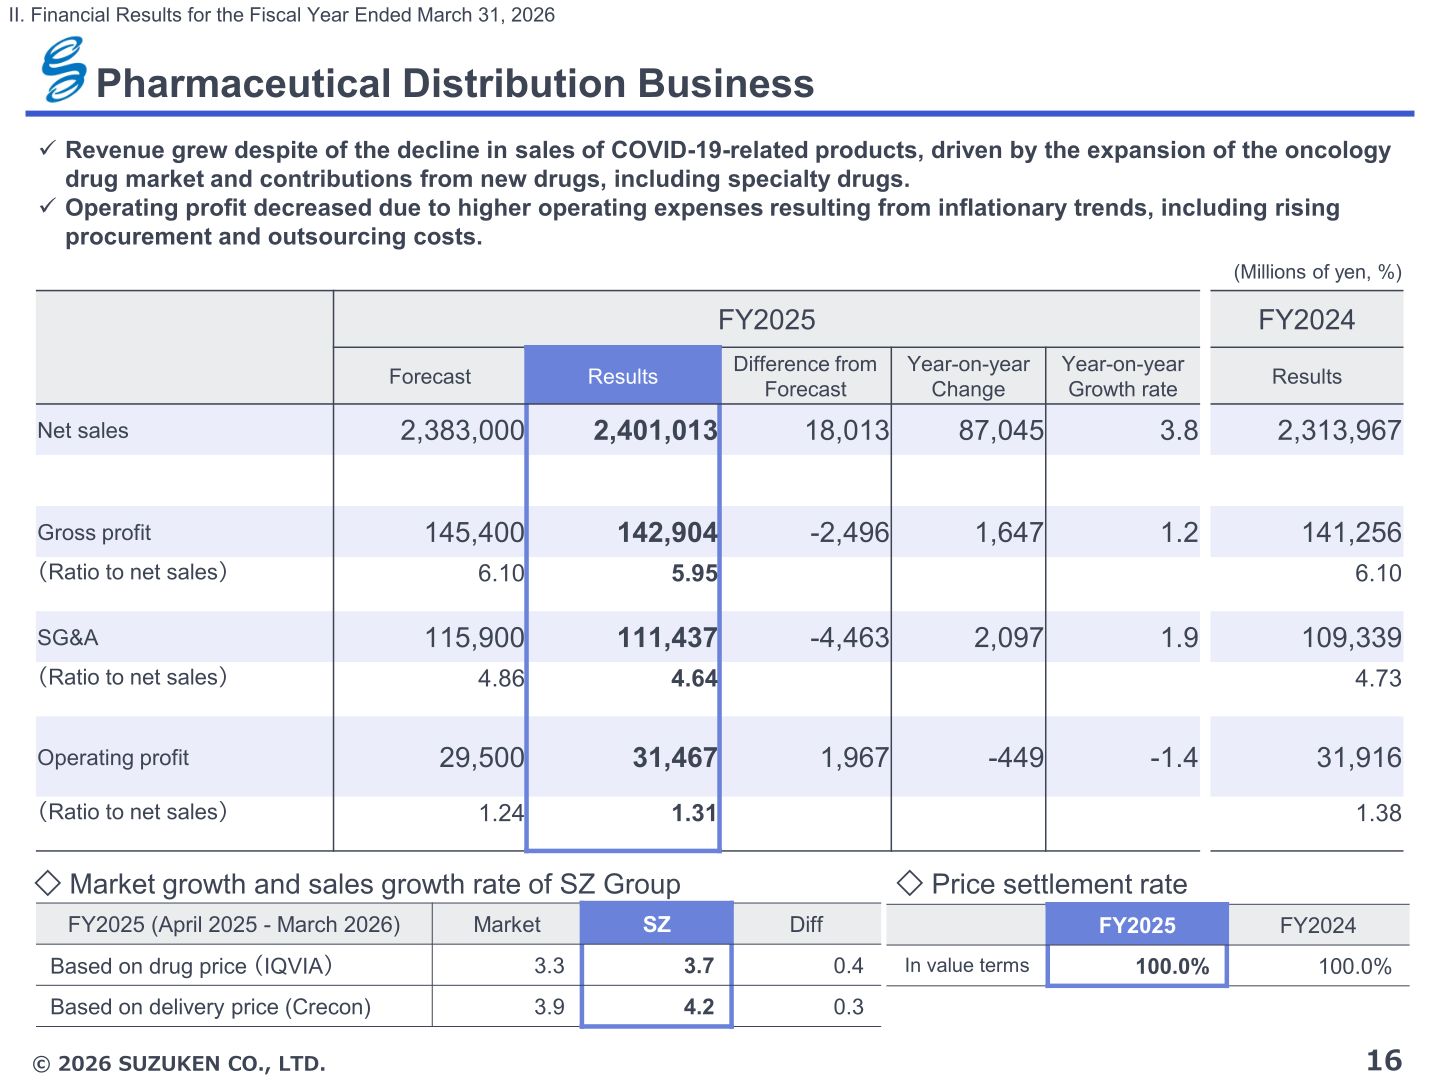
The Pharmaceutical Distribution Business, which accounts for the bulk of group sales, posted net sales of 2,401,013 million yen (up 3.8% year on year) and operating profit of 31,467 million yen (down 1.4%). Revenue grew despite the decline in sales of COVID-19-related products, driven by the expansion of the oncology drug market and contributions from new drugs, including specialty drugs, while operating profit decreased due to higher operating expenses resulting from inflationary trends, including rising procurement and outsourcing costs. For FY2025 (April 2025 to March 2026), Suzuken’s growth rate was 3.7% on a drug-price basis (IQVIA) versus market growth of 3.3%, and 4.2% on a delivery-price basis (Crecon) versus 3.9% for the market. The price settlement rate in value terms was 100.0%, unchanged from FY2024.
COVID-19-related sales in the Pharmaceutical Distribution Business fell 48.2% to 49,583 million yen from 95,770 million yen, comprising diagnostic tests of 12,725 million yen, therapeutic drugs of 29,125 million yen and vaccines of 7,731 million yen. Excluding COVID-19-related products, segment net sales rose 6.0% to 2,351,430 million yen and operating profit rose 15.9% to 26,956 million yen, securing an operating margin of 1%.
Among the other segments, the Specialty Drug Contract Distribution Business grew sharply, with net sales up 47.6% to 436,100 million yen and operating profit up 36.5% to 1,155 million yen, driven by market expansion of existing contracted products and the addition of new products; the number of client companies reached 40 and contracted items 81 in FY2025. The Healthcare Product Development Business saw net sales fall 1.9% to 51,636 million yen and operating profit fall 56.6% to 830 million yen, mainly on the impact of drug price revisions and increased R&D investment. The Community Healthcare and Nursing Care Support Business recorded net sales of 93,937 million yen (down 0.5%) but operating profit up 20.0% to 1,549 million yen, helped by SG&A optimization; the number of group pharmacy stores was 515, down 19 year on year. The Healthcare-Related Services Business posted net sales of 42,964 million yen (up 1.8%) and operating profit of 1,276 million yen (up 21.6%).
| Segment (Millions of yen) | Metric | FY2025 | FY2024 | Year-on-year Growth rate (%) |
|---|---|---|---|---|
| Pharmaceutical Distribution Business | Net sales | 2,401,013 | 2,313,967 | 3.8 |
| Pharmaceutical Distribution Business | Operating profit | 31,467 | 31,916 | -1.4 |
| Healthcare Product Development Business | Net sales | 51,636 | 52,613 | -1.9 |
| Healthcare Product Development Business | Operating profit | 830 | 1,916 | -56.6 |
| Community Healthcare and Nursing Care Support Business | Net sales | 93,937 | 94,414 | -0.5 |
| Community Healthcare and Nursing Care Support Business | Operating profit | 1,549 | 1,291 | 20.0 |
| Specialty Drug Contract Distribution Business | Net sales | 436,100 | 295,485 | 47.6 |
| Specialty Drug Contract Distribution Business | Operating profit | 1,155 | 845 | 36.5 |
| Healthcare-Related Services Business | Net sales | 42,964 | 42,188 | 1.8 |
| Healthcare-Related Services Business | Operating profit | 1,276 | 1,049 | 21.6 |
FY2026 Forecast
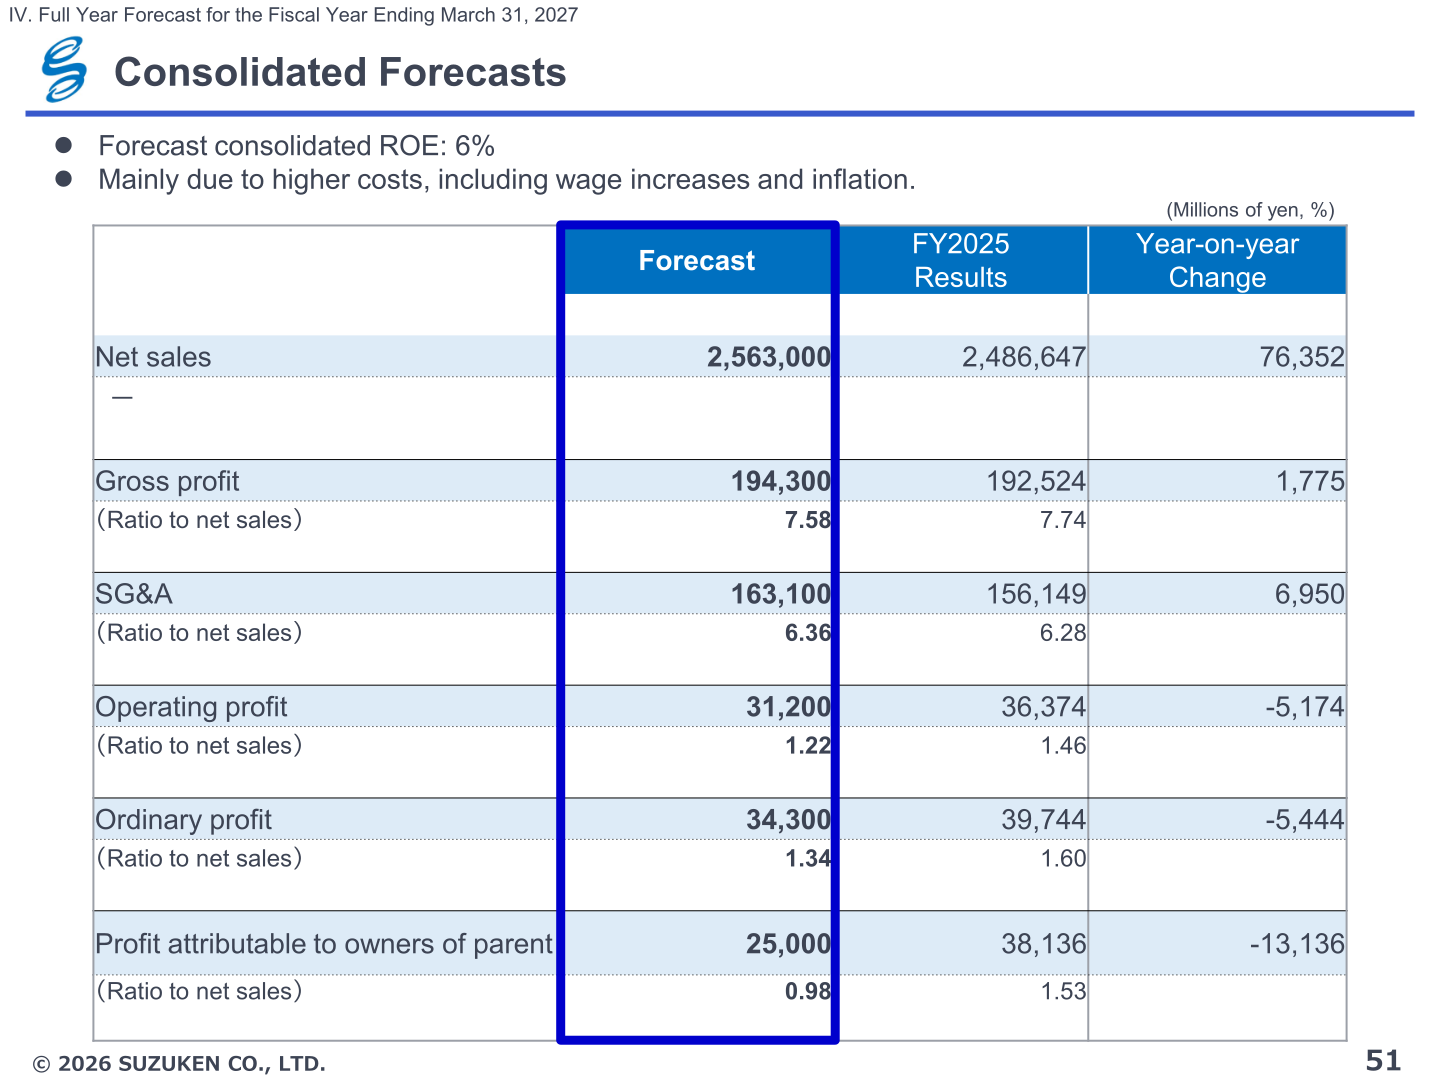
For the fiscal year ending March 31, 2027 (FY2026), Suzuken forecasts consolidated net sales of 2,563,000 million yen, up 76,352 million yen from FY2025. Gross profit is expected to rise 1,775 million yen to 194,300 million yen, but operating profit is forecast to fall 5,174 million yen to 31,200 million yen and ordinary profit to fall 5,444 million yen to 34,300 million yen, mainly due to higher costs including wage increases and inflation. Profit attributable to owners of parent is forecast at 25,000 million yen, down 13,136 million yen. Forecast consolidated ROE is 6%.
| Item (Millions of yen, %) | FY2026 Forecast | FY2025 Results | Year-on-year Change |
|---|---|---|---|
| Net sales | 2,563,000 | 2,486,647 | 76,352 |
| Gross profit | 194,300 | 192,524 | 1,775 |
| (Ratio to net sales) | 7.58 | 7.74 | — |
| SG&A | 163,100 | 156,149 | 6,950 |
| (Ratio to net sales) | 6.36 | 6.28 | — |
| Operating profit | 31,200 | 36,374 | -5,174 |
| (Ratio to net sales) | 1.22 | 1.46 | — |
| Ordinary profit | 34,300 | 39,744 | -5,444 |
| (Ratio to net sales) | 1.34 | 1.60 | — |
| Profit attributable to owners of parent | 25,000 | 38,136 | -13,136 |
| (Ratio to net sales) | 0.98 | 1.53 | — |
Suzuken also reorganized its reporting segments from FY2026, creating a Digital Business Segment and a Logistics Segment. Forecast net sales and operating profit by new segment are: Pharmaceutical Distribution 2,468,000 million yen and 28,300 million yen; Digital 5,900 million yen and an operating loss of 1,150 million yen (reflecting the inclusion of medimo, which became a subsidiary in February); Logistics 60,200 million yen and 1,500 million yen; Healthcare Product Development 52,400 million yen and 600 million yen; Community Healthcare and Nursing Care Support 95,400 million yen and 1,100 million yen; and Other Operations 5,700 million yen and 100 million yen. Within the Pharmaceutical Distribution segment, specialty drug net sales are forecast at 497,680 million yen in FY2026 versus 436,560 million yen in FY2025. The company notes that because FY2025 results are based on the former segment classification, year-on-year comparisons for the new segments are provided for reference purposes only.
Shareholder Returns
Under the previous medium-term plan, the Suzuken Group’s basic policy was to maintain stable dividends and to return profits with an average total payout ratio of 100% or more over the three-year period ending March 31, 2026. FY2025 dividends were 50 yen interim and 50 yen year-end, for a full-year 100 yen, with total dividends of 6,877 million yen and share repurchases of 25,999 million yen against net profit of 38,136 million yen, giving a total payout ratio of 86.2%. The three-year average total payout ratio was 98.1% (FY2023: 108.3%, FY2024: 102.8%, FY2025: 86.2%). Total share repurchases over the three years of the plan came to approximately 79 billion yen.
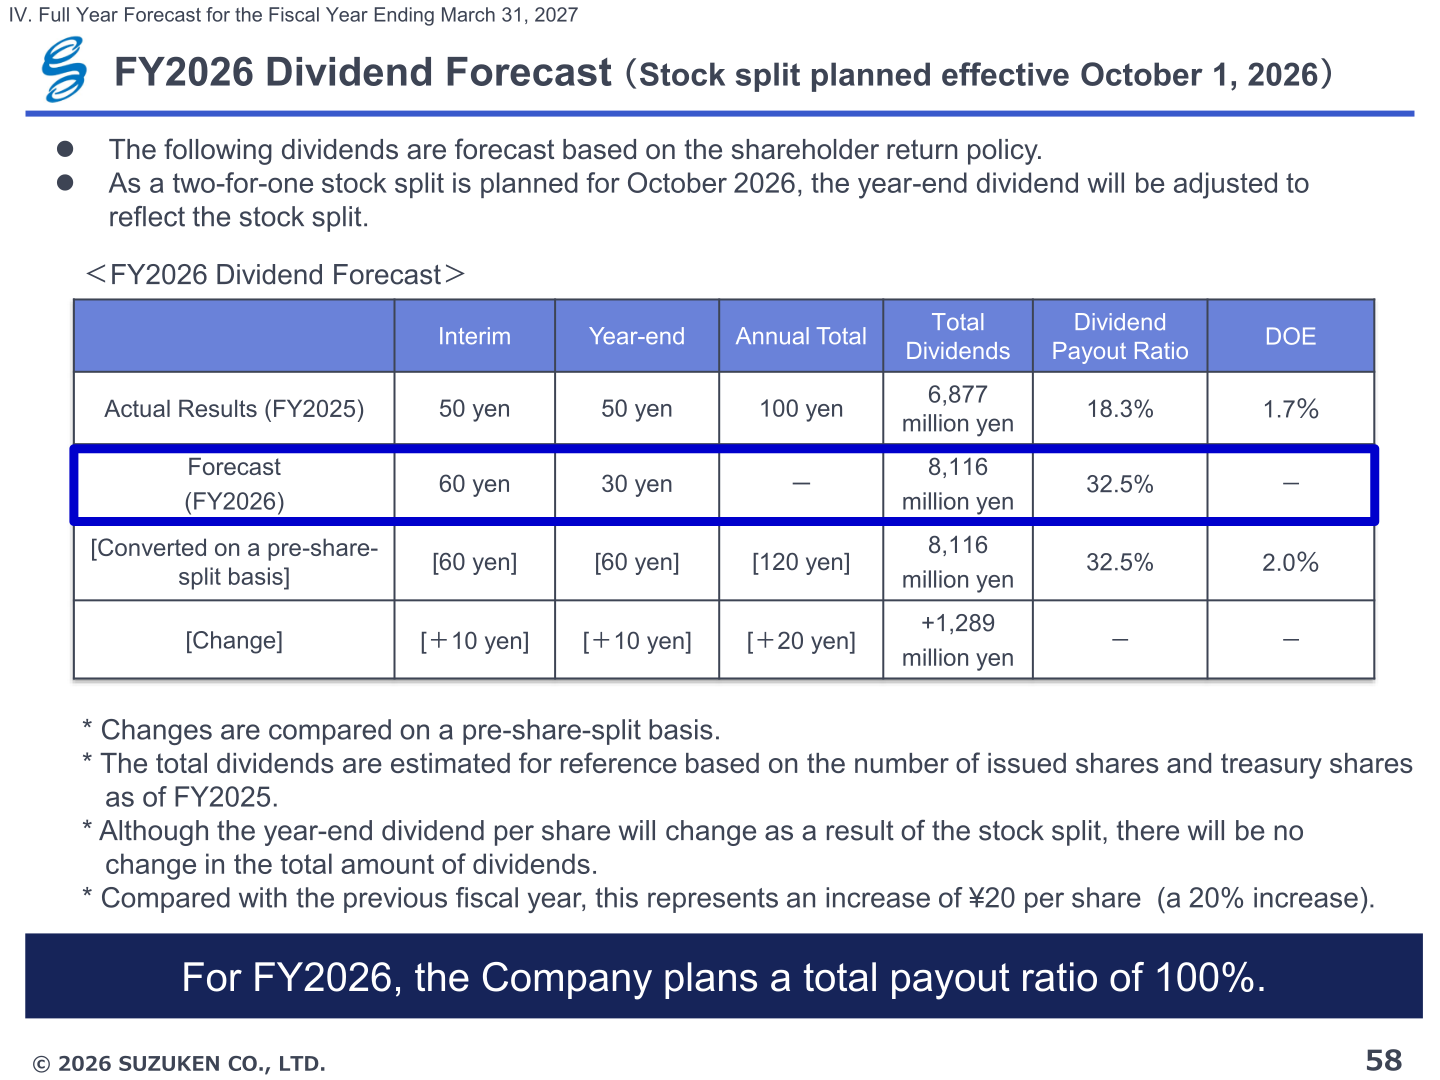
For FY2026, the company plans a total payout ratio of 100%. A two-for-one stock split is planned effective October 1, 2026, so the year-end dividend will be adjusted to reflect the split: the forecast is 60 yen interim and 30 yen year-end, equivalent to 60 yen and 60 yen (120 yen annual) on a pre-share-split basis, an increase of 20 yen per share (a 20% increase) versus FY2025. Total dividends are estimated at 8,116 million yen, up 1,289 million yen, for a dividend payout ratio of 32.5% and a DOE of 2.0% on a pre-share-split basis.
| Item | Interim | Year-end | Annual Total | Total Dividends | Dividend Payout Ratio | DOE |
|---|---|---|---|---|---|---|
| Actual Results (FY2025) | 50 yen | 50 yen | 100 yen | 6,877 million yen | 18.3% | 1.7% |
| Forecast (FY2026) | 60 yen | 30 yen | — | 8,116 million yen | 32.5% | — |
| [Converted on a pre-share-split basis] | [60 yen] | [60 yen] | [120 yen] | 8,116 million yen | 32.5% | 2.0% |
| [Change] | [+10 yen] | [+10 yen] | [+20 yen] | +1,289 million yen | — | — |
Medium-Term Plan and Topics
Reviewing the previous three-year plan, Suzuken reported that its key management indicators generally reached target levels. ROE was 7.0% in FY2023, 8.4% in FY2024 and 9.3% in FY2025 against a target of 5.0% or more each year. The consolidated operating profit margin was 1.46% in FY2025 versus a target of 1.5% or more, with the Distribution segment at 1.31% versus a target of 1.0% or more. Three-year cumulative investment reached 66.7 billion yen against a target of 100 billion yen or more on an approval basis. Cross-shareholdings stood at 12.4% of consolidated net assets at the end of FY2025 versus a 10.0% or less target, with approximately 19.0 billion yen sold (11 stocks) during the year; the shortfall was attributed to the rise in stock prices of shares held.
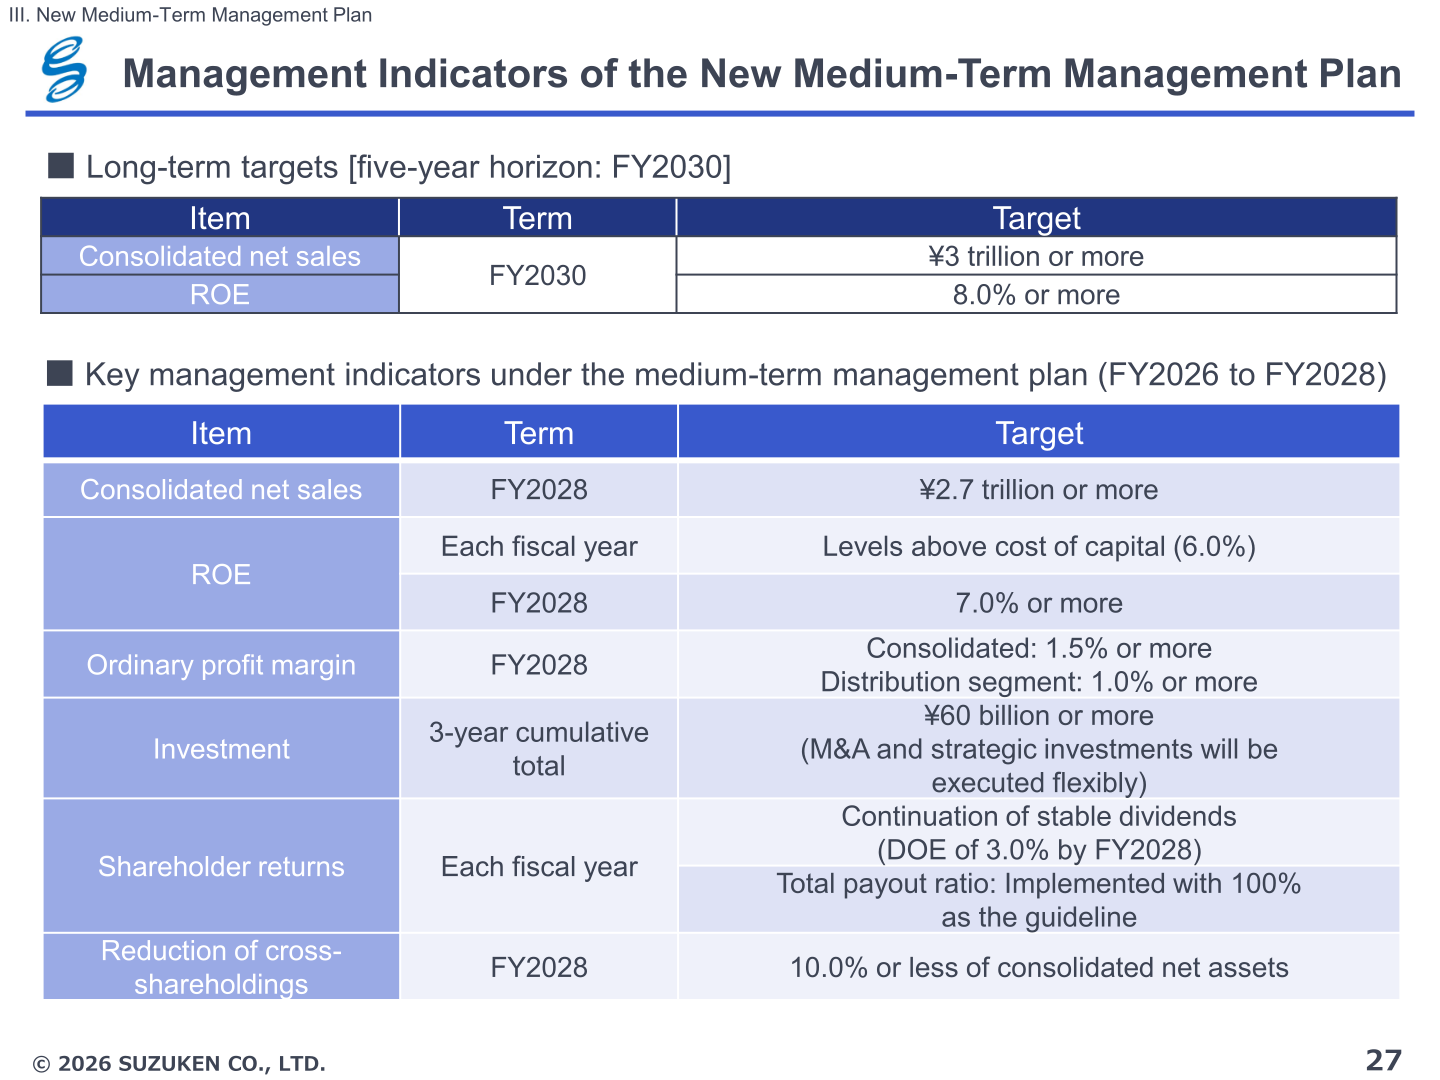
The new Medium-Term Management Plan (FY2026 to FY2028), themed “Change makes Challenge / Challenge makes Change,” sets long-term targets for FY2030 of consolidated net sales of 3 trillion yen or more and ROE of 8.0% or more. For FY2028 the plan targets consolidated net sales of 2.7 trillion yen or more, ROE of 7.0% or more (and levels above the 6.0% cost of capital each year), an ordinary profit margin of 1.5% or more on a consolidated basis and 1.0% or more for the Distribution segment, three-year cumulative investment of 60 billion yen or more, continuation of stable dividends with a DOE of 3.0% by FY2028 and a total payout ratio implemented with 100% as the guideline, and cross-shareholdings of 10.0% or less of consolidated net assets. Consolidated ordinary profit of 40 billion yen or more is targeted for FY2028, of which 32 billion yen or more from the Pharmaceutical Distribution Business Segment and 3 billion yen or more from the new Digital Business Segment.
This article is an analysis based on publicly available information and is not a recommendation to buy or sell any specific securities. Investment decisions are your own responsibility.
![[Obayashi] Investors’ Guide 2026 — The Complete 24-Article Breakdown](https://japan-equity.com/wp-content/uploads/2026/07/hub_cover-1024x1024.png)
![[Obayashi] IR & SR Policy — Feeding Dialogue Back into Management](https://japan-equity.com/wp-content/uploads/2026/07/p32_sq-1024x1024.jpg)
![[Obayashi] Real Estate Development — 18.7% Margin, ¥287.7bn Unrealized Gains](https://japan-equity.com/wp-content/uploads/2026/07/p20_sq-1024x1024.jpg)
![[Obayashi] Domestic Civil Engineering — Resilience Spending Supports 9.6% Margin](https://japan-equity.com/wp-content/uploads/2026/07/p11_sq-1024x1024.jpg)
![[Obayashi] Share Price & External Ratings — vs TOPIX, ESG Index Inclusion](https://japan-equity.com/wp-content/uploads/2026/07/p40_sq-1024x1024.jpg)
![[Construction] ¥75.5tn Investment, Shrinking Workforce — Big-5 Market Share](https://japan-equity.com/wp-content/uploads/2026/07/p12_sq-1024x1024.jpg)



![[Obayashi] Capital Policy & Shareholder Returns — ROE 10%+, DOE ~5%, ¥100bn Buyback](https://japan-equity.com/wp-content/uploads/2026/07/p27_sq-1024x1024.jpg)
![[Obayashi] Reducing Cross-Shareholdings — ¥285.2bn Sold in Five Years](https://japan-equity.com/wp-content/uploads/2026/07/p29_sq-1024x1024.jpg)
![[Obayashi] ¥750bn Investment Plan — ¥300bn to Development, ¥190bn to Tech/DX](https://japan-equity.com/wp-content/uploads/2026/07/p30_sq-1024x1024.jpg)
![[Obayashi] MTP2022 KPIs — Operating Profit ~2x Target, ROE 14.4%](https://japan-equity.com/wp-content/uploads/2026/07/p25_sq-1024x1024.jpg)
![[Obayashi] Cash Allocation — ¥420bn Investment CF Over Five Years](https://japan-equity.com/wp-content/uploads/2026/07/p26_sq-1024x1024.jpg)
![[Obayashi] Green Energy — 44 Plants, 344MW, and the Green Hydrogen Challenge](https://japan-equity.com/wp-content/uploads/2026/07/p21_sq-1024x1024.jpg)
![[Obayashi] Tackling the Labor Shortage — Robotics Construction®](https://japan-equity.com/wp-content/uploads/2026/07/p14_sq-1024x1024.jpg)
