
This article is based on publicly available IR materials and is not a recommendation to buy or sell any specific securities.
Note: The company labels the fiscal year covered here as “FY2026/3 (April 1, 2025 – March 31, 2026)”; in line with our site’s convention the title and URL classify the most recent completed fiscal year as FY2025, while every figure, table and year label below follows the company’s materials.
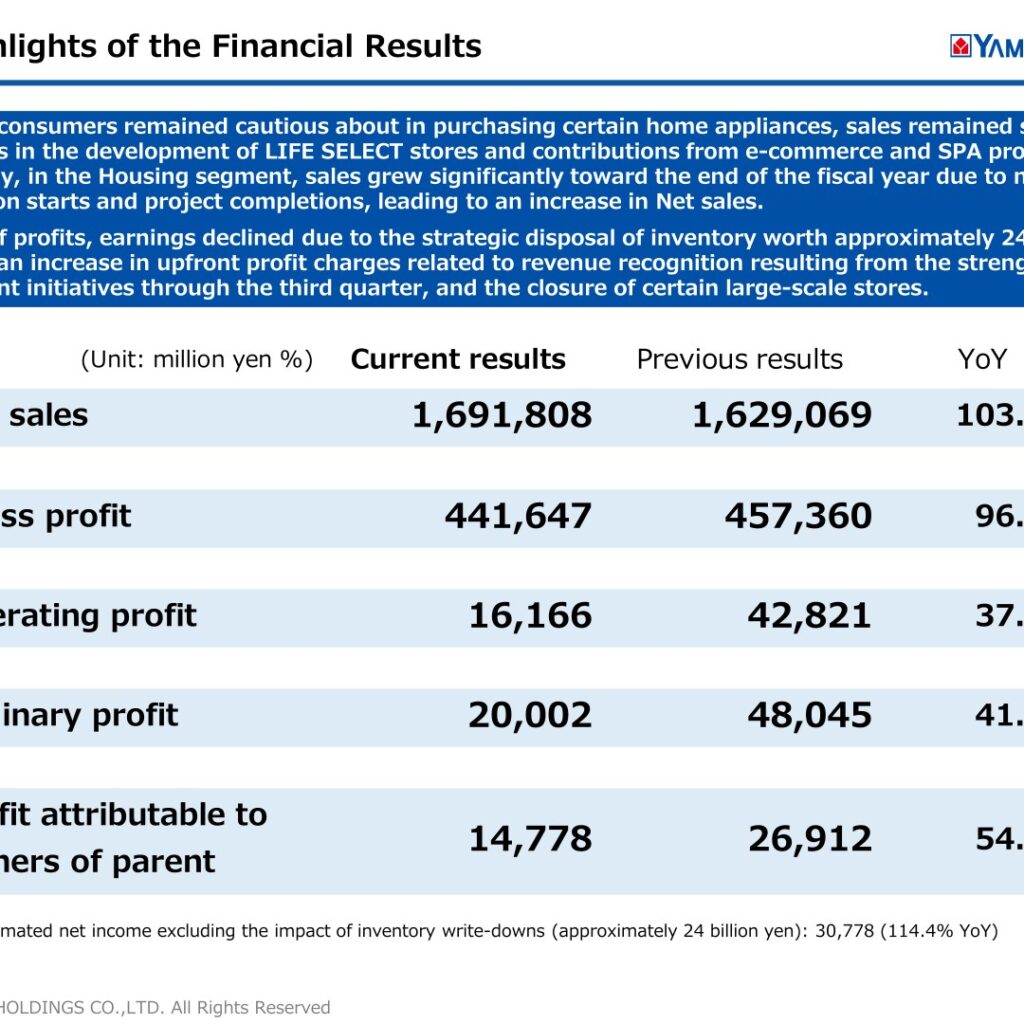
YAMADA HOLDINGS CO., LTD. reported net sales of 1,691,808 million yen (103.9% year on year), operating profit of 16,166 million yen (37.8%), ordinary profit of 20,002 million yen (41.6%) and profit attributable to owners of parent of 14,778 million yen (54.9%) for FY2026/3. The presentation states that although consumers remained cautious about purchasing certain home appliances, sales remained strong thanks to progress in the development of LIFE SELECT stores and contributions from e-commerce and SPA products, and that in the Housing segment sales grew significantly toward the end of the fiscal year due to new construction starts and project completions. On profits, the company attributes the decline to the strategic disposal of inventory worth approximately 24 billion yen, an increase in upfront profit charges related to revenue recognition resulting from the strengthening of loyalty point initiatives through the third quarter, and the closure of certain large-scale stores. A note on the same slide gives estimated net income excluding the impact of inventory write-downs (approximately 24 billion yen) of 30,778 (114.4% YoY).
Consolidated Results (Full-Year Actual)
The consolidated profit and loss summary for FY2026/3, with the prior fiscal year shown as “Previous results”, is set out below. Figures are in million yen and the YoY column is stated as a percentage of the prior year, as presented in the materials.
| Item (million yen) | Current results | Previous results | YoY (%) |
|---|---|---|---|
| Net sales | 1,691,808 | 1,629,069 | 103.9 |
| Gross profit | 441,647 | 457,360 | 96.6 |
| SG&A expenses | 425,481 | 414,539 | 102.6 |
| Operating profit | 16,166 | 42,821 | 37.8 |
| Ordinary profit | 20,002 | 48,045 | 41.6 |
| Profit attributable to owners of parent | 14,778 | 26,912 | 54.9 |
The quarterly breakdown shows that the swing came in the final quarter. Fourth-quarter (January to March) net sales rose to 483,766 million yen (111.1% YoY), but gross profit fell to 95,179 million yen (84.6%) and the quarter posted an operating result of △ 18,888 million yen against operating profit of 3,489 million yen a year earlier, with profit attributable to owners of parent of △ 7,424 million yen. Fourth-quarter extraordinary income was 11,071 million yen against 412 million yen a year earlier.
By product division, net sales of personal computers were 115,961 million yen (121.4% YoY) and mobile phones 162,251 million yen (112.4%), while housing-related sales reached 368,926 million yen (111.9%) and AV software, GMS, etc. 83,685 million yen (121.4%). Among home appliances, television sales were 82,864 million yen (93.2%), refrigerators 103,769 million yen (91.1%) and washing machines 107,596 million yen (94.3%). The materials note that 41 stores were closed from April 2025 to the end of March 2026, with an impact on total sales across all YAMADA DENKI stores of approximately 1.5%.
On the balance sheet, total assets stood at 1,303,905 million yen as of March 31, 2026 against 1,324,980 million yen a year earlier; merchandise and finished goods fell to 316,151 million yen, a change of △ 20,509 million yen, reflecting the strategic inventory disposal, while real estate for sale rose to 64,072 million yen as the company strengthened land acquisition for its ready-built home business. Interest-bearing debt was reduced to 309,641 million yen from 325,553 million yen.
Segment Results
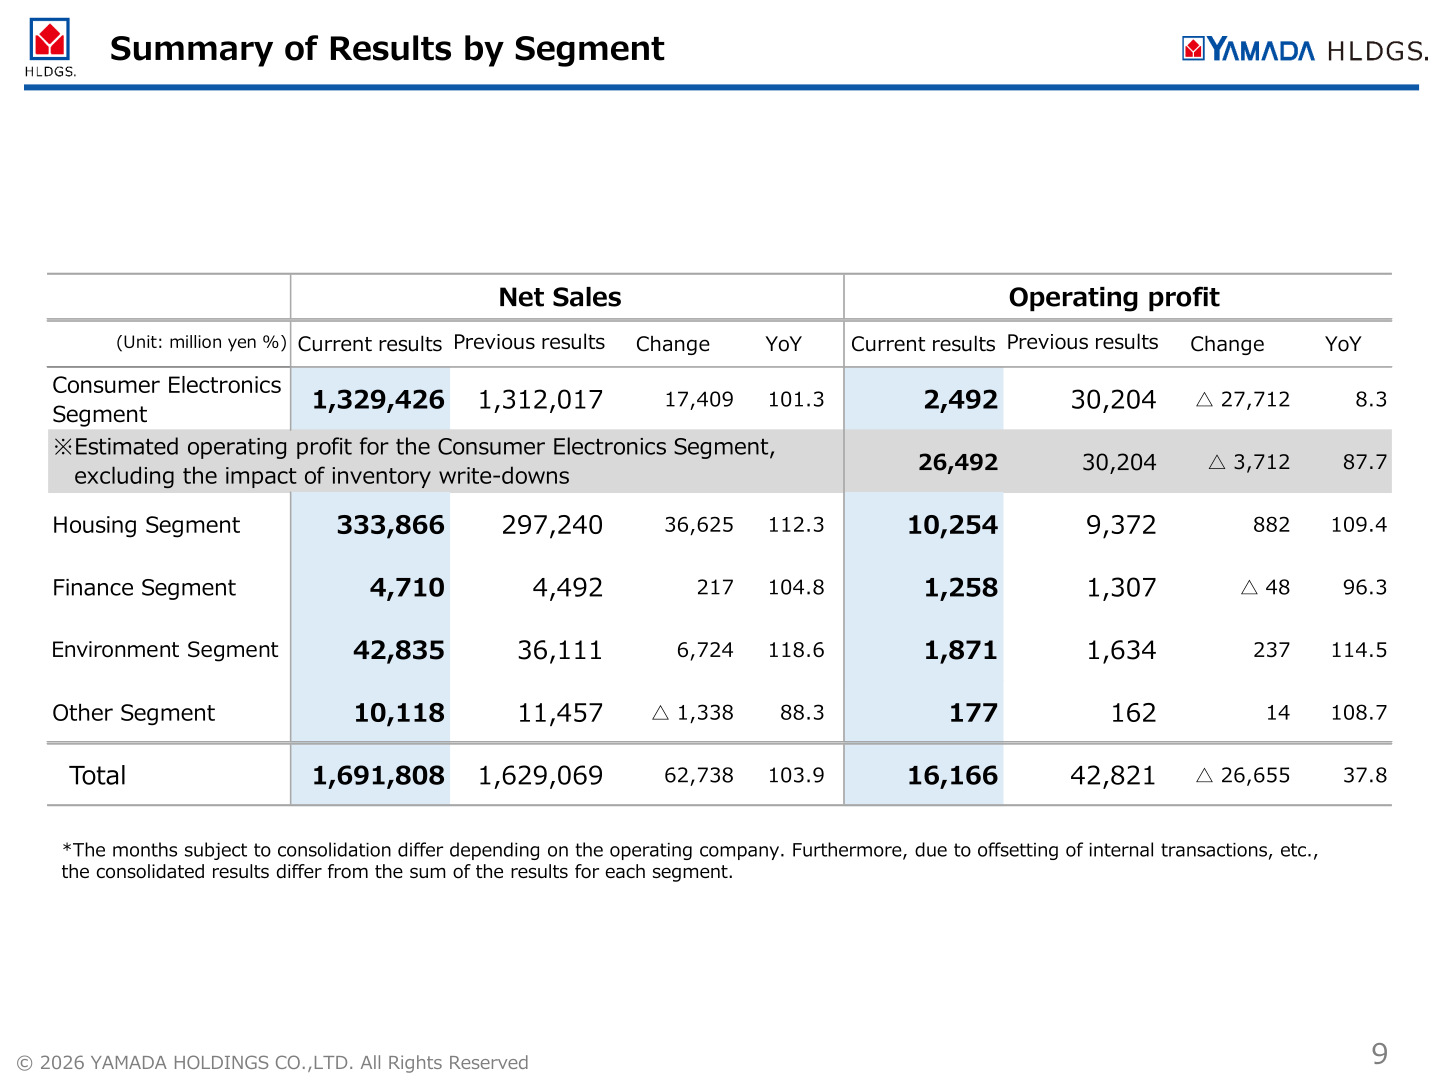
The group reports the Consumer Electronics, Housing, Finance, Environment and Other segments. The Consumer Electronics Segment carried the impact of the inventory disposal: its operating profit fell to 2,492 million yen (8.3% YoY), and the materials separately present estimated operating profit for that segment excluding the impact of inventory write-downs of 26,492 million yen (87.7% YoY). The materials caution that the months subject to consolidation differ depending on the operating company and that, due to offsetting of internal transactions and other factors, the consolidated results differ from the sum of the results for each segment.
| Segment (million yen) | Net sales (Current) | Net sales (Previous) | Net sales YoY (%) | Operating profit (Current) | Operating profit (Previous) | Operating profit YoY (%) |
|---|---|---|---|---|---|---|
| Consumer Electronics Segment | 1,329,426 | 1,312,017 | 101.3 | 2,492 | 30,204 | 8.3 |
| ※Consumer Electronics Segment, estimated operating profit excluding the impact of inventory write-downs | — | — | — | 26,492 | 30,204 | 87.7 |
| Housing Segment | 333,866 | 297,240 | 112.3 | 10,254 | 9,372 | 109.4 |
| Finance Segment | 4,710 | 4,492 | 104.8 | 1,258 | 1,307 | 96.3 |
| Environment Segment | 42,835 | 36,111 | 118.6 | 1,871 | 1,634 | 114.5 |
| Other Segment | 10,118 | 11,457 | 88.3 | 177 | 162 | 108.7 |
| Total | 1,691,808 | 1,629,069 | 103.9 | 16,166 | 42,821 | 37.8 |
Within the Housing Segment, YAMADA HOMES posted net sales of 93,882 million yen (102.4% YoY) with operating profit of 589 million yen (112.7%), while the HINOKIYA Group posted net sales of 177,286 million yen (122.4%) with operating profit of 8,161 million yen (111.4%). The materials note that, due to a change in the fiscal year-end, the HINOKIYA Group’s results for the current period cover a 15-month period from January 2025 to March 2026. The company states that it steadily made up for the delays in housing construction starts and completions caused by the April 2025 legal revisions as the fiscal year came to a close, resulting in increased sales and profits.
For the Consumer Electronics Segment’s growth areas, e-commerce and TV shopping sales were 115.2 billion yen (113.1% YoY), renovation 66.2 billion yen (100.2%), furniture and interior goods 39.5 billion yen (104.0%), and PB plus SPA original products 152.2 billion yen (124.1%), lifting the PB and SPA sales composition ratio to 11.2% from 9.4%, a change of +1.8P. Overseas sales were 37.7 billion yen (106.4%), product inventory on a Yamada Denki POS basis was 284.2 billion yen against 310.7 billion yen (△ 26.5), and the number of digital members reached 31.2 million, an increase of 3.6 million.
FY2027 Forecast
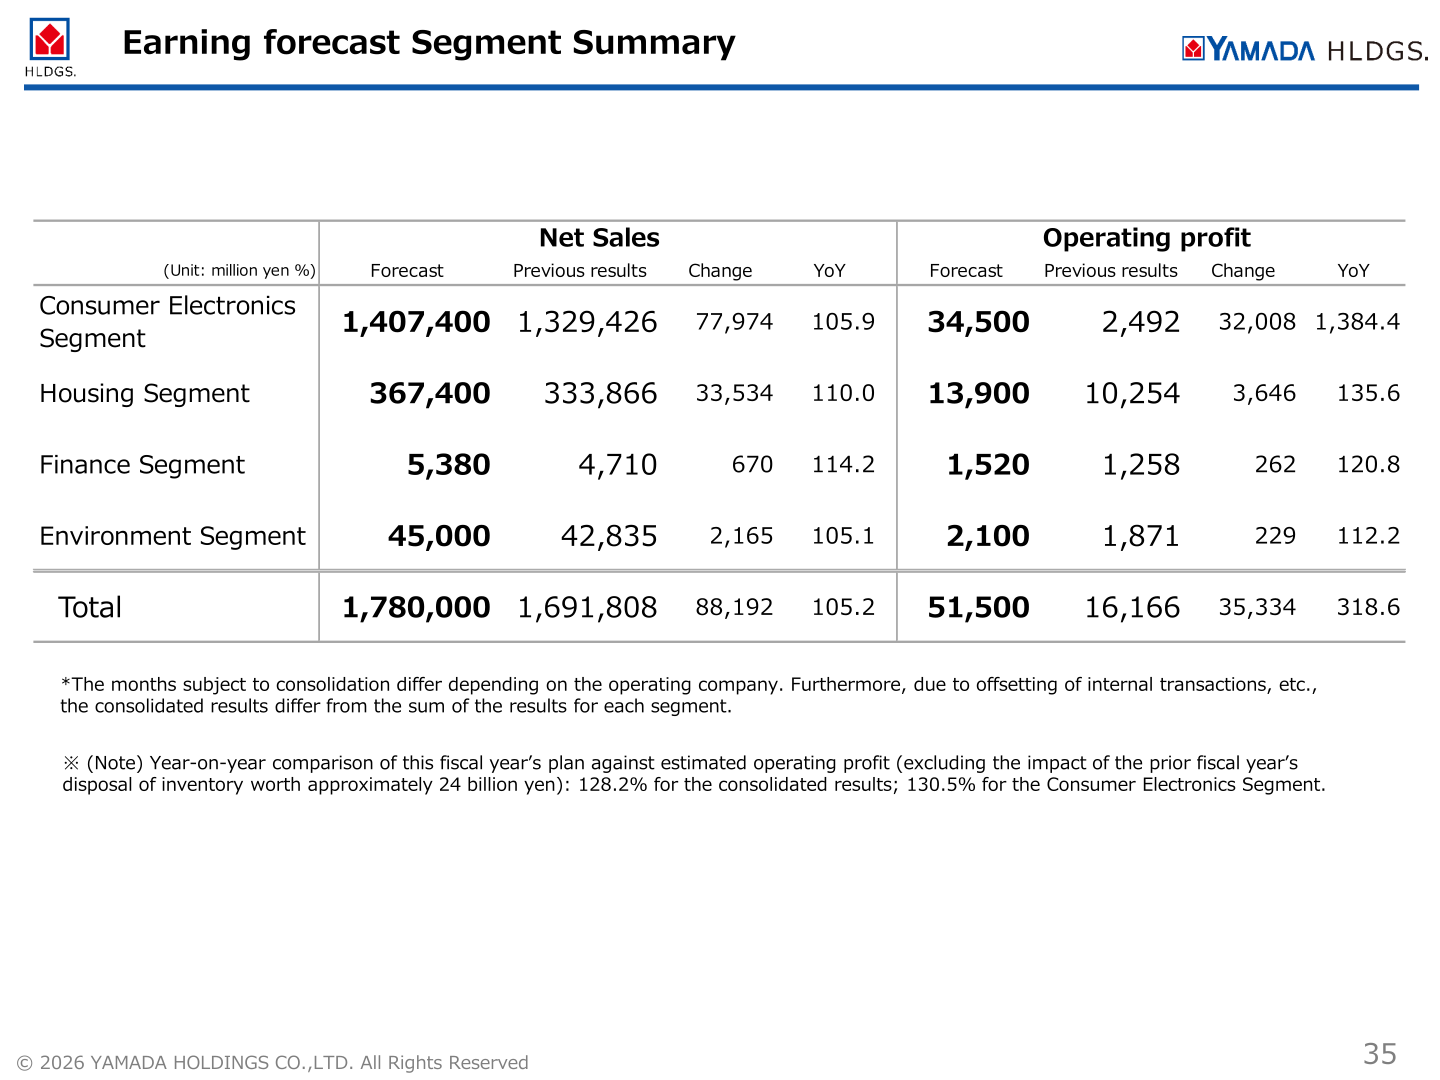
For FY2027, which the materials describe as the second year of the new five-year Mid-Term Management Plan targeting “Net sales: 2.2 trillion yen, Ordinary profit: 100 billion yen”, the company forecasts the following consolidated results.
| Item (million yen) | FY2027 Forecast | Previous results | YoY (%) |
|---|---|---|---|
| Net sales | 1,780,000 | 1,691,808 | 105.2 |
| Gross profit | 503,100 | 441,647 | 113.9 |
| SG&A expenses | 451,600 | 425,481 | 106.1 |
| Operating profit | 51,500 | 16,166 | 318.6 |
| Ordinary profit | 52,600 | 20,002 | 263.0 |
| Profit attributable to owners of parent | 27,800 | 14,778 | 188.1 |
By segment, the forecast calls for Consumer Electronics Segment net sales of 1,407,400 million yen (105.9% YoY) and operating profit of 34,500 million yen (1,384.4%), Housing Segment net sales of 367,400 million yen (110.0%) and operating profit of 13,900 million yen (135.6%), Finance Segment net sales of 5,380 million yen (114.2%) and operating profit of 1,520 million yen (120.8%), and Environment Segment net sales of 45,000 million yen (105.1%) and operating profit of 2,100 million yen (112.2%). A note states that the year-on-year comparison of this fiscal year’s plan against estimated operating profit excluding the impact of the prior fiscal year’s disposal of inventory worth approximately 24 billion yen is 128.2% for the consolidated results and 130.5% for the Consumer Electronics Segment.
The company also sets out a plan for key financial indicators, in billions of yen and percent, comparing FY2026 with FY2027.
| Indicator (billions of yen / %) | FY2026 | FY2027 | YoY |
|---|---|---|---|
| Net sales | 1,691.8 | 1,780.0 | +5.2% |
| Gross profit | 441.6 | 503.1 | +13.9% |
| Gross profit margin | 26.1 | 28.3 | +2.2P |
| Ordinary profit | 20.0 | 52.6 | +163.0% |
| Ordinary profit margin | 1.2 | 3.0 | +1.8P |
| Profit attributable to owners of parent | 14.7 | 27.8 | +89.1% |
| EBITDA | 46.0 | 83.0 | +80.5% |
| ROE | 2.3 | 4.3 | + 2.0P |
| ROIC | 0.8 | 3.2 | + 2.4P |
| Inventory | 284.2 | 264.2 | △20.0 |
| Inventory turnover days | 80 | 71 | △9days |
| Inventory Turnover | 4.5 | 5.0 | + 0.5P |
For the Consumer Electronics Segment in FY2027 the company plans 18 new stores including 10 LIFE SELECT stores, with additional floor space of 135,000 and a floor space increase rate of 4.6% excluding the impact of store closures. Growth-area targets include e-commerce and TV shopping of 120.0 billion yen (104.2% YoY), renovation of 74.5 billion yen (112.6%), furniture and interior goods of 41.2 billion yen (104.2%), PB plus SPA original products of 180.0 billion yen (118.3%) and overseas sales of 41.0 billion yen (108.6%), alongside an inventory reduction of 20.0 billion yen to 264.2 billion yen and an inventory turnover ratio of 5.0 against 4.5.
Shareholder Returns
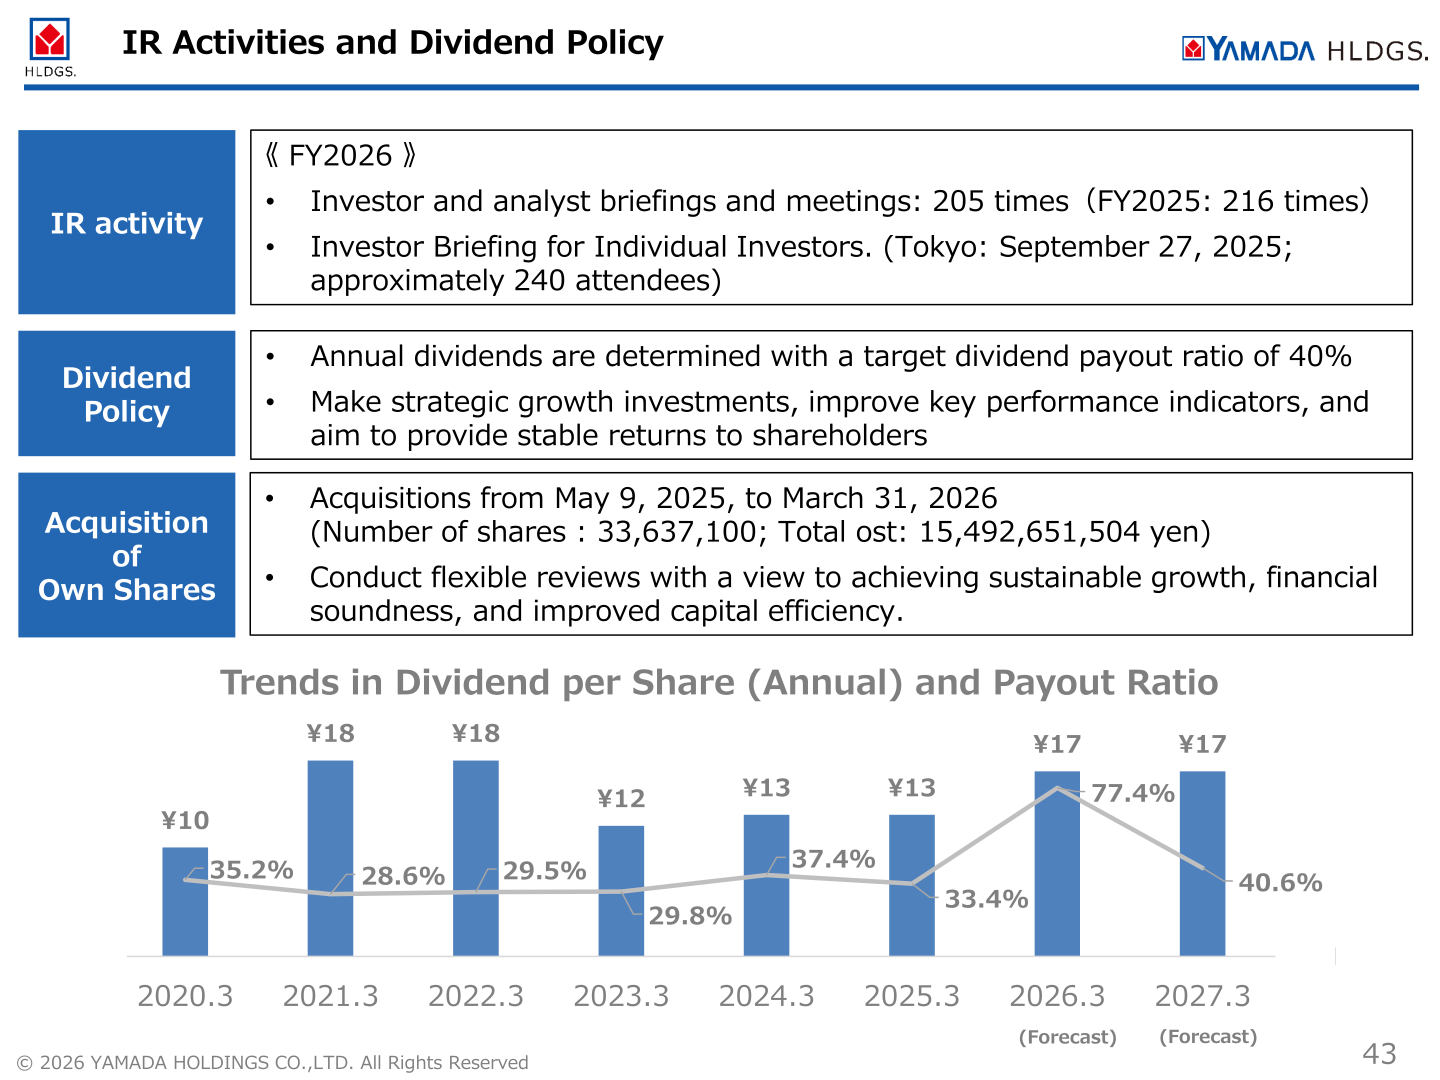
The stated dividend policy is that annual dividends are determined with a target dividend payout ratio of 40%, alongside strategic growth investments, improvement of key performance indicators and the aim of providing stable returns to shareholders. The dividend chart in the materials shows the following annual dividend per share and payout ratio for the two most recent periods, both marked as forecast.
| Fiscal year | Annual dividend per share | Payout ratio |
|---|---|---|
| 2026.3 (Forecast) | ¥17 | 77.4% |
| 2027.3 (Forecast) | ¥17 | 40.6% |
On buybacks, the company acquired its own shares from May 9, 2025 to March 31, 2026, purchasing 33,637,100 shares for a total cost of 15,492,651,504 yen, and states that it will conduct flexible reviews with a view to achieving sustainable growth, financial soundness and improved capital efficiency. The FY2027 cash allocation plan shows cash-in of 70 billion yen of operating cash flow plus 20 billion yen from inventory reduction, against 47 billion yen of growth investment — 34 billion yen in the Consumer Electronics Segment for new store opening costs and other items, 3 billion yen in the Housing Segment for model houses and other items, and 10 billion yen in the Environment Segment for construction of incineration power plants and other items — and 11 billion yen of shareholder returns at a payout ratio of 40.6% with an annual dividend per share of 17 yen. Cash not allocated to growth investments or shareholder returns is to be used to maintain and strengthen the financial foundation and set aside as a flexible investment reserve. Operating cash flow here is calculated simply as net income for the current period plus depreciation and amortization plus inventory reduction, and the plan does not include the details of the asset portfolio restructuring described elsewhere in the materials.
Medium-Term Management Plan and Topics
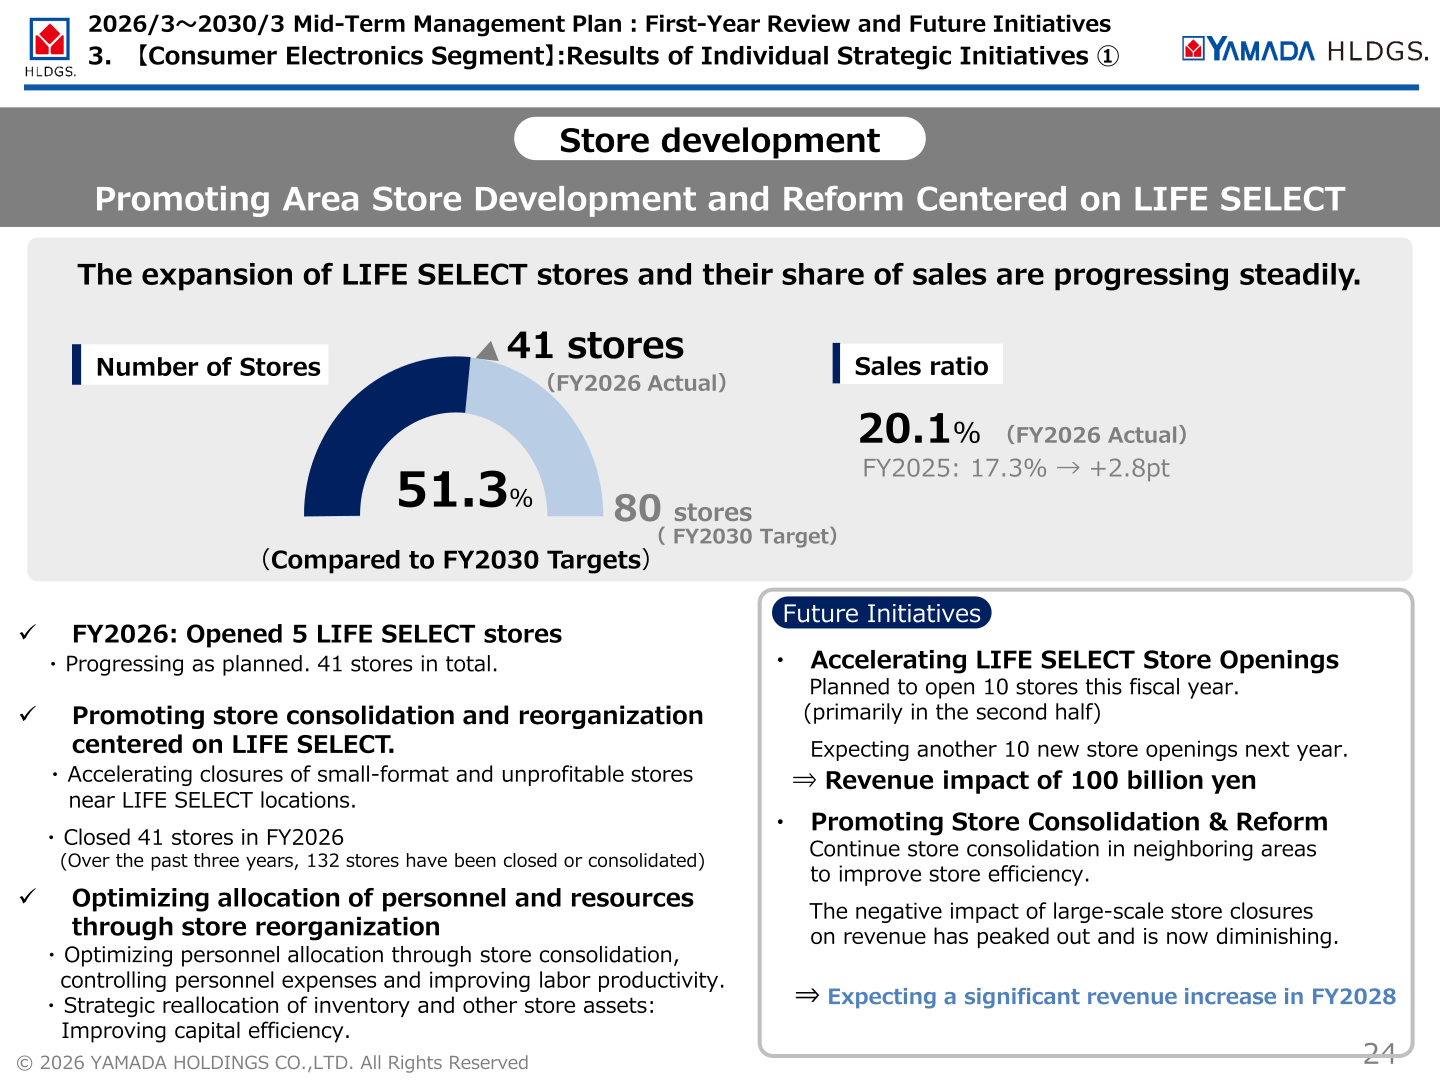
FY2026 was the first year of the 2026/3 to 2030/3 Mid-Term Management Plan. On store development, the company opened 5 LIFE SELECT stores during the year to reach 41 stores in total, which it presents as 51.3% of the FY2030 target of 80 stores, with the LIFE SELECT sales ratio rising to 20.1% from 17.3% in FY2025, a change of +2.8pt. It closed 41 stores in FY2026 and states that 132 stores have been closed or consolidated over the past three years. It plans to open 10 LIFE SELECT stores this fiscal year, primarily in the second half, and expects another 10 new store openings next year, for a revenue impact of 100 billion yen, and expects a significant revenue increase in FY2028. YAMADA DENKI operated 928 stores in total at the end of March 2026, including 11 LABI stores and 41 LIFE SELECT stores.
For PB and SPA products, FY2026 net sales of 152.2 billion yen represent 44.8% of the FY2030 target, and the company revised its final-year targets upward to a sales composition exceeding 20% with sales surpassing 340 billion yen. Renovation sales of 66.2 billion yen and furniture and interior goods sales of 39.5 billion yen stand at 45.6% and 43.9% of their FY2030 targets of 145.0 billion yen and 90.0 billion yen respectively. On inventory, the annual reduction target of 20 billion yen was not met, but the company states that the strategic inventory disposal of approximately 24 billion yen accelerated improvements in inventory turnover and product freshness, with inventory turnover of 4.5 turns in FY2026 against 4.0 turns in FY2025.
The capital policy section sets an FY2030 target of ROE of 8.5% or more against a cost of equity of approximately 7.0% calculated on the Capital Asset Pricing Model basis, with the aim of a PBR exceeding 1.0x; PBR was 0.54x as of April 30, 2026. Identifying low asset turnover as the primary driver of the sub-1.0x PBR, the company plans an asset portfolio reorganization, divesting non-core and low-profit assets and shares held with a scale of asset sales of approximately 130 billion yen on an acquisition-cost basis — which includes approximately 10 billion yen of assets scheduled for sale in the fiscal year ending March 2027 as disclosed on February 16, 2026 — and concentrating the cash generated on growth areas, flexible shareholder returns, strategic M&A investments, accelerated LIFE SELECT store development and reduction of interest-bearing debt, aiming to achieve a PBR over 1.0x within two years, ahead of schedule.
On IR activity, the company held 205 investor and analyst briefings and meetings in FY2026 against 216 in FY2025, and held an investor briefing for individual investors in Tokyo on September 27, 2025 with approximately 240 attendees.
This article is an analysis based on publicly available information and is not a recommendation to buy or sell any specific securities. Investment decisions are your own responsibility.
![[Obayashi] Investors’ Guide 2026 — The Complete 24-Article Breakdown](https://japan-equity.com/wp-content/uploads/2026/07/hub_cover-1024x1024.png)
![[Obayashi] IR & SR Policy — Feeding Dialogue Back into Management](https://japan-equity.com/wp-content/uploads/2026/07/p32_sq-1024x1024.jpg)
![[Obayashi] Real Estate Development — 18.7% Margin, ¥287.7bn Unrealized Gains](https://japan-equity.com/wp-content/uploads/2026/07/p20_sq-1024x1024.jpg)
![[Obayashi] Domestic Civil Engineering — Resilience Spending Supports 9.6% Margin](https://japan-equity.com/wp-content/uploads/2026/07/p11_sq-1024x1024.jpg)
![[Obayashi] Share Price & External Ratings — vs TOPIX, ESG Index Inclusion](https://japan-equity.com/wp-content/uploads/2026/07/p40_sq-1024x1024.jpg)
![[Construction] ¥75.5tn Investment, Shrinking Workforce — Big-5 Market Share](https://japan-equity.com/wp-content/uploads/2026/07/p12_sq-1024x1024.jpg)



![[Obayashi] Capital Policy & Shareholder Returns — ROE 10%+, DOE ~5%, ¥100bn Buyback](https://japan-equity.com/wp-content/uploads/2026/07/p27_sq-1024x1024.jpg)
![[Obayashi] Reducing Cross-Shareholdings — ¥285.2bn Sold in Five Years](https://japan-equity.com/wp-content/uploads/2026/07/p29_sq-1024x1024.jpg)
![[Obayashi] ¥750bn Investment Plan — ¥300bn to Development, ¥190bn to Tech/DX](https://japan-equity.com/wp-content/uploads/2026/07/p30_sq-1024x1024.jpg)
![[Obayashi] MTP2022 KPIs — Operating Profit ~2x Target, ROE 14.4%](https://japan-equity.com/wp-content/uploads/2026/07/p25_sq-1024x1024.jpg)
![[Obayashi] Cash Allocation — ¥420bn Investment CF Over Five Years](https://japan-equity.com/wp-content/uploads/2026/07/p26_sq-1024x1024.jpg)
![[Obayashi] Green Energy — 44 Plants, 344MW, and the Green Hydrogen Challenge](https://japan-equity.com/wp-content/uploads/2026/07/p21_sq-1024x1024.jpg)
![[Obayashi] Tackling the Labor Shortage — Robotics Construction®](https://japan-equity.com/wp-content/uploads/2026/07/p14_sq-1024x1024.jpg)
