
This article is based on publicly available IR materials and is not a recommendation to buy or sell any specific securities.
Note: Capcom labels the fiscal year ended March 31, 2026 as “FY26/3” and the following year’s plan as “FY27/3” in its materials; this site classifies the most recently completed fiscal year as FY2025. All labels in the text, tables and segment data below are kept exactly as presented in the company’s materials.
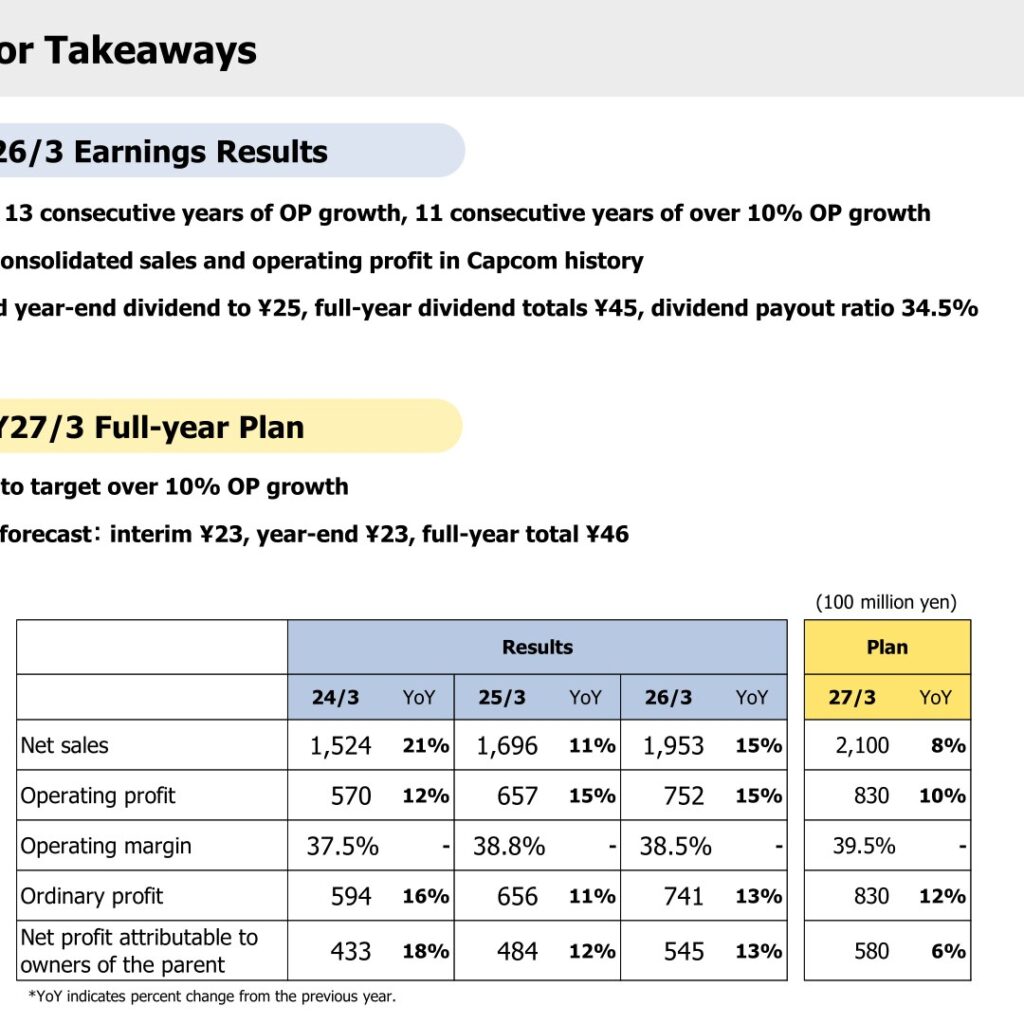
Capcom reported FY26/3 net sales of 1,953 (100 million yen), up 15% year on year, with operating profit of 752 (up 15%), ordinary profit of 741 (up 13%) and net profit attributable to owners of the parent of 545 (up 13%). The company states these were the highest consolidated sales and operating profit in Capcom history, and that it achieved 13 consecutive years of operating profit growth and 11 consecutive years of over 10% operating profit growth. Total unit sales in the Digital Contents business reached 5,907 (10 thousand units), which the company describes as a highest-ever cumulative total unit sales and catalog unit sales for a fiscal year period. For FY27/3, Capcom plans net sales of 2,100 and operating profit of 830, continuing to target over 10% operating profit growth.
Consolidated Results (Full-Year Actual)
Figures are presented in 100 million yen as shown in the materials. YoY indicates percent change from the previous year.
| Item (100 million yen) | 26/3 | YoY | 25/3 | 24/3 |
|---|---|---|---|---|
| Net sales | 1,953 | 15% | 1,696 | 1,524 |
| Operating profit | 752 | 15% | 657 | 570 |
| Operating margin | 38.5% | – | 38.8% | 37.5% |
| Ordinary profit | 741 | 13% | 656 | 594 |
| Net profit attributable to owners of the parent | 545 | 13% | 484 | 433 |
On the supplementary financial information page, gross profit was 1,102 (up 11.6%) with a gross margin of 56.4%, and sales and G&A expenses were 349 (up 6.0%). The consolidated ordinary profit margin was 37.9% and the net profit margin was 27.9%. R&D investment cost was 548 (up 12.1%), capital expenditure was 177 (up 113.1%), depreciation was 52 (up 11.2%) and promotional expense was 94 (down 8.3%). The number of consolidated employees was 3,976 (up 5.6%), of which 3,011 were developers (up 5.8%). The end-of-March foreign exchange rates were 159 USD/JPY and 183 Euro/JPY.
Segment Results
All four reportable segments grew sales in FY26/3. Digital Contents remained the largest contributor, while Amusement Equipments recorded the strongest profit growth on strong new and repeat sales of pachislo machines.
| Segment (100 million yen) | Metric | 26/3 | YoY | 25/3 |
|---|---|---|---|---|
| Digital Contents | Net sales | 1,442 | 15% | 1,251 |
| Digital Contents | Operating profit | 706 | 8% | 651 |
| Arcade Operations | Net sales | 256 | 13% | 227 |
| Arcade Operations | Operating profit | 32 | 32% | 24 |
| Amusement Equipments | Net sales | 177 | 14% | 156 |
| Amusement Equipments | Operating profit | 100 | 50% | 67 |
| Other Businesses | Net sales | 76 | 25% | 61 |
| Other Businesses | Operating profit | 36 | 47% | 24 |
| Adjustments | Operating profit | -122 | – | -110 |
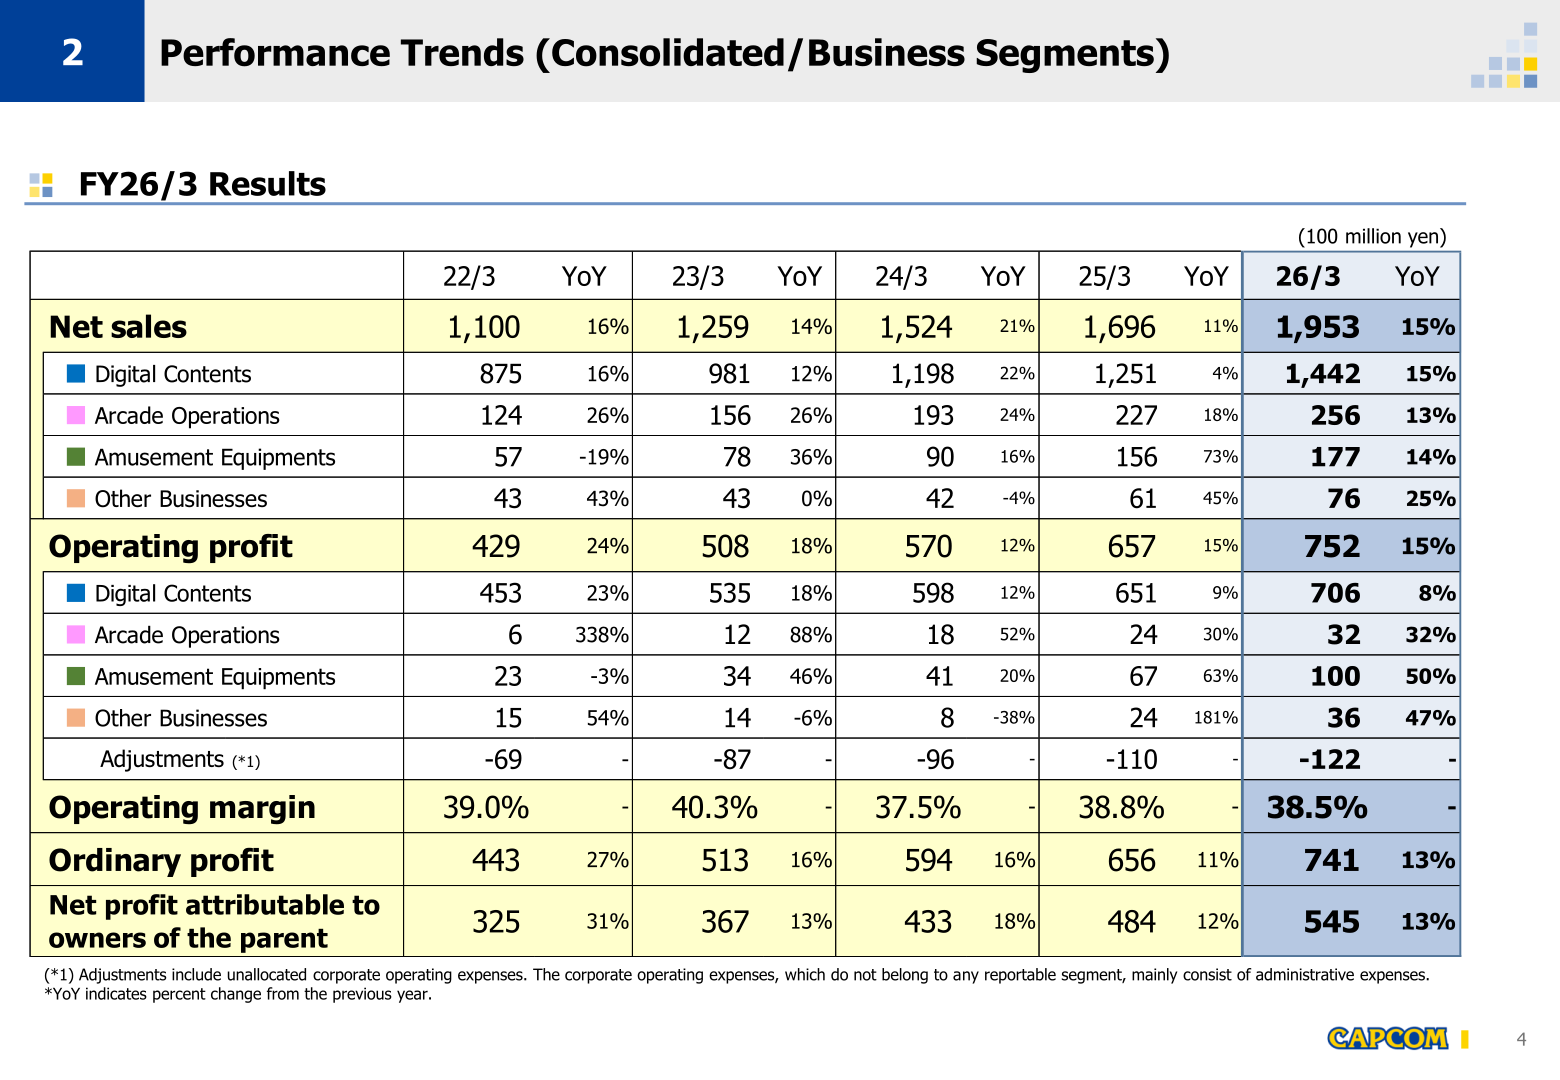
Within Digital Contents, package sales were 162 (down 10%) and digital sales including digital license were 1,256 (up 21%), of which the digital license portion was 36 (up 6%). Consumer total was 1,419 (up 17%), including a deferred revenue portion of 123. Mobile Contents was 23 (down 32%). The Digital Contents operating margin was 48.9%, versus 52.1% in 25/3. In Arcade Operations, Capcom opened 9 stores and closed 1 for a total of 61 stores (up 15%), including Capcom Store Taipei in Taiwan, its first directly operated store overseas, and CAPCOMIX Abeno Hoop Store in Osaka, an experience-based amusement facility; same store sales for the fiscal year cumulative were 108%. In Amusement Equipments, 2 new titles were released and 45,000 total units were sold (down 10%), comprising Devil May Cry 5 Stylish Tribe sales of 11,000 units (operating since June) and Shin Onimusha 3 sales of 24,500 units (operating since October). Other Businesses comprised Character sales of 63 (up 19%) and eSports/Media sales of 12 (up 50%), with Character operating profit of 43 and eSports/Media operating loss of -6.
Digital Contents: Unit Sales and Titles
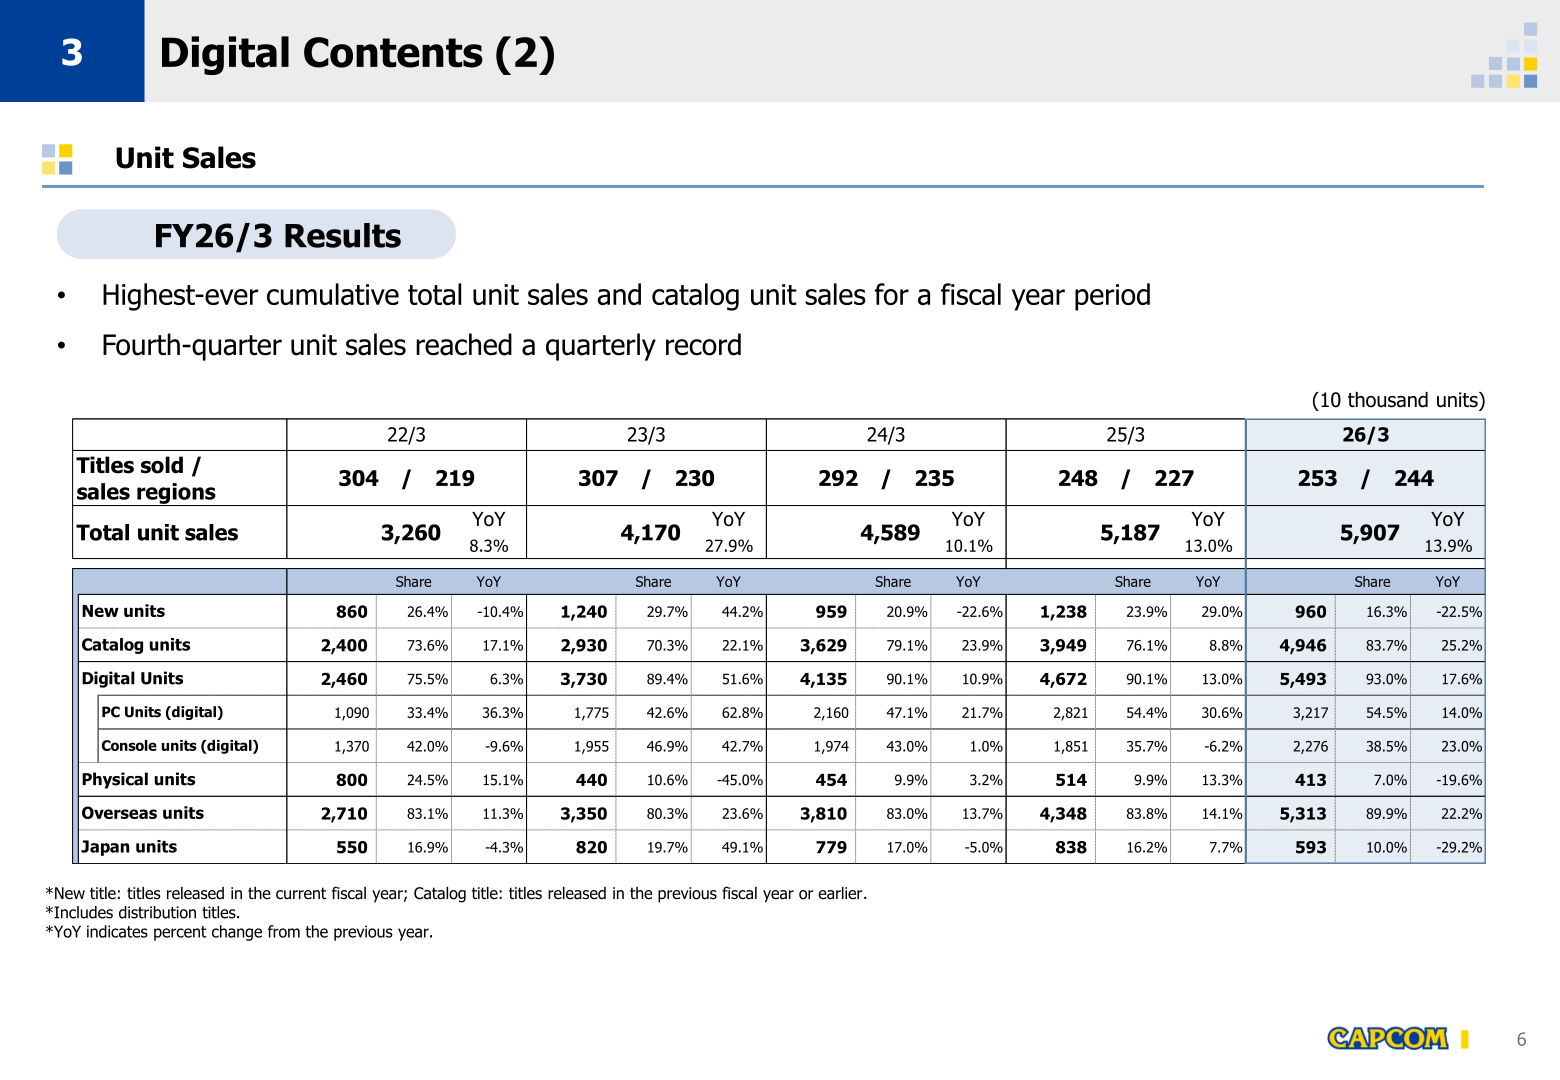
Capcom sold 253 titles across 244 countries and regions in FY26/3. Total unit sales reached 5,907 (10 thousand units), up 13.9%, driven by catalog titles. Figures below are in 10 thousand units and include distribution titles; new titles are those released in the current fiscal year and catalog titles those released in the previous fiscal year or earlier.
| Unit sales (10 thousand units) | 26/3 | Share | YoY | 25/3 |
|---|---|---|---|---|
| Total unit sales | 5,907 | – | 13.9% | 5,187 |
| New units | 960 | 16.3% | -22.5% | 1,238 |
| Catalog units | 4,946 | 83.7% | 25.2% | 3,949 |
| Digital Units | 5,493 | 93.0% | 17.6% | 4,672 |
| PC Units (digital) | 3,217 | 54.5% | 14.0% | 2,821 |
| Console units (digital) | 2,276 | 38.5% | 23.0% | 1,851 |
| Physical units | 413 | 7.0% | -19.6% | 514 |
| Overseas units | 5,313 | 89.9% | 22.2% | 4,348 |
| Japan units | 593 | 10.0% | -29.2% | 838 |
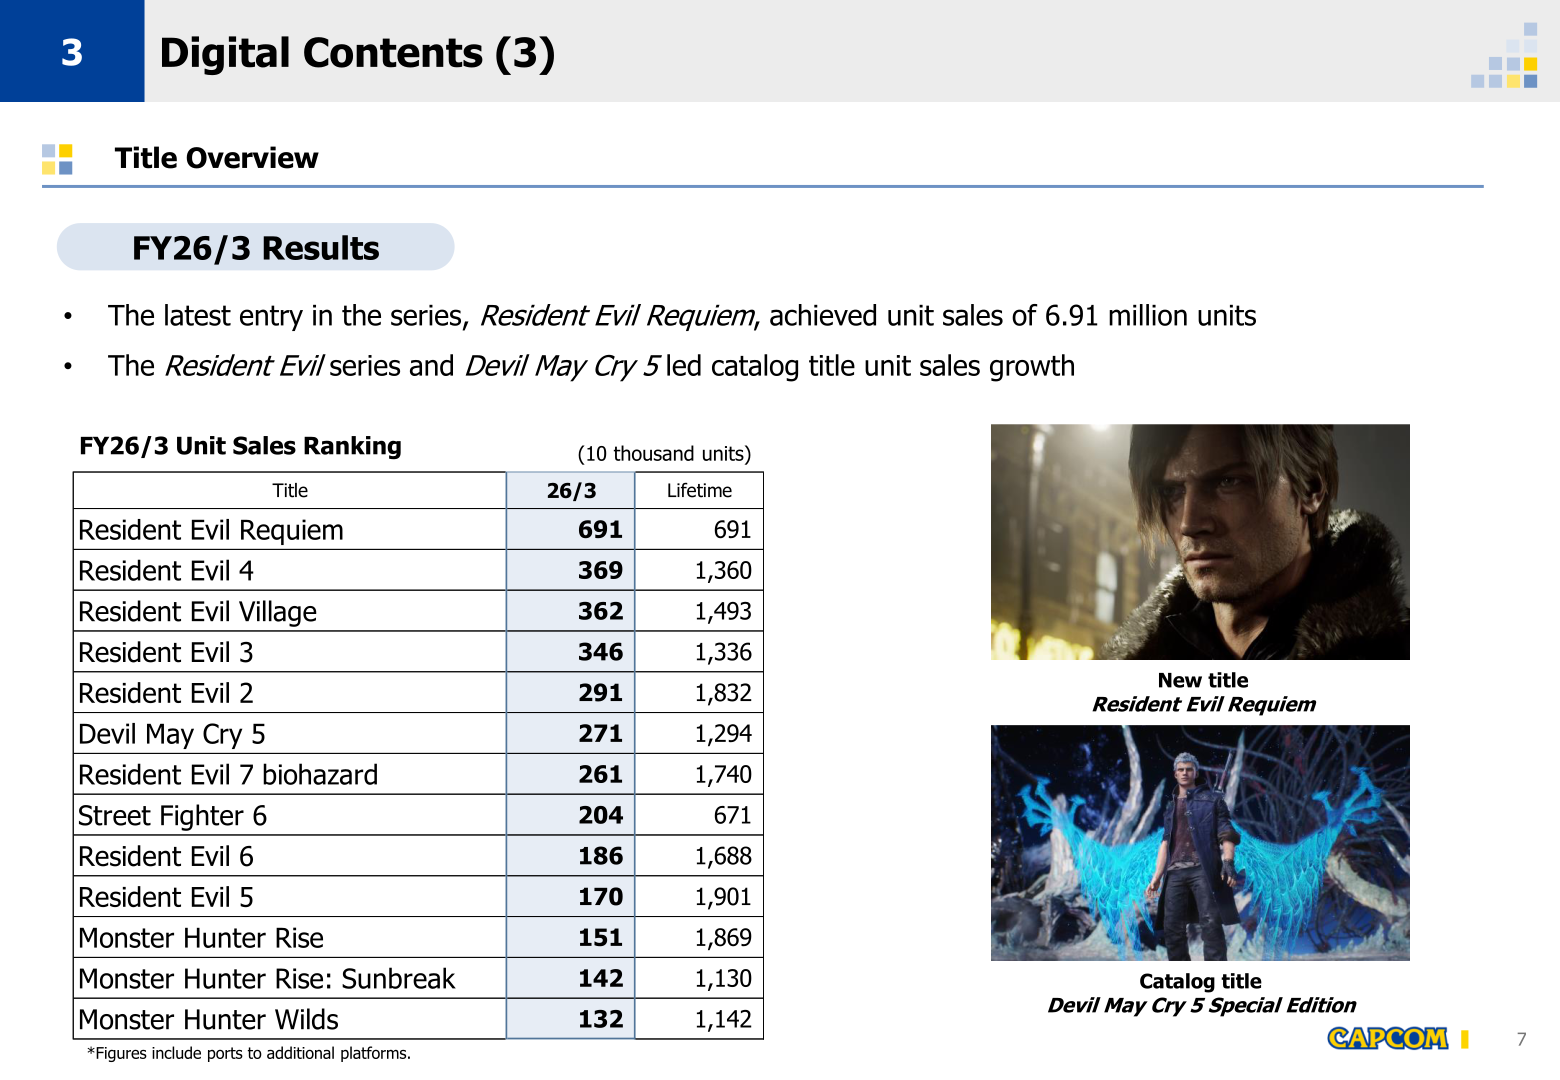
The latest entry in the series, Resident Evil Requiem, achieved unit sales of 6.91 million units, and the company states that the Resident Evil series and Devil May Cry 5 led catalog title unit sales growth. Fourth-quarter unit sales reached a quarterly record. The FY26/3 unit sales ranking below is in 10 thousand units and includes ports to additional platforms.
| Title | 26/3 | Lifetime |
|---|---|---|
| Resident Evil Requiem | 691 | 691 |
| Resident Evil 4 | 369 | 1,360 |
| Resident Evil Village | 362 | 1,493 |
| Resident Evil 3 | 346 | 1,336 |
| Resident Evil 2 | 291 | 1,832 |
| Devil May Cry 5 | 271 | 1,294 |
| Resident Evil 7 biohazard | 261 | 1,740 |
| Street Fighter 6 | 204 | 671 |
| Resident Evil 6 | 186 | 1,688 |
| Resident Evil 5 | 170 | 1,901 |
| Monster Hunter Rise | 151 | 1,869 |
| Monster Hunter Rise: Sunbreak | 142 | 1,130 |
| Monster Hunter Wilds | 132 | 1,142 |
FY27/3 Plan
Capcom plans net sales of 2,100 (up 8%) and operating profit of 830 (up 10%) for FY27/3, continuing to target over 10% operating profit growth. All-new IP PRAGMATA was released in April, and Onimusha Way of the Sword is to be released in 2026.
| Item (100 million yen) | 27/3 Plan | YoY | 26/3 | Difference |
|---|---|---|---|---|
| Net sales | 2,100 | 8% | 1,953 | 146 |
| Digital Contents | 1,522 | 6% | 1,442 | 79 |
| Arcade Operations | 293 | 14% | 256 | 36 |
| Amusement Equipments | 209 | 18% | 177 | 31 |
| Other Businesses | 76 | -1% | 76 | -0 |
| Operating profit | 830 | 10% | 752 | 77 |
| Digital Contents | 795 | 13% | 706 | 88 |
| Arcade Operations | 33 | 3% | 32 | +0 |
| Amusement Equipments | 104 | 4% | 100 | 3 |
| Other Businesses | 35 | -4% | 36 | -1 |
| Adjustments | -137 | – | -122 | -14 |
| Operating margin | 39.5% | – | 38.5% | – |
| Ordinary profit | 830 | 12% | 741 | 88 |
| Net profit attributable to owners of the parent | 580 | 6% | 545 | 34 |
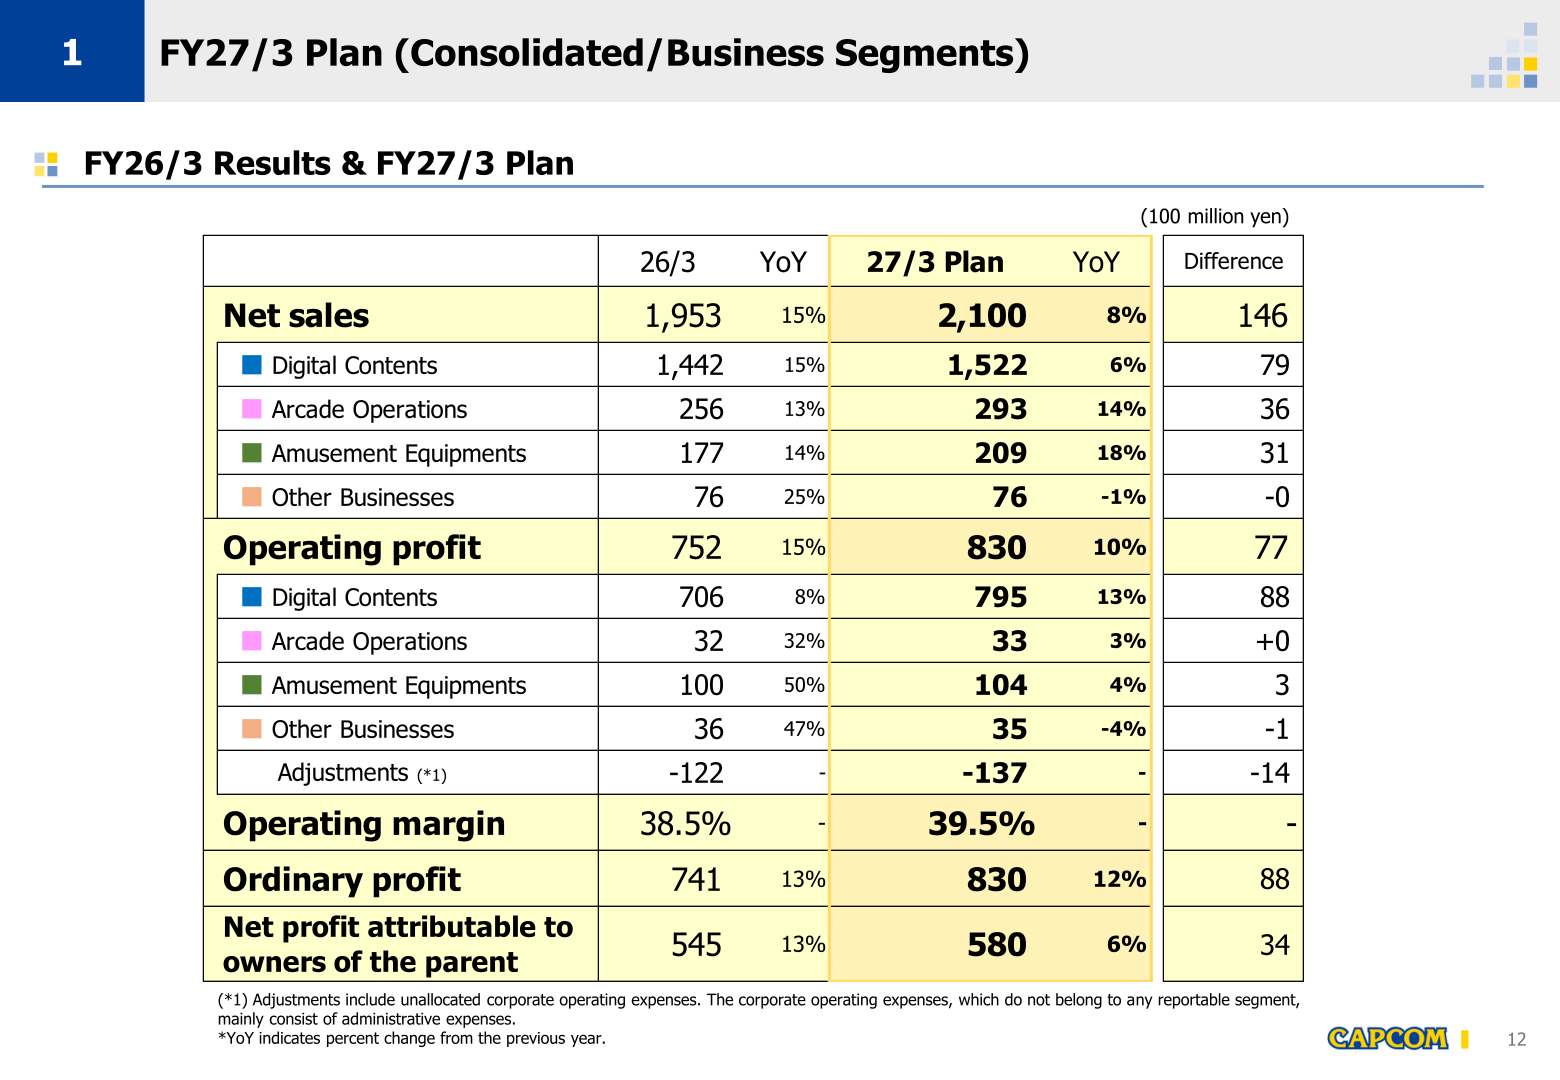
On unit sales, Capcom plans total unit sales of 6,500 (10 thousand units), up 10.0% and a difference of 593 versus FY26/3, comprising new units of 1,200 (18.5% share, up 25.0%) and catalog units of 5,300 (81.5% share, up 7.2%). Digital Units are planned at 6,200 (95.4%, up 12.9%) and physical units at 300 (4.6%, down 27.4%); overseas units are planned at 5,800 (89.2%, up 9.2%) and Japan units at 700 (10.8%, up 18.0%). In Arcade Operations, Capcom plans to open 9 new stores for a total of 70 stores, with same store sales of 106%. In Amusement Equipments, it aims to release one new machine per quarter using popular IPs, with a sales plan of 4 machines and 53,000 units total; Biohazard RE:3 launched in May. In Other Businesses, Capcom plans to hold Capcom Cup 13 and Street Fighter League: World Championship 2026 at Ryogoku Kokugikan Arena, Season 2 of the Devil May Cry anime series began streaming in May, and a live-action Street Fighter movie is scheduled for release on October 16.
Shareholder Returns
For FY26/3, Capcom increased the year-end dividend to ¥25, bringing the full-year dividend to ¥45 with a dividend payout ratio of 34.5%. For FY27/3, the dividend forecast is an interim dividend of ¥23 and a year-end dividend of ¥23, for a full-year total of ¥46. In its capital allocation policy, the company states that cash is allocated across shareholder returns, employee compensation and business reinvestment, and that it gives back to shareholders via a base 30% minimum dividend payout ratio, with employee compensation through a more tightly aligned profit-sharing bonus system and business reinvestment in development facilities, M&A and development foundation and infrastructure.
Mid- to Long-Term Growth Strategies
Capcom’s stated group management goal is 10% annual operating profit growth, supported by stable release of new titles and growth in catalog sales, and by further advancing its IP strategy and strengthening global sales. On digital sales, the company aims for annual sales of 100 million units in the long term; the catalog sales ratio was 83.7% in 26/3 and is planned at 81.5% in 27/3. Cumulative series unit sales are 201 million units for the Resident Evil series (latest title Resident Evil Requiem, released February 2026), 127 million units for the Monster Hunter series (latest title Monster Hunter Wilds, released February 2025) and 59 million units for the Street Fighter series (latest title Street Fighter 6, released June 2023), followed by Mega Man at 44 million units, Devil May Cry at 38 million units, Dead Rising at 19 million units, Ace Attorney and Dragon’s Dogma at 14 million units each, Marvel vs. Capcom at 13 million units, Onimusha at 9.1 million units and Okami at 4.8 million units.
On global sales expansion, unit sales by area in 26/3 were 1,728 (10 thousand units) in North America (29.3% share, up 11.8%), 1,349 in Asia (22.8%, up 20.4%), 1,340 in Europe (22.7%, up 39.0%), 593 in Japan (10.0%, down 29.2%), 695 in Central/South America (11.8%, up 38.2%), 94 in the Middle East (1.6%, down 33.3%), 96 in Oceania (1.6%, up 26.3%) and 12 in Africa (0.2%, up 50.0%), for total unit sales of 5,907 and five-year growth of 81.2% from 22/3. Capcom notes that figures for unit sales by area are approximate and have been rounded, so percentage growth and totals may not match the displayed figures or annual totals.
On human resources, the number of developers on a non-consolidated basis grew from 1,368 people in 14/3 to 2,842 people in 26/3, and the company aims to increase its developer workforce by over 100 people annually. R&D Building #3 adjacent to the Osaka Head Office is scheduled for completion in 2027. Diversity indicators for 26/3 include a ratio of females in core positions of 15.7%, a gender wage gap of 81.3%, a paternity leave utilization rate of 79.7% and a ratio of foreign employees of 7.9%. Capcom also describes the use of generative AI as a tool to streamline routine tasks within the development process, freeing up time for creative work.
This article is an analysis based on publicly available information and is not a recommendation to buy or sell any specific securities. Investment decisions are your own responsibility.
![[Obayashi] Investors’ Guide 2026 — The Complete 24-Article Breakdown](https://japan-equity.com/wp-content/uploads/2026/07/hub_cover-1024x1024.png)
![[Obayashi] IR & SR Policy — Feeding Dialogue Back into Management](https://japan-equity.com/wp-content/uploads/2026/07/p32_sq-1024x1024.jpg)
![[Obayashi] Real Estate Development — 18.7% Margin, ¥287.7bn Unrealized Gains](https://japan-equity.com/wp-content/uploads/2026/07/p20_sq-1024x1024.jpg)
![[Obayashi] Domestic Civil Engineering — Resilience Spending Supports 9.6% Margin](https://japan-equity.com/wp-content/uploads/2026/07/p11_sq-1024x1024.jpg)
![[Obayashi] Share Price & External Ratings — vs TOPIX, ESG Index Inclusion](https://japan-equity.com/wp-content/uploads/2026/07/p40_sq-1024x1024.jpg)
![[Construction] ¥75.5tn Investment, Shrinking Workforce — Big-5 Market Share](https://japan-equity.com/wp-content/uploads/2026/07/p12_sq-1024x1024.jpg)



![[Obayashi] Capital Policy & Shareholder Returns — ROE 10%+, DOE ~5%, ¥100bn Buyback](https://japan-equity.com/wp-content/uploads/2026/07/p27_sq-1024x1024.jpg)
![[Obayashi] Reducing Cross-Shareholdings — ¥285.2bn Sold in Five Years](https://japan-equity.com/wp-content/uploads/2026/07/p29_sq-1024x1024.jpg)
![[Obayashi] ¥750bn Investment Plan — ¥300bn to Development, ¥190bn to Tech/DX](https://japan-equity.com/wp-content/uploads/2026/07/p30_sq-1024x1024.jpg)
![[Obayashi] MTP2022 KPIs — Operating Profit ~2x Target, ROE 14.4%](https://japan-equity.com/wp-content/uploads/2026/07/p25_sq-1024x1024.jpg)
![[Obayashi] Cash Allocation — ¥420bn Investment CF Over Five Years](https://japan-equity.com/wp-content/uploads/2026/07/p26_sq-1024x1024.jpg)
![[Obayashi] Green Energy — 44 Plants, 344MW, and the Green Hydrogen Challenge](https://japan-equity.com/wp-content/uploads/2026/07/p21_sq-1024x1024.jpg)
![[Obayashi] Tackling the Labor Shortage — Robotics Construction®](https://japan-equity.com/wp-content/uploads/2026/07/p14_sq-1024x1024.jpg)
